Download presentation
Presentation is loading. Please wait.

1
Hemodynamic modeling: fundamental and practical approaches S.Mukhin, N.Sosnin, V.Koshelev, A.Bunicheva, M.Abakymov, A.Khrulenko, A.Dreval, A.Borzov, V.Lukshin Lomonosov Moscow State University, CMC department. Hemodynamic modeling: Local models Global hemodynamic Multi-scale modeling Moscow, 2014, 15-17 April, Mathematical and Computational Modelling in Cardiovascular Problems http://vm.cs.msu.su/

2
Local models AneurysmStenosisHeart 2D-3D simulation in complex domain with respect to elastic properties, rheology of blood, etc., on the base of Navier-Stokes equations., + +

3
Global model CVSS CVSS - Cardio-Vascular Simulating System- project and software The aim is to carry out estimation of hydrodynamic blood flow (velocity, pressure, cross-section) along the graph, which is physiologically adequate to human cardiovascular system, and to represent the main characteristics of of blood circulation system
 along the graph, which is physiologically adequate to human cardiovascular system, and to represent the main characteristics of of blood circulation system")
4
Q t + Kid ney Renal outflow q kid Formal mathematical description of blood circulation system as a graph Application of various models of cardiovascular system elements Global model

5
Adge of the graph correspond to different vessels or to a set of small vessels. Nodes of the graph represent areas of vessels bifurcation or tissues and organs. Each organ must be described by specific model, in the simplest case - point model. Models, associated to the node of graph, can be so complex as the stated problem requires. Model of Heart Model of stomach Model of intestine Model of liver Model of kidney Models of interaction Global model

6
Notations x u(t,x) L D(t,x), S=D 2 /4 Vessel Local coordinate Global model
 L D(t,x), S=D 2 /4 Vessel Local coordinate Global model")
7
Models of cardiovascular vessels Vessel hard pipe elastic pipe S=const S const S=S(p)S=S(p,u,Q, … ) Diameter of vessel can be constant or not constant and can depends upon a great number of physiological and physical parameters, such as pressure, coefficient of flexibility, gravitation, etc. This dependence we will call the “equation of state” S=S(P,…). Walls of vessel is supposed to be thin. Global model
. Walls of vessel is supposed to be thin. Global model.")
8
Example of specific «equation of state» p0p0p0p0 pQ Q const p min p max p1p1p1p1 Effect of autoregulation in cerebral arteries This effect can be simulated by equation of state in following form We must take into account, that different types of state equations can strongly influence on the type of mathematical problem Global model

9
We assume blood to be uncompressible viscous liquid and mark out several types of blood flows which appear in vascular modeling. 1. In practice, velocity u(t,x) of blood flow is much less then the speed (t,x) of propagation of small disturbances, u / <<1. 2. Considered types of blood flow: Stationary flow Non-stationary flow. Heart output flow Q or pressure p are given as time dependent functions (for example, periodical functions). Non - stationary flow in looped (conservative) system of vessels with given or self-regulating heart output flow or pressure functions. General principals of blood flow mathematical description in a vessel 1. The use of conservation laws 2. Quasi one-dimensional approach 3. The account of viscous effects 4. The account of external forces influence (acceleration, gravitation, vibration, etc.) Q t Q t Global model
 of blood flow is much less then the speed (t,x) of propagation of small disturbances, u / <<1. 2. Considered types of blood flow: Stationary flow Non-stationary flow. Heart output flow Q or pressure p are given as time dependent functions (for example, periodical functions). Non - stationary flow in looped (conservative) system of vessels with given or self-regulating heart output flow or pressure functions. General principals of blood flow mathematical description in a vessel 1. The use of conservation laws 2. Quasi one-dimensional approach 3. The account of viscous effects 4. The account of external forces influence (acceleration, gravitation, vibration, etc.) Q t Q t Global model.")
10
vv Mathematical model on a graph NOTATIONS S(t,x) –cross-section area u(t, x) -velocity of blood flow p(t,x) -pressure t - time x - local space coordinate - blood density ( = const). F T – viscous force F T – external force 2. To each node of a graph, which is “a bifurcation node”, two bifurcation equations are corresponded 3. To each node, which represent tissue, mass conservation law and specific model are corresponded. 1. To each edge (vessel) of a graph corresponds a “hemodynamic” system of equations i,j –numbers of converging arches in this node, z i – considering the direction of local edge coordinates. K d - Darcy coefficient Global model
 of a graph corresponds a hemodynamic system of equations i,j –numbers of converging arches in this node, z i – considering the direction of local edge coordinates. K d - Darcy coefficient Global model.")
11
Heart as an elements of integrated model Heart is described by two or four chambers heart model. Lungs Systemic circulation ventricle auricle “Two chambers” heart model consists from two cells: auricle and ventricle, and is considered as a pump. During the systole blood from ventricle propagates into aorta according to the given Q or P function, which depends not only upon time, but upon stroke volume, current auricle and ventricle volume, aortic arch baroceptors and so on. During the diastole auricle is filling up. “Four chambers’ model is arranged from “two chambers” models with different characteristics. A simplest example of “two chambers” heart model QVQV QAQA,, p mm Hg p top p bot t sys t dias t, сек Global model

12
Numerical methods and algorithms 3. Two different variants of finite- difference schemes provided for better reliability of numerical calculations. 1. Special format of graph description was constructed. It allows user to pay no attention to the way how solver treats the topology of vascular graph. 4. The total non-linear system of equations is solved with help of iteration methods (Newton method, successive iterations on coefficients of equations). 5. The obtained linear system of equations is solved mainly by direct methods. 2. Conservative finite-difference scheme with second order of approximation on each arch of graph was taken as a base. At the same time scheme is homogeneous, so it does not depends upon concrete arch. CVSS Project
. 5. The obtained linear system of equations is solved mainly by direct methods. 2. Conservative finite-difference scheme with second order of approximation on each arch of graph was taken as a base. At the same time scheme is homogeneous, so it does not depends upon concrete arch. CVSS Project.")
13
Developed data base of main arteries and venous properties allows to study general hemodynamics regularities. Adaptation of models parameters to personal clinical data of the patient, taking into account identified pathological and topological features. Consideration of personalized parameters of human cardiovascular system CVSS Project

14
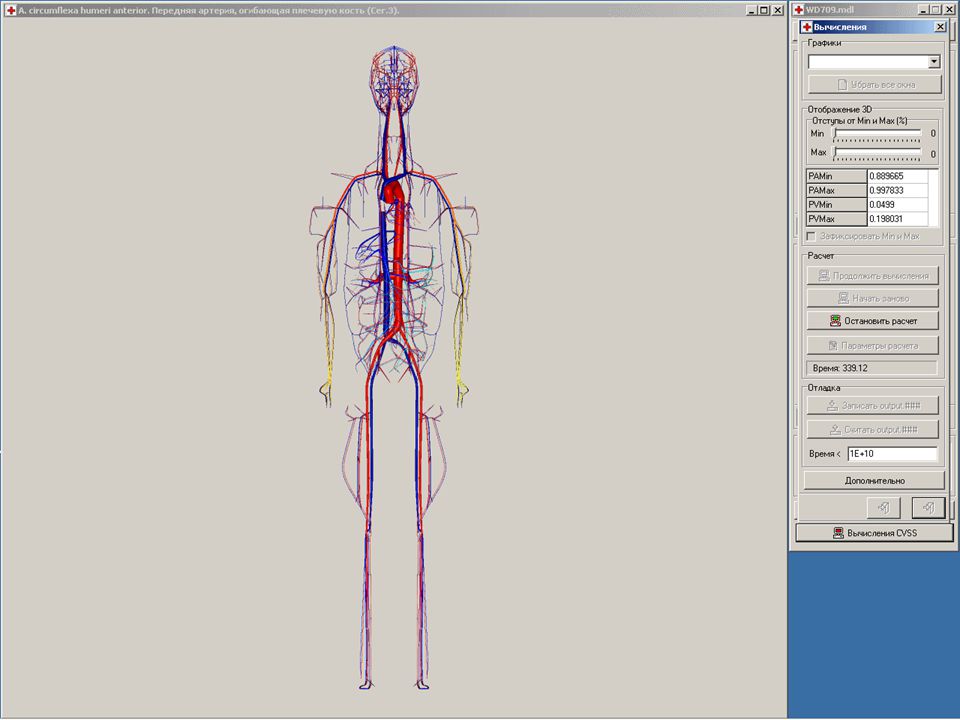
Features of 3D CVSS (Cardio-Vascular Simulating System) software. The representation of an arbitrary three-dimensional graph of cardiovascular system with the possibility of building it up, as well as narrowing. Spatial graph frame model topology and parameters editor. Automatically generated 3D model from the spatial graph frame model. Possibility to move the graph in general, as well as its parts in space in order to take into account the influence of gravity when changing body position. The use of realistic 3D models for visualization of blood vessels and the calculation results in the familiar visual form. The development of advanced tools for editing, storage and control significantly increased input data volume. Multi-threaded implementation of a sofware for parallel computation process and visualization of the results. CVSS Project

18
Modeling of functioning of the circulatory system and its regulation. Simulation and investigation of CVS diseases and their treatments. Modeling the influence of various organs on the functioning of CVS. Modeling of circulatory system influence of the functioning of various organs. Simulation of transfer by the circulatory system of various substances (gases, enzymes, drugs and so on) and their influens on different organs. Modeling the influence of CVS topology changes (as a result of surgery, injuries, etc.) Etc. Applications
 and their influens on different organs. Modeling the influence of CVS topology changes (as a result of surgery, injuries, etc.) Etc. Applications.")
19
s = s ( p ) Properties of hemodynamic equations (HMD) Hemodynamic system of equations has a hyperbolic type when equation of state meets the requirement dS/dp>0. In this case there are two characteristics, two invariants and the speed of propagation of small disturbances exists – “sonic speed” (like gas dynamics). These circumstances make possible to analyze solution of the system by means of analytic methods and help to construct numerical methods in a proper way. invariants characteristics sonic speed Due to the fact that velocity of blood flow actually is much less then the sonic speed, it turned out that in many cases we can use linear approach for HMD problems Linear analysis
. These circumstances make possible to analyze solution of the system by means of analytic methods and help to construct numerical methods in a proper way. invariants characteristics sonic speed Due to the fact that velocity of blood flow actually is much less then the sonic speed, it turned out that in many cases we can use linear approach for HMD problems Linear analysis.")
20
Evolution of small disturbances of velocity and pressure from stationary solutions of hemodynamics is described on each arch of vascular graph by the system of linearized hemodynamic equations: This system of equations supplied with linearized equation in internal nodes of graph: and with linearized boundary conditions in boundary nodes of graph. Linear approximation of hemodynamic equations (LHMD) Linear analysis
 Linear analysis.")
21
General solution of LHD equations on the i-th arch of graph is a superposition of progressing waves of general form, which propagate in opposite directions : Waves of velocity and pressure, propagating through nodes of vascular graph, change their amplitudes and phases of duration Waves of velocity and pressure, propagating through nodes of vascular graph, change their amplitudes and phases of duration i arch

22
Coefficient determines amplitude of velocity wave while passing from arch j to arch i Each of progressing waves is described by the following formula: They control the evolution of velocity and pressure waves when they pass through bifurcation nodes of vascular graph and determine amplitudes of formed waves. Coefficients and we name “transport coefficients”. Coefficient determines amplitude of velocity wave in arch i while reflecting from node ji i

23
Types of pulse pressure and velocity wave propagation along artery part of vascular system Regime with limited amplitude of wave Regime with increasing amplitude of wave Evolution of amplitude of pulse waves is defined by values of passing and reflecting coefficients in all nodes of bifurcation. In particular we can obtain matrix, which consists of passing and reflecting coefficients in all nodes of the graph. If absolute value of the product of all matrix determinants in each node is more than 1, then amplitude of pulse waves grows up with the time. Linear analysis

24
A hemodynamic factor of arterial vessel aneurism development With the help of developed technique it is possible to construct a matrix of passing and reflection coefficients in the nodes of vascular graph. An evident correlation between typical locations of artery aneurism of cerebral arteries (Willis circle), of thoracic aorta and certain numerical values of corresponding determinants of the matrix was noted. Willis circle thoracic aorta Typical location of artery aneurism
, of thoracic aorta and certain numerical values of corresponding determinants of the matrix was noted. Willis circle thoracic aorta Typical location of artery aneurism.")
25
- Amplitude of pulse wave in i-th vessel in uninjured vascular system - Amplitude of pulse wave in i-th vessel in injured vascular system 1 - H=0%, 2 - H=25%, 3 - H=50% 4 - H=75%, 5 - H=90% 1 - R=1, 2 - R=0.5, 3 - R=0.1 4 - R=0.01 The results, obtained by means of analytic methods, allowed to establish relationship between degree of symptoms of Takaysu disease (deficient pulse, determined, in mathematical terms, by values of transport coefficients) and the degree of arterial involvement. Takaysu disease

26
Gravitational influence g The performed methodic allows to investigate the influence of gravitational forces on human hemodynamics. Numerical simulation on a full graph (systemic circulation + cerebral circulation) helps to investigate changes in hemodynamics under growing gravity Volume of blood in brains strongly falls under influence of gravitation force Blood supply of brain sections also decreases Theoretical studies of viscous fluid (blood) flow in the net of elastic vessels allow to understand, what are the problems which must be solved in order to carry out modeling of gravitational influence.
 helps to investigate changes in hemodynamics under growing gravity Volume of blood in brains strongly falls under influence of gravitation force Blood supply of brain sections also decreases Theoretical studies of viscous fluid (blood) flow in the net of elastic vessels allow to understand, what are the problems which must be solved in order to carry out modeling of gravitational influence..")
27
middle cerebral artery femoral artery Gravitational influence

28
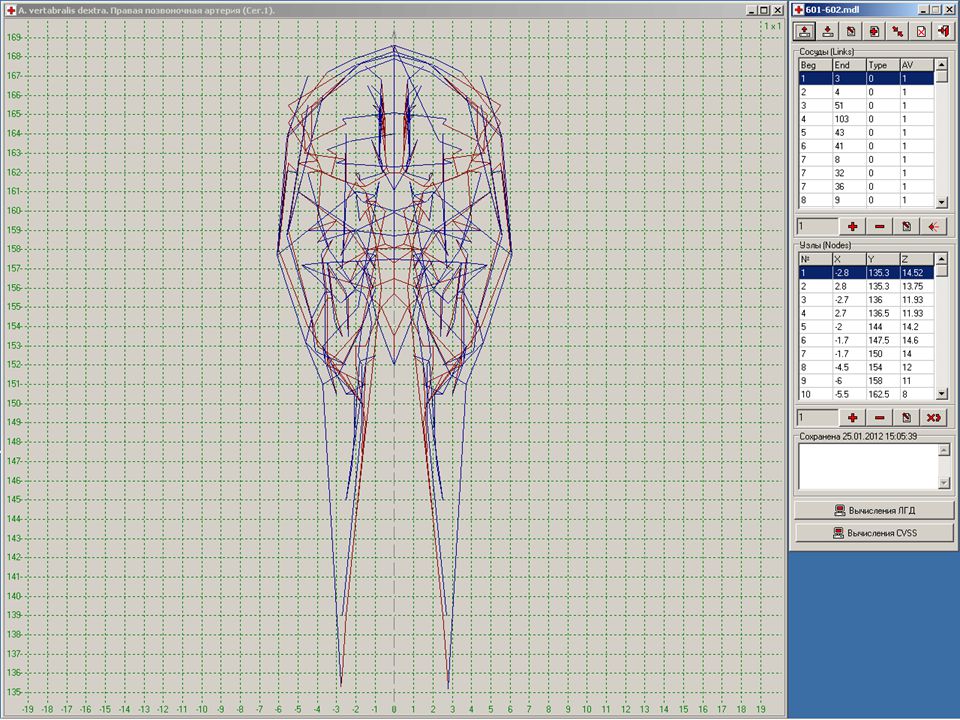
Model graph of brain arteries View of brain arteries Cerebral hemodynamics modeling The first step in hemodynamics modeling is the construction of certain vascular graph. Let us consider the graph of main brain arteries up to the third order of bifurcation. Brain tissues Collaterals Heart Arms “Point” model of the rest part of CVS Circle of Willis According to the task of cerebral hemodynamics modeling the complexity of vascular graph can be different. Presented graph includes heart, arch of aorta, scheme of arms,vertebral arteries, carotids, Willis circle, arteries P1,P2,P3, A1,A2,A3,M1,M2,M3, collaterals and some others. Venous return presented schematically. The influence of the rest CVS described by “point model”.

29
Patient P. had stenos 70%on right internal carotid artery and stenos 90% on left carotid artery. Parameters of his brain arteries (length, diameters, elastic properties, etc.) and heart activity were taken from clinical study. During the operation treating some cross- clamping (occlusions) of arteries in certain points (points 2-9 on the picture) were needed. The question : What will than happen with blood supply of different parts of brain? Results of mathematical simulation It appears that in all cases blood supply of brain does not change dramatically - deficit is not more then 20% First column is the flow without occlusions. Why is that ? ? The deficiency is made up by collateral circulation (not by the circle of Willis in this case) Blood flows in collaterals Blood flows strongly change after cross- clamping in comparison with normal state Points of occlusion Cerebral hemodynamics modeling
 and heart activity were taken from clinical study. During the operation treating some cross- clamping (occlusions) of arteries in certain points (points 2-9 on the picture) were needed. The question : What will than happen with blood supply of different parts of brain. Results of mathematical simulation It appears that in all cases blood supply of brain does not change dramatically - deficit is not more then 20% First column is the flow without occlusions. Why is that . The deficiency is made up by collateral circulation (not by the circle of Willis in this case) Blood flows in collaterals Blood flows strongly change after cross- clamping in comparison with normal state Points of occlusion Cerebral hemodynamics modeling.")
30
Mass transfer (CVSS) Thought the hemodynamic parameters are known, possibility to calculate transfer of substances by blood appears. Let us assume, that - mass concentration of l -th substance in k- th vessel, then mass transfer along the vessels net is described by system of equations with boundary conditions at each inner node (linking conditions) where and describe the external mass flows and chemical reactions correspondingly.
 where and describe the external mass flows and chemical reactions correspondingly..")
31
Main elements : precise insulin pump continues real-time sensor of glucose level real-time calculation of bolus (the amount of insulin which must be delivered to patient) The main attention is paid to the program, which is the key factor. It is necessary to develop a precise algorithm which calculates the right amount of insulin at the right time. The artificial pancreas is a developing technology which is aimed to provide people with diabetes automatically control of blood glucose level and to provide insulin replacement. Current project refers to the medical equipment approach: - using of insulin pump under closed loop control - using real-time data from a continuous blood glucose sensor Analysis and calculation of dose Pump Patient Control Insulin injection Sensor Artificial pancreas

32
To develop an intelligent and predictive algorithm for computing real-time insulin injection control it is necessary : To process a huge amount of accumulated physiological data To determine profiles of required bolus according to various peculiarities of the patient under different glucose burden To study qualitative and quantitative characteristics of spatial distribution of insulin and glucose in vessels net To specify characteristic times and rates of circulating insulin in system of blood vessels in dependence upon the point of its injection To personalize data (endocrinological tests) ETC. Development of computer simulation and mathematical models of insulin production, intake of glucose and regulationofglicemiacan significantly ease the construction of control utility. Development of computer simulation and mathematical models of insulin production, intake of glucose and regulation of glicemia can significantly ease the construction of control utility. Artificial pancreas

33
For the simulation of the spatial-time dependant dynamics of glucose and insulin we need: To be able to estimate (model) blood flow in the closed CVS ( ! ), To carry out computation of the process in network vessels for a long time (up to 16-20 hours). To be able to count (simulate) the transfer of at least of two substances in this system. The algorithm should be conservative ( ! ). To formalize (to described in mathematical terms) the processes of glucose incom and excretion; to formalize introduction of insulin and excretion of insulin, depending on the level of sugar. To determine the parameters of the model ( ! ). Modeling insulin and glucose dynamics.
, To carry out computation of the process in network vessels for a long time (up to hours). To be able to count (simulate) the transfer of at least of two substances in this system. The algorithm should be conservative ( . ). To formalize (to described in mathematical terms) the processes of glucose incom and excretion; to formalize introduction of insulin and excretion of insulin, depending on the level of sugar. To determine the parameters of the model ( . ). Modeling insulin and glucose dynamics..")
34
On the base of CVSS quasi one- dimensional methodic Main organs and tissues are taken into account (the set may be expanded) Glucose and insulin sources can be placed anywhere in the system in order to simulate normal and bolus insulin and glucose income. Production and interference of both substances can be configured to represent normal or pathological glucose-insulin dynamics. Graph of vessels can be designed to suit ordered physiological accuracy, thus allowing to research in details glucose and insulin redistribution, specific to the considered diabetes mellitus. Modeling insulin and glucose dynamics. Modeling of insulin and glucose distribution is based on the high accuracy algorithm of their transfer with blood flow, income and elimination. On the base of endocrinological tests and clamp tests it is possible to tune personal parameters of the model mg/h, mUN/h, g/hcoeff Stomach 3 1.6 36,3 — — Spleen 415.9 837 — — Stomach ВB 523.5 413 0.49 0.02 Leg rt12 7.2 131 0.5 0.07 Leg lt13 7.2 131 0.5 0.07 Liver arter.24 15 264 — — Liver vein.2548.4 1823 — — Liver port. 26 69 2088 10.0155 Arms (lf. rt) 34 4.3 81 0.17 0.04 Brain 45 7.4 130 1.46 0.2 Brain 46 7.4 130 1.46 0.2 Brain 48 4.7 77 1.1 0.27 Kidney rt. 55 23.3 119 — — Kidney lt. 58 23.5 414 0.2 0.01 Pancrea 85 7.4 838 0.2 0.028
 Brain Brain Brain Kidney rt — — Kidney lt Pancrea")
35
The effect of “delay” in the propagation of glucose. Average level of glucose increase Average level of glucose decrease Map of glucose and insulin rate shows the distribution of those substances in every point of vessel at any time Glucose in femoral artery and vein It appears, that concentration of glucose stays on the high level for significant time in femoral veins (and in some other veins) even when the level of glucose in check-points (arms and abdominal wall) is satisfactory. Modeling insulin and glucose dynamics. Glucose burden
 even when the level of glucose in check-points (arms and abdominal wall) is satisfactory. Modeling insulin and glucose dynamics. Glucose burden.")
36
Multiscale Modeling. Solution of 2D or 3D Navier-Stokes equations in selected vessels in order to investigate the flow in area of vessels wall singularities. Such approach allows to analyze the mutual influence of global and local hemodynamics. This is actual when blood flow studded in cases of stenosis, thrombus, etc. While global hemodynamics is computed in quazi one-dimensional case and is tuned on possibilities of PC, local 3D flow calculations may need parallel HPC abilities. Global hemodynamics gives relevant boundary conditions for local 2D-3D modeling

37
Thank you for attention Sergey Mukhin, prof., Department of Computational Methods, Faculty of Computational Mathematics and Cybernetics, Moscow State Univesity, Leninskie Gory,Moscow, Russia. e-mail:vmmus@cs.msu.sue-mail:vmmus@cs.msu.su, web:http//vm.cs.msu.ru Mathematical model of haemodynamics of cardio-vascular system / М. Abakumov, К. Gavriluk, N.Esikova et al. // Differential Equations ( in Rus.)— 1997. — Vol. 33, № 7. — p. 892–898. Analysis and comparison of some analytic and numerical solutions of hemodynamic problems / I. Ashmetkov, A. Khrulenko, S. Mukhin et al. // Differential Equations. — 2000. — Vol. 36, no. 7. — P. 1021–1026. An averaged nonlinear model of hemodynamics on the vessel graph / A. Bunicheva, S. Mukhin, N. Sosnin, A. Favorskii // Differential Equations. — 2001. — Vol. 37, no. 7. — P. 949–956. Mathematical modeling of some applied problems in haemodynamics / A. Bunicheva, S. Mukhin, N. Sosnin et al. // Computational Mathematics and Modeling. — 2002. — Vol. 13, no. 4. — P. 382–412. Numerical experiment in hemodynamics / A. Bunicheva, S. Mukhin, N. Sosnin, A. Favorskii // Differential Equations. — 2004. — Vol. 40, no. 7. — P. 984–999. Mukhin S., Sosnin N., Favorskii A. The effect of viscous friction on pulse waves // Differential Equations. — 2006. — Vol. 42, no. 7. — P. 1041–1056. Analytic study of stationary hemodynamic flows in an elastic vessel with friction / S. Mukhin, M. Menyailova, N. Sosnin, A. Favorskii // Differential Equations. — 2007. — Vol. 43, no. 7. — P. 1011–1015. Borzov A., Mukhin S., Sosnin N. Conservative schemes of matter transport in a system of vessels closed by the heart // Differential Equations. — 2012. — Vol. 48, no. 7. — P. 919–928. Studying the influence of gravitational overloads on the parameters of blood flow in vessels of greater circulation / A. Bunicheva, M. Menyailova, S. Mukhin et al. // Mathematical Models and Computer Simulation. — 2013. — Vol. 5, no. 1. — P. 81–91.
— — Vol. 33, № 7. — p. 892–898. Analysis and comparison of some analytic and numerical solutions of hemodynamic problems / I. Ashmetkov, A. Khrulenko, S. Mukhin et al. // Differential Equations. — — Vol. 36, no. 7. — P. 1021–1026. An averaged nonlinear model of hemodynamics on the vessel graph / A. Bunicheva, S. Mukhin, N. Sosnin, A. Favorskii // Differential Equations. — — Vol. 37, no. 7. — P. 949–956. Mathematical modeling of some applied problems in haemodynamics / A. Bunicheva, S. Mukhin, N. Sosnin et al. // Computational Mathematics and Modeling. — — Vol. 13, no. 4. — P. 382–412. Numerical experiment in hemodynamics / A. Bunicheva, S. Mukhin, N. Sosnin, A. Favorskii // Differential Equations. — — Vol. 40, no. 7. — P. 984–999. Mukhin S., Sosnin N., Favorskii A. The effect of viscous friction on pulse waves // Differential Equations. — — Vol. 42, no. 7. — P. 1041–1056. Analytic study of stationary hemodynamic flows in an elastic vessel with friction / S. Mukhin, M. Menyailova, N. Sosnin, A. Favorskii // Differential Equations. — — Vol. 43, no. 7. — P. 1011–1015. Borzov A., Mukhin S., Sosnin N. Conservative schemes of matter transport in a system of vessels closed by the heart // Differential Equations. — — Vol. 48, no. 7. — P. 919–928. Studying the influence of gravitational overloads on the parameters of blood flow in vessels of greater circulation / A. Bunicheva, M. Menyailova, S. Mukhin et al. // Mathematical Models and Computer Simulation. — — Vol. 5, no. 1. — P. 81–91..")
Similar presentations


 – Check your Have a Heart answers online. Extra Credit- Blood.>")


>")


