Download presentation
Presentation is loading. Please wait.

1
Zero Energy Response of ADF Raw ADC and ADF Output Et & New “36 LiveX sampling mode” for Find_DAC Philippe Laurens MSU -- 19 Sept 2006 (rev 20-sept-2006)
")
2
2x New Tools on L1Cal TCC 2x New Tools to investigate the synchronous noise in the BLS signals –1) look at 4x oversampled RawADC counts All 636 samples per turn including 36 samples used to determine Live X energy –2) look at ADF Ouput Et for Live Crossings Just 36 Live Crossings This is the data sent to the TABs Observing the noise; not energy deposits Random noise Synchronous noise (wrt 132 ns, or 21 us, or …)
 look at 4x oversampled RawADC counts All 636 samples per turn including 36 samples used to determine Live X energy –2) look at ADF Ouput Et for Live Crossings Just 36 Live Crossings This is the data sent to the TABs Observing the noise; not energy deposits Random noise Synchronous noise (wrt 132 ns, or 21 us, or …)")
3
Profile Raw ADC (i.e. BLS signal) For each Trigger Tower tested –Collect 1000 whole turns snapshots –Build 4x159=636 independent histograms –Report details Average for each “sub-tick” Standard Deviation for each sub-tick –Report summaries Average of the 636 Averages Standard Deviation of 636 Averages Average of 636 Standard Deviations Standard Deviation of 636 Standard Deviations Ditto for the 36 samples used for Live Crossings
 For each Trigger Tower tested –Collect 1000 whole turns snapshots –Build 4x159=636 independent histograms –Report details Average for each sub-tick Standard Deviation for each sub-tick –Report summaries Average of the 636 Averages Standard Deviation of 636 Averages Average of 636 Standard Deviations Standard Deviation of 636 Standard Deviations Ditto for the 36 samples used for Live Crossings.")
4
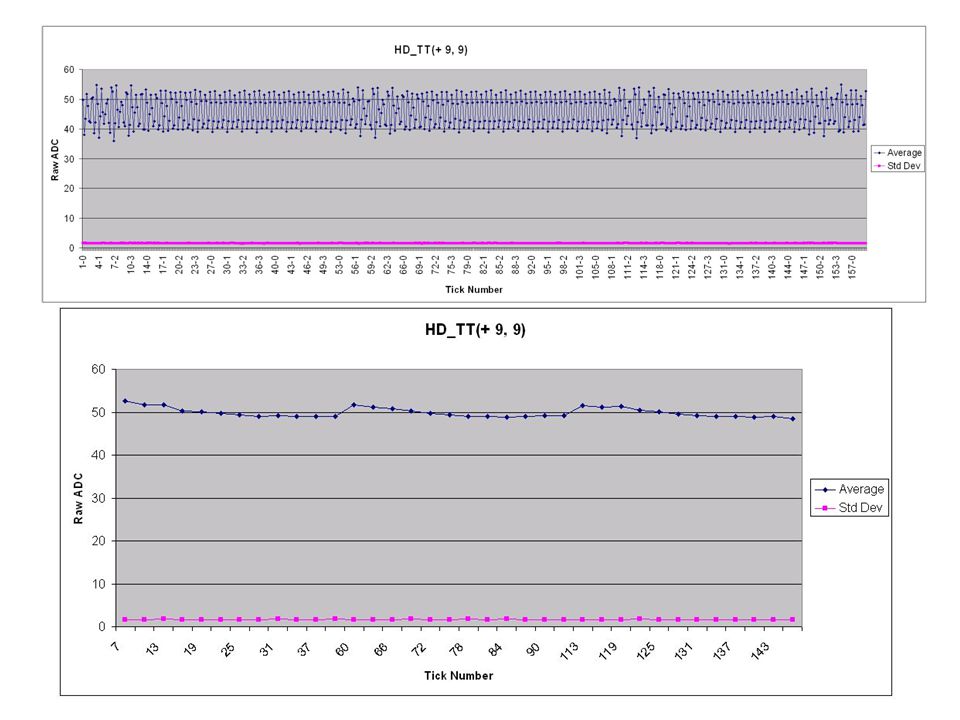
Profile Raw ADC (i.e. BLS signal) –This is rather slow takes about 4 seconds per EM or HD Tower –Does not interfere with other monitoring –Collected data for all 32x HD at TT_Eta=+9 –Picked this range because monitoring showed towers away from zero energy response of 8 –We see it on the scope, we see it in monitoring, we see it in the data collected…
 –This is rather slow takes about 4 seconds per EM or HD Tower –Does not interfere with other monitoring –Collected data for all 32x HD at TT_Eta=+9 –Picked this range because monitoring showed towers away from zero energy response of 8 –We see it on the scope, we see it in monitoring, we see it in the data collected….")
10
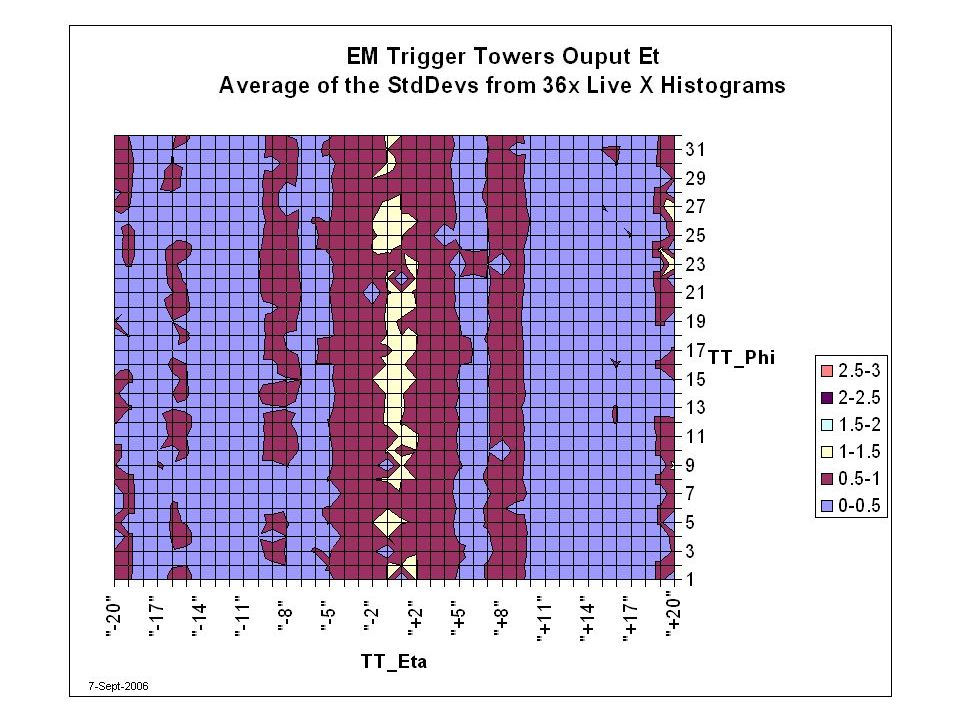
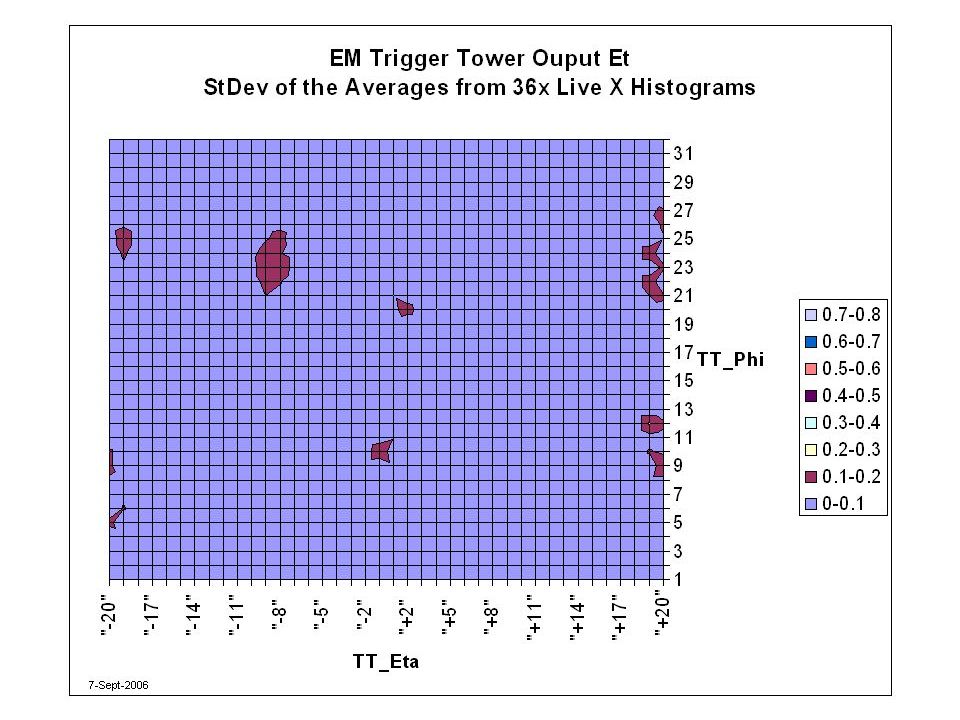
Profile Output Et (i.e. TAB Input) For each Trigger Tower tested –Collect 1000 whole turns snapshots –Build 36 independent histograms –Report details Average for each Live X Standard Deviation for each Live X Data in histograms –Report summaries Average of the 36 Averages Standard Deviation of 36 Averages Average of 36 Standard Deviations Standard Deviation of 36 Standard Deviations
 For each Trigger Tower tested –Collect 1000 whole turns snapshots –Build 36 independent histograms –Report details Average for each Live X Standard Deviation for each Live X Data in histograms –Report summaries Average of the 36 Averages Standard Deviation of 36 Averages Average of 36 Standard Deviations Standard Deviation of 36 Standard Deviations.")
11
Profile Output Et (i.e. TAB Input) –This is faster (15mn for the whole thing) –But interferes with the monitoring service
 –This is faster (15mn for the whole thing) –But interferes with the monitoring service.")
17
New Find_DAC sampling mode Old Find_DAC mode was using all oversampled data New option is to use just the 36 samples used to determine the Live X Output Et The algorithm has not changed

18
New Find_DAC sampling mode Test was both successful… –Worked just fine for most towers –will produce “better” Zero Energy Response=8 … and a failure –Bumped into a new “phenomenon” –On Sept 7 th and again 14 th the average Raw ADC for some regions would shift by several counts within milliseconds –This is not a feature of the sampling mode

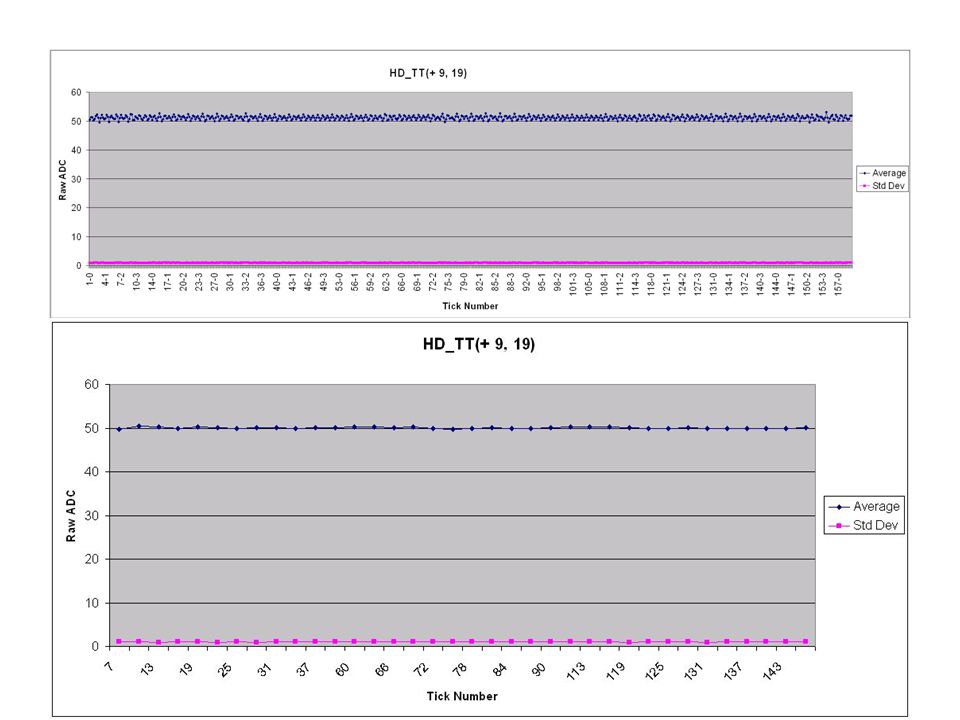
19
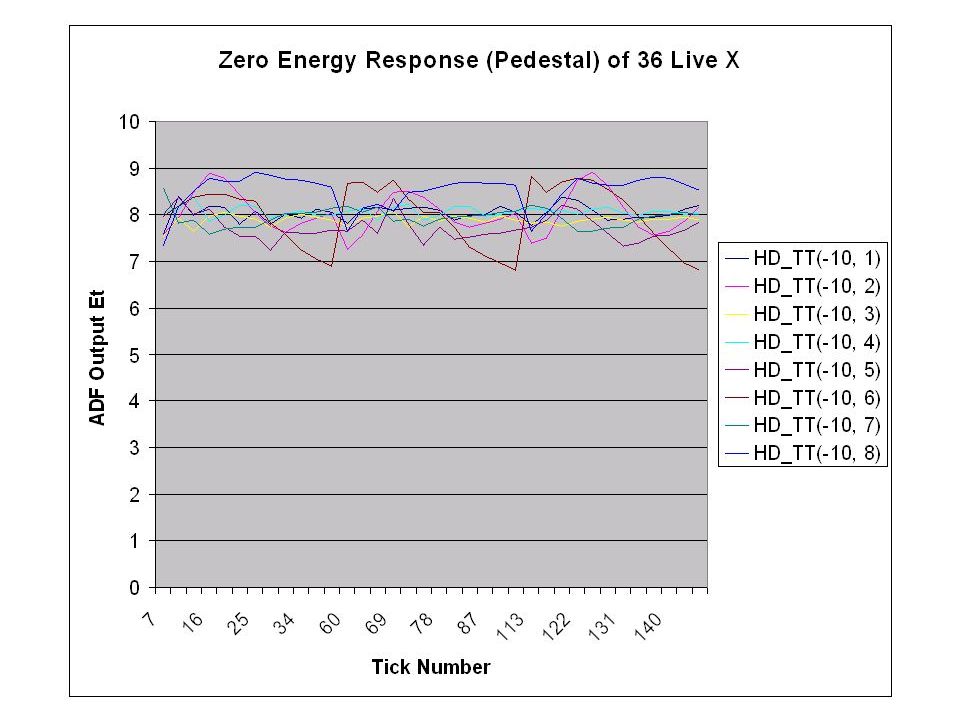
“Well behaved” example in 36 LiveX Mode from new Find_DAC run

20
“Well behaved” example in All 636 Mode from new Find_DAC run

21
“Well behaved” example in All 636 Mode from older Find_DAC run

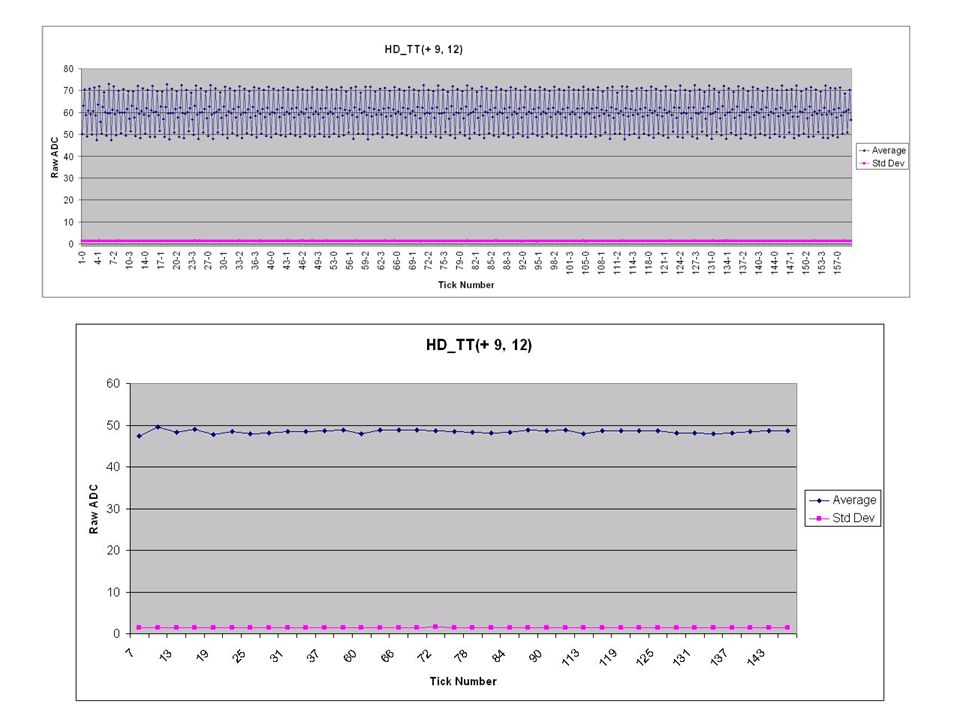
22
“Pathological” example in 36 LiveX Mode from new Find_DAC run

23
“Pathological” example in All 636 Mode from new Find_DAC run

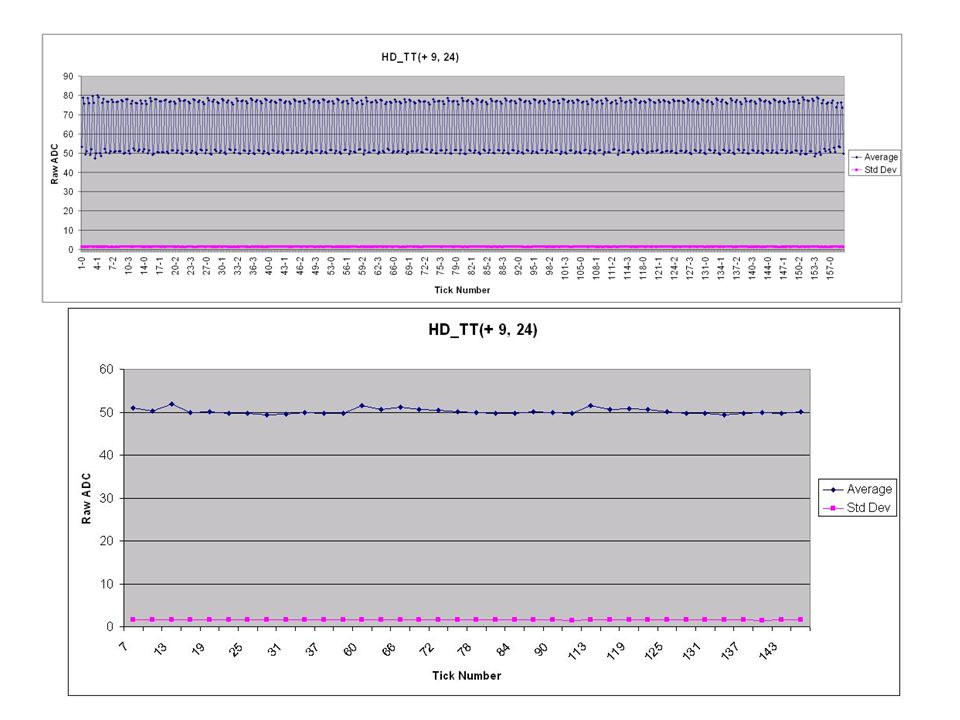
24
“Pathological” example in All 636 Mode from old Find_DAC run

25
What is/was going on? Could it be this: –Date Created: Saturday, September 16, 2006 4:01:35 PM CDT Keyword(s): :CAPTAIN:END_SHIFT: * major CAL noise problem found due to PDT033, possibly bad control board
: :CAPTAIN:END_SHIFT: * major CAL noise problem found due to PDT033, possibly bad control board.")
26
Summary These are new tools still being developed To study the BLS data –Provide hints on the source of noise? –Provide hints on the path of the noise? To understand L1Cal TT Et data –Improve input to TABs? –Discrepancy vs Thomas’ ZB averages?

Similar presentations


 during 14-Jan-2008 05-Feb-2008.>")


 Philippe Laurens Michigan State University 16-Oct-2007.>")

 (see Jovan’s talk for electron.>")
 …Individual Towers Philippe Laurens Michigan State 02-Oct-2007.>")


 tsim_l1cal2b ADF simulation Signal processing (thermal noise)>")