Download presentation
Presentation is loading. Please wait.

1
Atmospheric Mercury in the Guadalupe Watershed Andy Lincoff Peter Husby Barbara Bates US EPA Region 9 Laboratory Richmond, CA Richmond, CA

2
What I Will Cover…….. Description of USEPA R9 Laboratory Hg Trailer Description of USEPA R9 Laboratory Hg Trailer Description of Total, Speciation and Particulate Hg analysis Description of Total, Speciation and Particulate Hg analysis Mercury Monitoring Associated with a remediation site near the USEPA R9 Laboratory Mercury Monitoring Associated with a remediation site near the USEPA R9 Laboratory Atmospheric Mercury Speciation in Guadalupe Watershed Atmospheric Mercury Speciation in Guadalupe Watershed

5
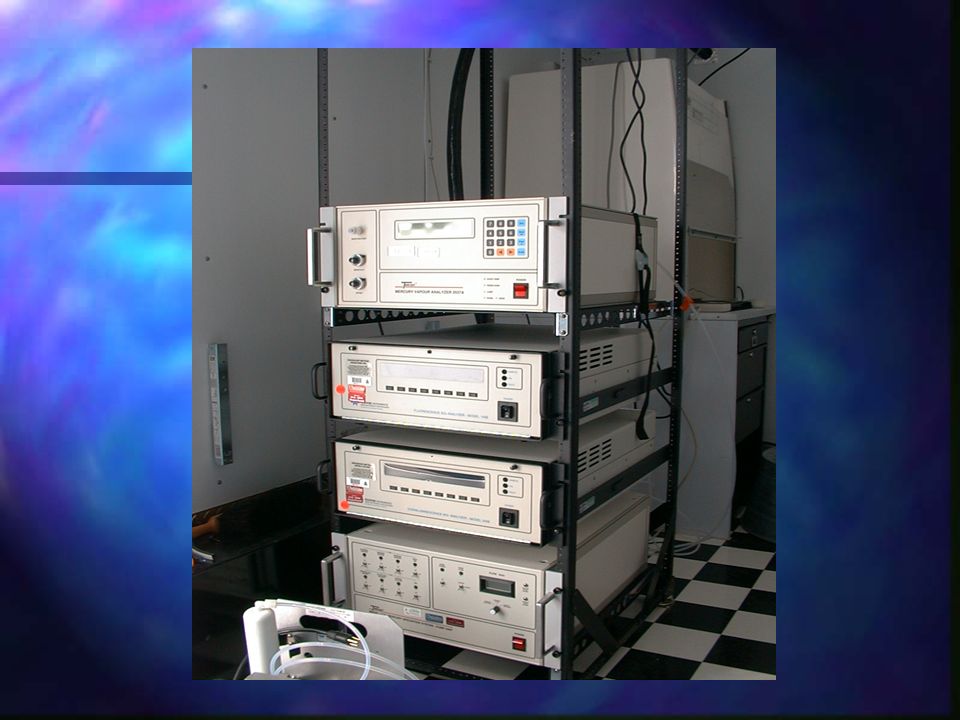
Atmospheric Mercury Vapor Monitoring Instrumentation Tekran Model 2537A Tekran Model 2537A Continuous Analysis of total gaseous Hg Continuous Analysis of total gaseous Hg Sub ng/m3 (ppt & ppq) levels measured Sub ng/m3 (ppt & ppq) levels measured Detection with Cold Vapor Atomic Fluorescence Spectrometry (CVAFS) Detection with Cold Vapor Atomic Fluorescence Spectrometry (CVAFS)
 levels measured Sub ng/m3 (ppt & ppq) levels measured Detection with Cold Vapor Atomic Fluorescence Spectrometry (CVAFS) Detection with Cold Vapor Atomic Fluorescence Spectrometry (CVAFS)")
6
Tekran 2537A Flow

7
Tekran 1130 & 1135 Units

8
Particulate Hg and Hg Speciation Components System Flow Diagram

9
Additional parameter monitoring Criteria air pollutants: NOx, SOx, Ozone, CO Criteria air pollutants: NOx, SOx, Ozone, CO Meteorological measurements: temperature, wind speed and direction, relative humidity, rainfall, solar radiation, barometric pressure, associated calculated values Meteorological measurements: temperature, wind speed and direction, relative humidity, rainfall, solar radiation, barometric pressure, associated calculated values All instruments run continuously, logging at five minute intervals – or time scale of interest. All instruments run continuously, logging at five minute intervals – or time scale of interest.

10
Monitoring elemental mercury at a remediation site First use of instrumentation in the Bay Area First use of instrumentation in the Bay Area Monitoring of elemental mercury adjacent to a remediation site in Richmond, CA Monitoring of elemental mercury adjacent to a remediation site in Richmond, CA

11
USEPA Region 9 Laboratory

12
EPA Met Tower

13
August 26 – 30, 2003

14
September 7 – 13, 2003

15
Monitoring in support of the Guadalupe Watershed TMDL Plan was to deploy monitoring trailer at four locations in the watershed – at least twice, once in the fall and once during the wet season. Plan was to deploy monitoring trailer at four locations in the watershed – at least twice, once in the fall and once during the wet season. Actually we collected data at two locations during September. Actually we collected data at two locations during September. If there is still interest we will deploy again in April at up to 4 locations. If there is still interest we will deploy again in April at up to 4 locations.

16
NASA Ames Calero Reservoir

17
NASA Ames, Sunnyvale, CA

18
Calero Reservoir, CA

19
Summary of Mercury Concentrations Mercury Concentrations – September 2005 NASA Ames MDN 8/30 – 9/9/05 NASA Ames MDN 8/30 – 9/9/05 Calero Reservoir 9/9 – 27/05 Calero Reservoir 9/9 – 27/05 MeanMedianMeanMedian Elemental Mercury (ng/m 3 ) 1.9091.7361.9401.780 Particulate Mercury (pg/m 3 ) 2.7321.8033.6652.811 Reactive Mercury (pg/m 3 ) 1.5280.8374.5281.448 n74 140
 Particulate Mercury (pg/m 3 ) Reactive Mercury (pg/m 3 ) n74 140")
20
Comparison to SFEI 2001 data SFEI study found Hg (0) ranged from 1.5 – 4.2 ng/m 3 SFEI study found Hg (0) ranged from 1.5 – 4.2 ng/m 3 SFEI did not measure Hg (p) or RGM, but used 95% Hg(0):3% Hg(p):2%RGM SFEI did not measure Hg (p) or RGM, but used 95% Hg(0):3% Hg(p):2%RGM Our limited data show similar Hg(0) ranges, 1.2 – 3.9 ng/m 3 Our limited data show similar Hg(0) ranges, 1.2 – 3.9 ng/m 3 The percent of Hg (p) and RGM were consistently ~ 1 % of Hg(0). The percent of Hg (p) and RGM were consistently ~ 1 % of Hg(0).
 and RGM were consistently ~ 1 % of Hg(0)..")
21
Next Steps Complete additional data analysis Complete additional data analysis Complete monitoring during other seasons (e.g. winter) Complete monitoring during other seasons (e.g. winter) Identify quality control for Hg(p) and RGM Identify quality control for Hg(p) and RGM Identify Additional Projects Identify Additional Projects
 Complete monitoring during other seasons (e.g. winter) Identify quality control for Hg(p) and RGM Identify quality control for Hg(p) and RGM Identify Additional Projects Identify Additional Projects.")
Similar presentations

 Sammy M. Ray URS Corporation Meeting.>")


 Xu, Xiaobin Wang University of Windsor, Windsor, Ontario Canada.>")

 Xu, Umme Akhtar, Kyle Clark,>")


 deposition is a growing global concern, even in pristine regions far from point sources. Once deposited, it can be.>")


