Download presentation
Presentation is loading. Please wait.

1
Business Finance BA303 Michael Dimond

2
Michael Dimond School of Business Administration Module G: Financial Statement Analysis

3
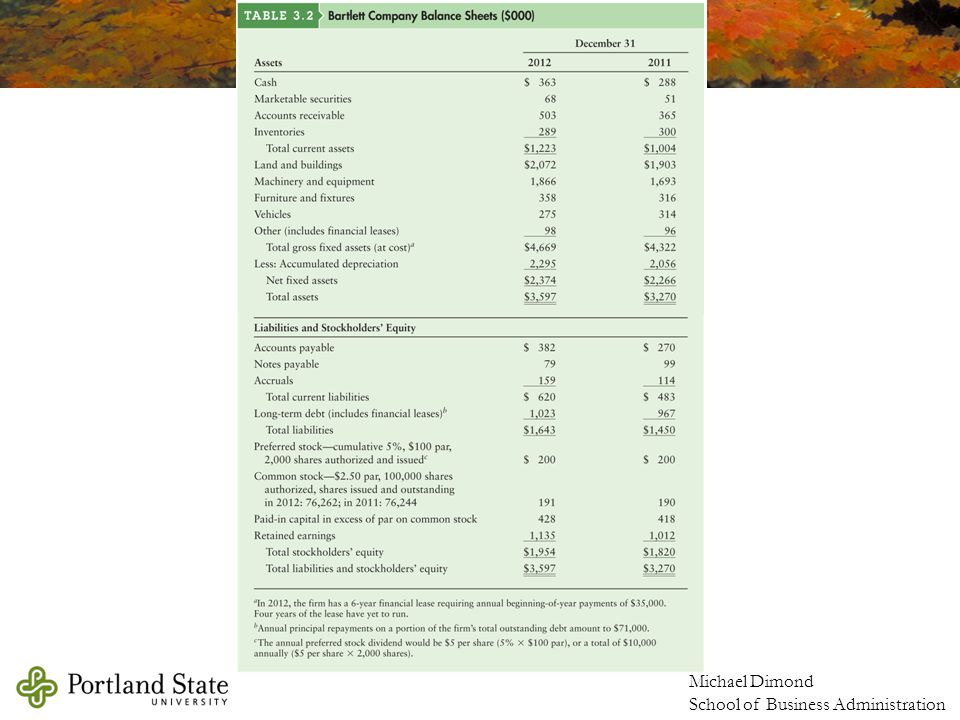
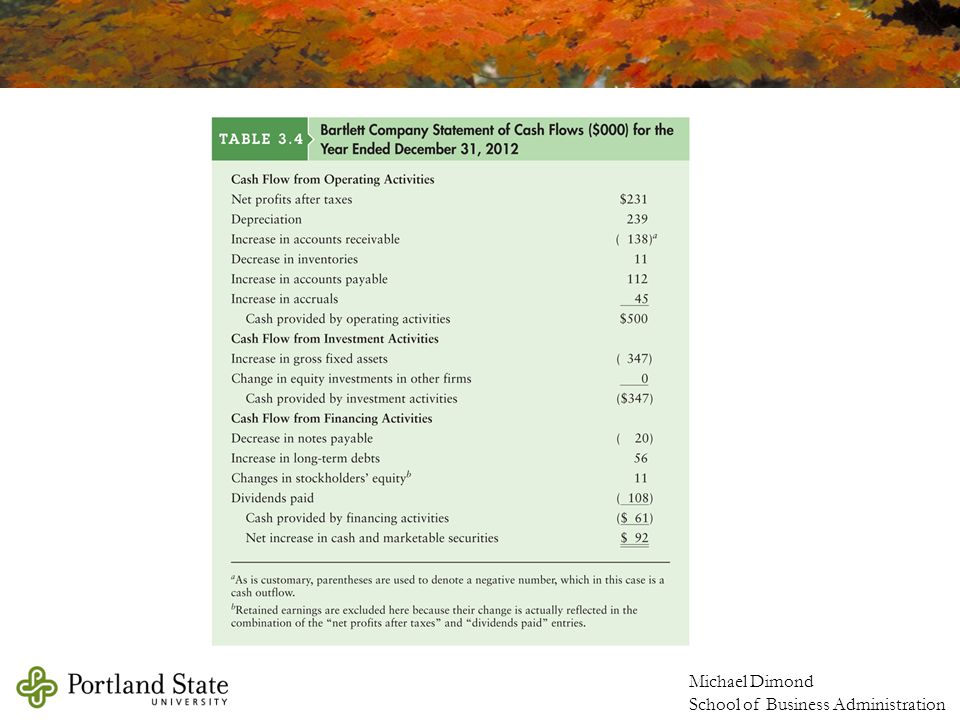
Michael Dimond School of Business Administration Understanding financial statements Balance Sheet Income Statement Statement of Cash Flows Statement of Shareholders’ Equity

4
Michael Dimond School of Business Administration

7
Meaningful Ratio Analysis Analysis means to break something down to understand it. Ratio analysis should be used to answer a specific question or set of questions. If you were examining the financial statements for a company, you might start with this basic question: “Is this a good use of investors’ money?” What financial ratio would answer this question? How about Return on Equity? How do you compute Return on Equity (ROE)?
 .")
8
Michael Dimond School of Business Administration Analyzing ROE ROE = NI ÷ Equity and answers the question, “is this a good use of investors’ money?” If you were to break this down, there are three basic questions to answer: How profitable is this business? How efficiently are assets being used? How much does financial leverage help the investors? What financial ratios would answer these questions? Profit Margin (PM) Total Asset Turnover (TAT) Equity Multiplier (EM)
 Total Asset Turnover (TAT) Equity Multiplier (EM).")
9
Michael Dimond School of Business Administration Drivers of ROE Profit Margin (PM) = NI ÷ Sales and answers the question, “How profitable is this business?” Total Asset Turnover (TAT) = Sales ÷ Total Assets and answers the question, “How efficiently are assets being used?” Equity Multiplier (EM) = Total Assets ÷ Equity and answers the question, “How much does financial leverage help the investors?”
 = NI ÷ Sales and answers the question, How profitable is this business Total Asset Turnover (TAT) = Sales ÷ Total Assets and answers the question, How efficiently are assets being used Equity Multiplier (EM) = Total Assets ÷ Equity and answers the question, How much does financial leverage help the investors")
10
Michael Dimond School of Business Administration The DuPont Identity ROE is directly driven by profitability, efficiency and leverage. ROE = PM x TAT x EM How does that work? The numerators and denominators cancel to reduce the equation to NI ÷ Equity

11
Michael Dimond School of Business Administration A note about the text’s version of ROE & DuPont The author uses Earnings Available to Common Shareholders for ROE computations. While this is not terribly incorrect, it isn’t really correct either. Net Income ÷ Equity = ROE Earnings Available to Common Shareholders ÷ (Equity – Preferred Equity) = Return on Common Equity (ROCE, not ROE) The purpose of analysis is to answer important questions. If the question is how hard the investors’ money is working, compute ROE To find how hard common shareholders’ money is working, compute ROCE Never mix & match. ROCE uses Earnings Available to Common Shareholders and Common Equity. ROE uses Net Income and Total Equity. Notice the author computes ROA as Earnings Available to Common Shareholders ÷ Total Assets. What is wrong with this? ROE & ROA are sometimes very manipulated figures, used by managers to prove a point. Always compute your own figures for analysis.
 = Return on Common Equity (ROCE, not ROE) The purpose of analysis is to answer important questions. If the question is how hard the investors’ money is working, compute ROE To find how hard common shareholders’ money is working, compute ROCE Never mix & match. ROCE uses Earnings Available to Common Shareholders and Common Equity. ROE uses Net Income and Total Equity. Notice the author computes ROA as Earnings Available to Common Shareholders ÷ Total Assets. What is wrong with this. ROE & ROA are sometimes very manipulated figures, used by managers to prove a point. Always compute your own figures for analysis..")
12
Michael Dimond School of Business Administration A word about ROA ROA = Return on Assets What’s the difference between Equity & Assets? Leverage What’s the difference between ROE & ROA? Leverage ROE = PM x TAT x EM EM represents leverage ROA = PM x TAT No leverage

13
Michael Dimond School of Business Administration Digging Deeper with Financial Ratios How would you analyze profitability, efficiency and leverage? How do profitability, efficiency and leverage relate? What affects profitability? What drives sales? What is the composition of assets? How were assets paid for? How are liabilities managed? Where shall we begin?

14
Michael Dimond School of Business Administration Common-Size Financial Statements Shows each line item as a percent of an appropriate total. Common-size balance sheet % of Total Assets Shows the composition of assets Liabilities & equity items are also shown as % of total assets Debt Ratio = Total Liabilities ÷ Total Assets Common-size income statement % of Sales PM = Net Income as % of Sales

15
Michael Dimond School of Business Administration Common-Size Income Statement 100% 5.38%7.19%

16
Michael Dimond School of Business Administration Common-Size Balance Sheet 100% 44.34%45.68%

17
Michael Dimond School of Business Administration We don’t make a common-size CF Statement There are other ways to examine relevant information which would be more helpful

18
Michael Dimond School of Business Administration Vertical & Horizontal Analysis Vertical Analysis compares figures as a percent of a relevant total (“common size” financial statements) Horizontal Analysis compares the same figure over a series of periods (showing % change or % growth)
 Horizontal Analysis compares the same figure over a series of periods (showing % change or % growth)")
19
Michael Dimond School of Business Administration Measuring growth Financial figures change from year to year To find the % change (“% growth”) over a 1-year period, divide the difference of the two figures by the first year’s value: [ending – beginning] / [beginning] OR [ending] / [beginning] - 1 Measuring growth over more than one period means we need to find the average growth during that time.
![Michael Dimond School of Business Administration Measuring growth Financial figures change from year to year To find the % change ( % growth ) over a 1-year period, divide the difference of the two figures by the first year’s value: [ending – beginning] / [beginning] OR [ending] / [beginning] - 1 Measuring growth over more than one period means we need to find the average growth during that time.](http://images.slideplayer.com/15/4559112/slides/slide_19.jpg "Michael Dimond School of Business Administration Measuring growth Financial figures change from year to year To find the % change ( % growth ) over a 1-year period, divide the difference of the two figures by the first year’s value: [ending – beginning] / [beginning] OR [ending] / [beginning] - 1 Measuring growth over more than one period means we need to find the average growth during that time.")
20
Michael Dimond School of Business Administration CAGR: Compound Annual Growth Rate The CAGR is the result of compounded increase over time at a specific average rate (133.1/100)^(1/3)-1=0.10 It can be tested by plugging the result into a compounding formula using the same figures 100*(1+0.10)^3=133.10 It can be figured using the TVM functions on your calculator PV = -100 FV = 133.10 n = 3 PMT = 0 solve for I = 10% What if you were given a series of % changes instead of dollar figures? Year 1: 10% increase, Year 2: 12% increase, Year 3: 8% increase You need to find the Geometric Average Growth over the three year period

21
Michael Dimond School of Business Administration Geometric Average vs Arithmetic Average Arithmetic Average only shows the “typical” result Geo Avg = [(1+20%)*(1+-16.67%)* (1+20%)*(1+16.67%)]^(1/4) -1 = 8.78% CAGR also shows the result of compounding (14/10)^(1/4) – 1 = 0.878 = 8.78% The price didn’t increase 8.78% each year, but we end up with the same final value if we compound it by 8.78% every year. 5 years means 4 periods of compounding, so we find the 4 th root ( ^1/4 power)
![Michael Dimond School of Business Administration Geometric Average vs Arithmetic Average Arithmetic Average only shows the typical result Geo Avg = [(1+20%)*( %)* (1+20%)*( %)]^(1/4) -1 = 8.78% CAGR also shows the result of compounding (14/10)^(1/4) – 1 = = 8.78% The price didn’t increase 8.78% each year, but we end up with the same final value if we compound it by 8.78% every year.](http://images.slideplayer.com/15/4559112/slides/slide_21.jpg "5 years means 4 periods of compounding, so we find the 4 th root ( ^1/4 power).")
22
Michael Dimond School of Business Administration Categories of Financial Ratios Most finance texts group ratios into categories like these: Profitability ratios Efficiency (or Activity) ratios Liquidity ratios Debt ratios Market ratios It is usually more helpful to think of the questions to be answered rather than just crunching a bunch of numbers. Uses critical thinking Easier to read Less time consuming Uses fewer resources

23
Michael Dimond School of Business Administration Profitability Ratios PM = Net Income ÷ Sales (Sometimes called “Net Profit Margin”). This also is the bottom line on a common-size income statement The author makes a distinction for Earnings Available to Common Shareholders. Gross Margin = Gross Profit ÷ Sales Gross Profit = Sales – COGS Also called the “Gross Profit Margin” Operating Margin = Operating Profit ÷ Sales Also called the “Operating Profit Margin”

24
Michael Dimond School of Business Administration Efficiency Ratios TAT = Sales ÷ Total Assets How hard do specific assets work? Inventory Turnover Inventory Turnover = Sales ÷ Inventory The label “Inventory Turnover” is also used for COGS ÷ Avg. Inventory These two ratios answer different questions: How hard is inventory working? (Sales/Inventory) How many times/year is inventory replaced? (COGS/Average Inventory) How would you convert this into “Days in Inventory?” Average Collection Period or AR Conversion Period Days to Collect AR = Avg. Accts Receivable ÷ Avg. Daily Sales Average Daily Sales = Sales ÷ 365 The sales figure should exclude sales paid for in cash, use only sales creating AR
 How many times/year is inventory replaced. (COGS/Average Inventory) How would you convert this into Days in Inventory Average Collection Period or AR Conversion Period Days to Collect AR = Avg. Accts Receivable ÷ Avg. Daily Sales Average Daily Sales = Sales ÷ 365 The sales figure should exclude sales paid for in cash, use only sales creating AR.")
25
Michael Dimond School of Business Administration Efficiency Ratios Average Payment Period Days to Pay AP = Avg. AP ÷ Avg Daily Purchases Avg Daily Purchases = Purchases ÷ 365 Purchases = COGS + Ending Inventory – Beginning Inventory If you know how long it takes a company to sell inventory, how long it takes to collect accounts receivable and how long to pay its bills, you can compute how long their business takes to function Operating Cycle: Days in Inventory + Days in Receivables Cash Cycle: Days in Inventory + Days in Receivables – Days in Payables

26
Michael Dimond School of Business Administration Efficiency Ratios There is an easy and consistent way to compute and understand the components of the cash cycle. Each of the “Days in…” figures represents a year divided by the appropriate turnover rate: Days in Inventory = 365 ÷ Inventory Turnover Rate Days in Receivables = 365 ÷ Receivables Turnover Rate Days in Payables = 365 ÷ Payables Turnover Rate This means the turnover rates can be simplified to these: Inventory Turnover Rate = COGS ÷ Avg. Inventory Receivables Turnover Rate = Sales ÷ Avg. Receivables Payables Turnover Rate = Purchases ÷ Avg. Payables …and the days in each can be computed as: Days in Inventory = 365 ÷ (COGS ÷ Avg. Inventory) Days in Receivables = 365 ÷ (Sales ÷ Avg. Receivables) Days in Payables = 365 ÷ (Purchases ÷ Avg. Payables)
 Days in Receivables = 365 ÷ (Sales ÷ Avg. Receivables) Days in Payables = 365 ÷ (Purchases ÷ Avg. Payables).")
27
Michael Dimond School of Business Administration Liquidity Ratios The Current Ratio Pretty much useless in my opinion, but memorize it anyway. Current Assets ÷ Current Liabilities Liquidity means something can be converted into cash immediately without significant loss of value. Current Assets includes inventory. Is inventory really liquid? Quick Ratio (also called the “Acid Test”) Answers the question, “how well can this firm meet its short-term obligations?” [Current Assets – Inventory] ÷ Current Liabilities
 Answers the question, how well can this firm meet its short-term obligations [Current Assets – Inventory] ÷ Current Liabilities.")
28
Michael Dimond School of Business Administration Debt Management Ratios Debt ratio = Total Liabilities ÷ Total Assets Also called “Debt to Total Capital” ratio Debt-to-Equity ratio = Total Liabilities ÷ Total Equity EM (from DuPont) = 1 + D/E Times Interest Earned ratio = EBIT ÷ Interest NOTE: The book has a typo on page 78. It claims TIE = EBIT ÷ Tax, which is not correct. TIE can be altered to cover any financial obligations. TIE = EBIT ÷ Interest :. TIE = (EBT + Interest) ÷ Interest (EBT + Interest + Lease Pmts) ÷ (Interest + Lease Pmts) = Fixed Payment Coverage (EBT + Interest + Lease Pmts) ÷ (Interest + Lease Pmts + Principal Repayments/(1-t)) = Fixed Payment Coverage
 ÷ Interest (EBT + Interest + Lease Pmts) ÷ (Interest + Lease Pmts) = Fixed Payment Coverage (EBT + Interest + Lease Pmts) ÷ (Interest + Lease Pmts + Principal Repayments/(1-t)) = Fixed Payment Coverage.")
29
Michael Dimond School of Business Administration Market Value Ratios Price-to-Earnings ratio = Share Price ÷ Earnings per Share Earnings per Share (EPS) = Earnings Available to Common Shareholders ÷ Number of Shares of Common Stock If there is no preferred equity (or an insignificant amount), EPS can be NI ÷ Number of Shares Because the Numerator and Denominator are both “per share,” the PE ratio can be computed as Market Capitalization ÷ Total Earnings Available Market-to-Book ratio = Price per Share ÷ Book Value per Share Book Value per Share = Common Equity on Balance Sheet ÷ Number of Shares Common Equity = All equity except preferred equity Again, because the Numerator and Denominator are both “per share,” the MB ratio can be computed as Market Capitalization ÷ Total Common Equity
 = Earnings Available to Common Shareholders ÷ Number of Shares of Common Stock If there is no preferred equity (or an insignificant amount), EPS can be NI ÷ Number of Shares Because the Numerator and Denominator are both per share, the PE ratio can be computed as Market Capitalization ÷ Total Earnings Available Market-to-Book ratio = Price per Share ÷ Book Value per Share Book Value per Share = Common Equity on Balance Sheet ÷ Number of Shares Common Equity = All equity except preferred equity Again, because the Numerator and Denominator are both per share, the MB ratio can be computed as Market Capitalization ÷ Total Common Equity")
30
Michael Dimond School of Business Administration Other useful analysis Dividends & Retained Earnings d: Dividend Payout Ratio = Dividends ÷ Net Income b: Retention Ratio = 1 – d Also called the “plowback ratio.” Why do you think that name is used? Growth Limitations SGR: Sustainable Growth Rate = b x ROE = b x PM x TAT x EM IGR: Internal Growth Rate = b x ROA = b x PM x TAT Breakeven BE = Total Fixed Costs ÷ Contribution Margin Contribution Margin = Price per unit – Variable Costs per unit Operating, Accounting, and Financial breakevens all exist. The definition of “Fixed Costs” changes. Degree of Operating Leverage Looks a lot like an elasticity formula: %Δ Op. Income ÷ %Δ Sales As firm approaches breakeven, DOL gets larger A point estimate of DOL can be computed as Gross Profit ÷ Operating Income

Similar presentations

>")


