Download presentation
Presentation is loading. Please wait.

1
STAT 1301 Confidence Intervals for Averages

2
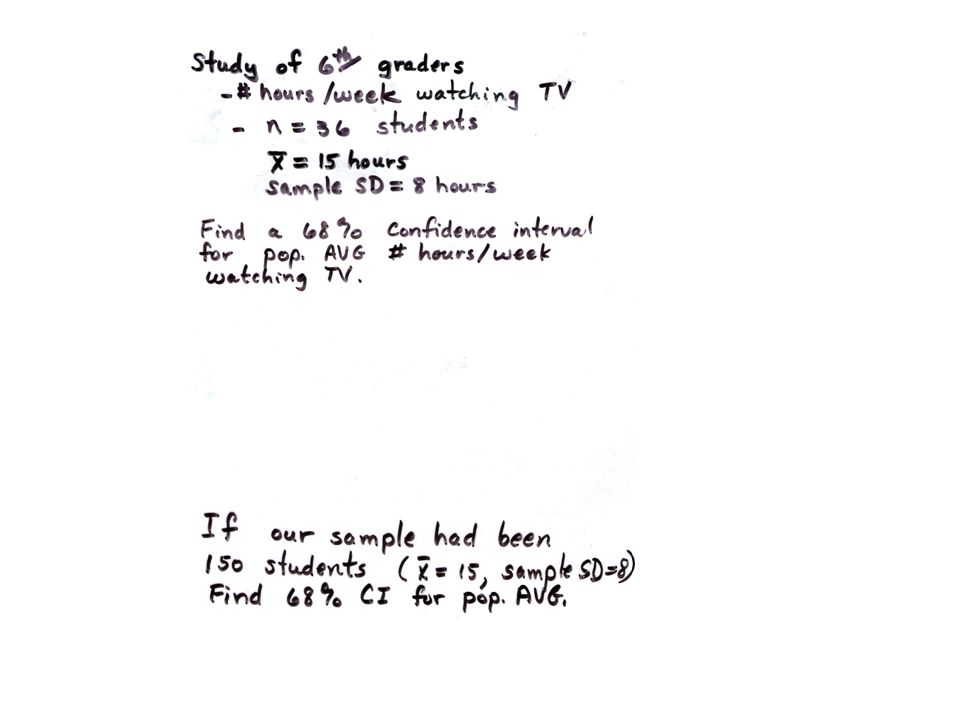
l we usually DON’T KNOW the population AVG l we take simple random sample of size n l find sample AVG - this is our “best guess” at pop. AVG - “sample statistic” QUESTION: How far is pop. AVG likely to be from sample AVG ? Realistic Situation

3
Huge population, can’t get exact average Take SRS of 100 stations. Results of sample: AVG(sample) = $2.15 SD(sample) = $0.08 So, we estimate the average price for all stations in Texas to be about $2.15. How close is this likely to be to the true Texas average ? Example: Consumer reporter wants to know average price of unleaded gasoline in Texas on a certain day.
 = $2.15 SD(sample) = $0.08 So, we estimate the average price for all stations in Texas to be about $2.15. How close is this likely to be to the true Texas average . Example: Consumer reporter wants to know average price of unleaded gasoline in Texas on a certain day..")
4
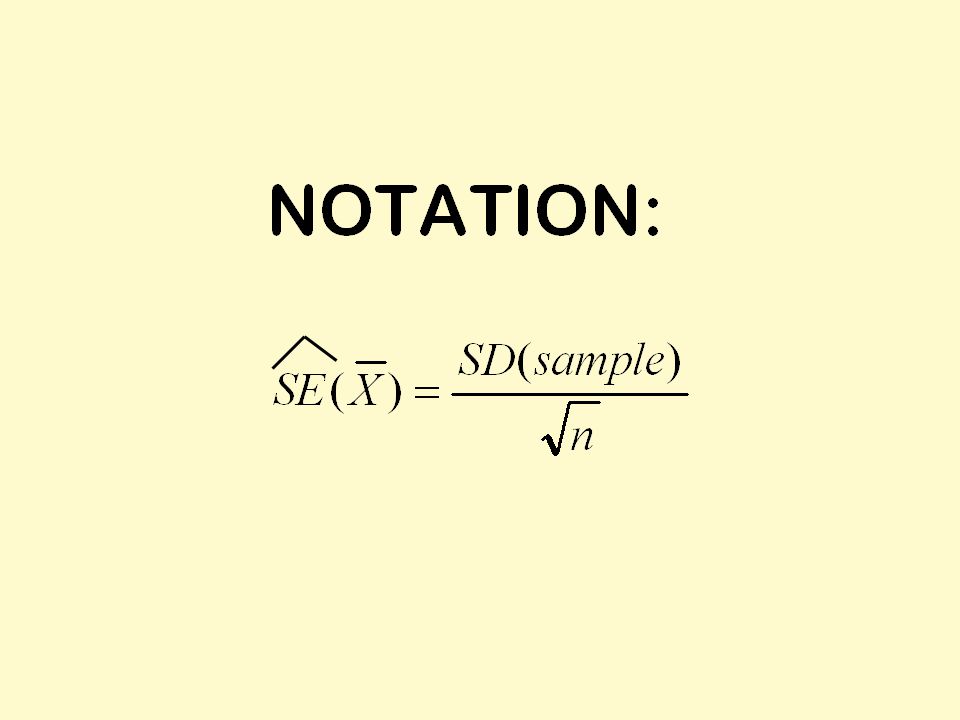
SE(X) measures this l What’s the problem here? –SE(X) depends on population SD –we don’t know population SD l How could you approximate the population SD? –use sample SD
 depends on population SD –we don’t know population SD l How could you approximate the population SD. –use sample SD.")
5
10 draws with replacement 1, 4, 6, 0, 6, 6, 4, 6, 1, 6 ?????

7
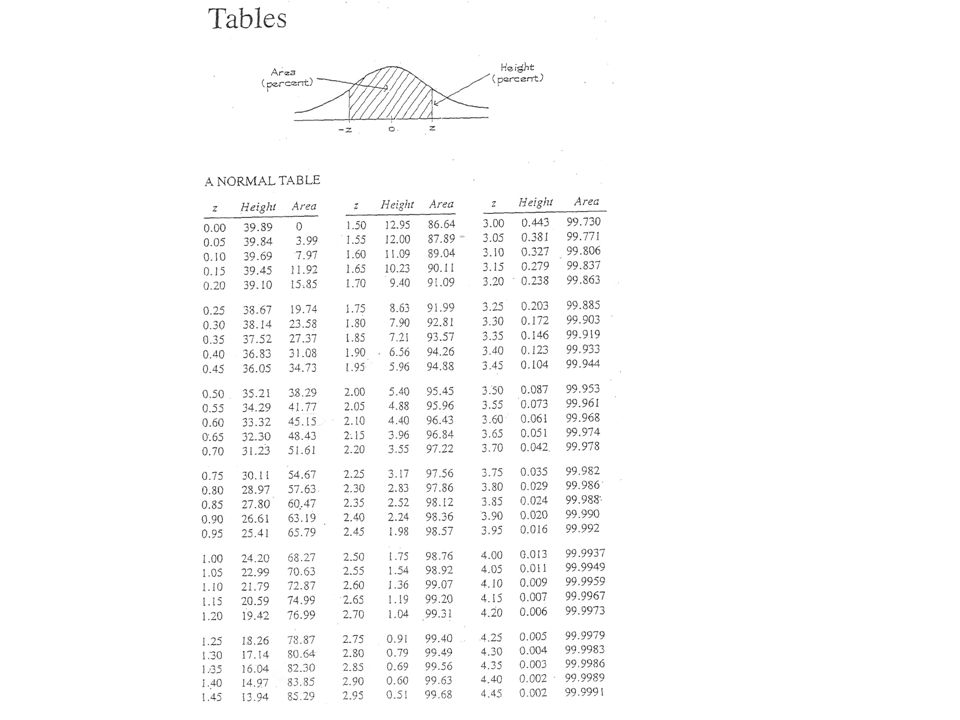
l Recall -- If population AVG is known, then the chance that a sample AVG will fall within 2 SE’s of the population AVG is about 95% l Turned Around -- If we know the sample AVG, then the population AVG should be within 2 SE’s of this sample AVG about 95% of the time (use “approximate SE”) 95% Confidence Interval for Population AVG X 2 SE(X) Confidence Intervals
 95% Confidence Interval for Population AVG X 2 SE(X) Confidence Intervals")
8
Consumer reporter – wants to estimate the average price of regular unleaded gasoline in Texas on a certain day. Sample: 100 stations --- AVG = $2.15 --- SD =$0.08 Find a 95% confidence interval for the average for all stations in Texas on that day. Find the corresponding 99.7% CI.

9
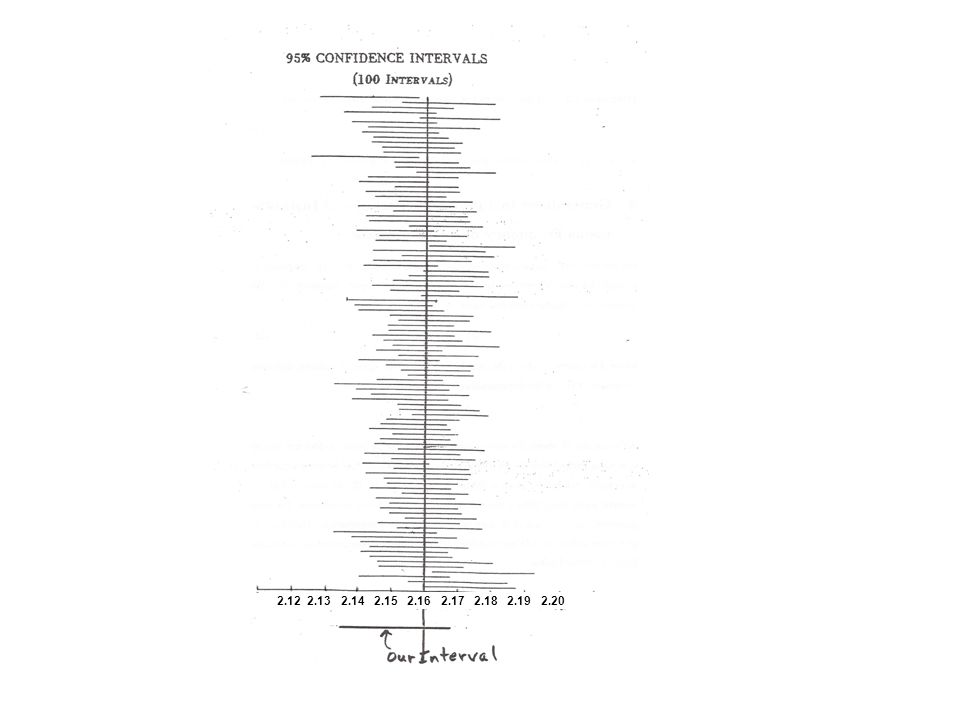
2.12 2.13 2.14 2.15 2.16 2.17 2.18 2.19 2.20
10
Suppose 100 consumer reporters - each took own sample - each computed a 95% CI IF IF (for example) the true AVG price is $1.86 - we could expect about 95 of these 100 CI’s to contain $ 1.86 Interpetation of 95% Confidence Interval
 the true AVG price is $ we could expect about 95 of these 100 CI’s to contain $ 1.86 Interpetation of 95% Confidence Interval")
11
Note: l For a given sample size n, –if you want higher confidence level, this requires a longer interval

12
General Confidence Intervals X z x SE(X) where z = 1 for 68% CI z = 2 for 95% CI z = 3 for 99.7% CI
 where z = 1 for 68% CI z = 2 for 95% CI z = 3 for 99.7% CI")
Similar presentations


 is known 3.Either.>")
 Find a likely range of values for a population parameter.>")


