Download presentation
Presentation is loading. Please wait.

1
An overview of HydroSHEDS HydroSHEDS World Wildlife Fund US in partnership with USGS, CIAT, TNC, CESR

2
Some typical freshwater conservation planning questions QHow can I delineate watersheds (catchments) as planning units? QHow can I develop a freshwater habitat classification for use in a representation analysis, especially for a data-poor area? QHow can I integrate hydrologic characteristics into a freshwater habitat classification? QHow can I analyze threats originating upstream from a system of interest (e.g. river reach, lake, wetland)? AStart with a digital river network
. AStart with a digital river network.")
3
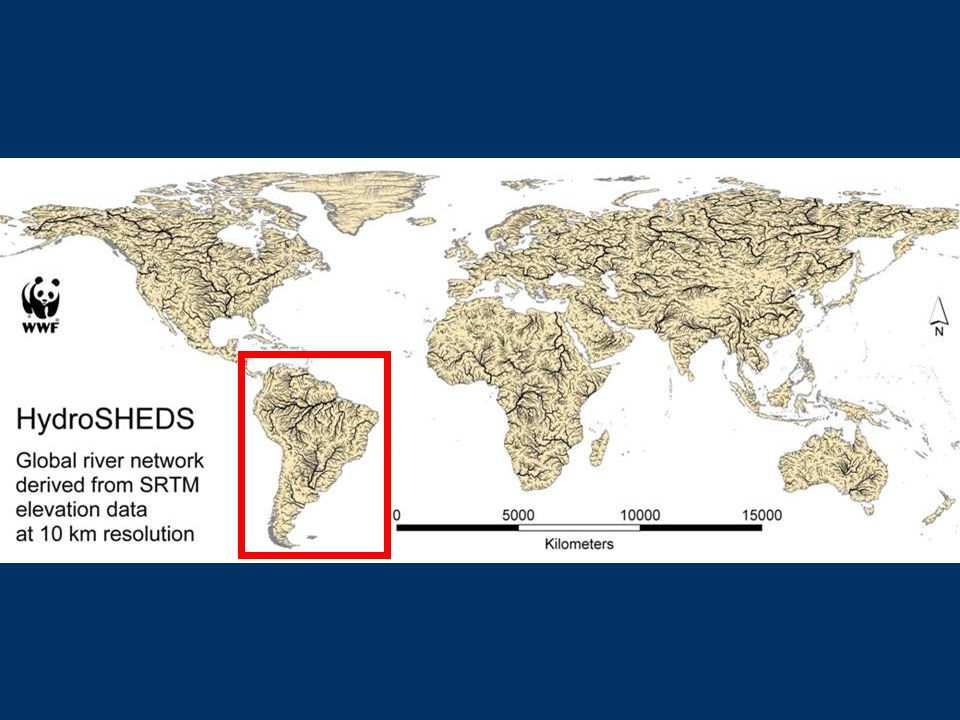
HydroSHEDS Hydrological data and maps based on Shuttle Elevation Derivatives at multiple Scales Project goal: Derive large-scale digital river network and basin maps as key input layers for watershed analyses and hydrological applications Existing products like the global Hydro1k data set (at 1 km resolution) or regional maps are either limited in their quality or not seamless SRTM provides for the first time a relatively high resolution DEM at near-global extent, from which hydrological products can be derived
 or regional maps are either limited in their quality or not seamless SRTM provides for the first time a relatively high resolution DEM at near-global extent, from which hydrological products can be derived")
4
Traditionally, watershed delineation has been done manually using contours on a topographic map A watershed boundary can be sketched by starting at the outlet point and following the height of land defining the drainage divides using the contours on a map. Outlet Point Watershed Delineation

5
Main processing steps SRTM data preparation Void filling Sink identification Hydrologic conditioning Upscaling

6
Quality comparisons Local high resolution river mapHydro1k (1 km)ESRI 1:3 Mio.DCW 1:1 Mio.HydroSHEDS 500 m 50 km
ESRI 1:3 Mio.DCW 1:1 Mio.HydroSHEDS 500 m 50 km")
7
HydroSHEDS 500 m HydroSHEDS 90 m Quality comparisons

8
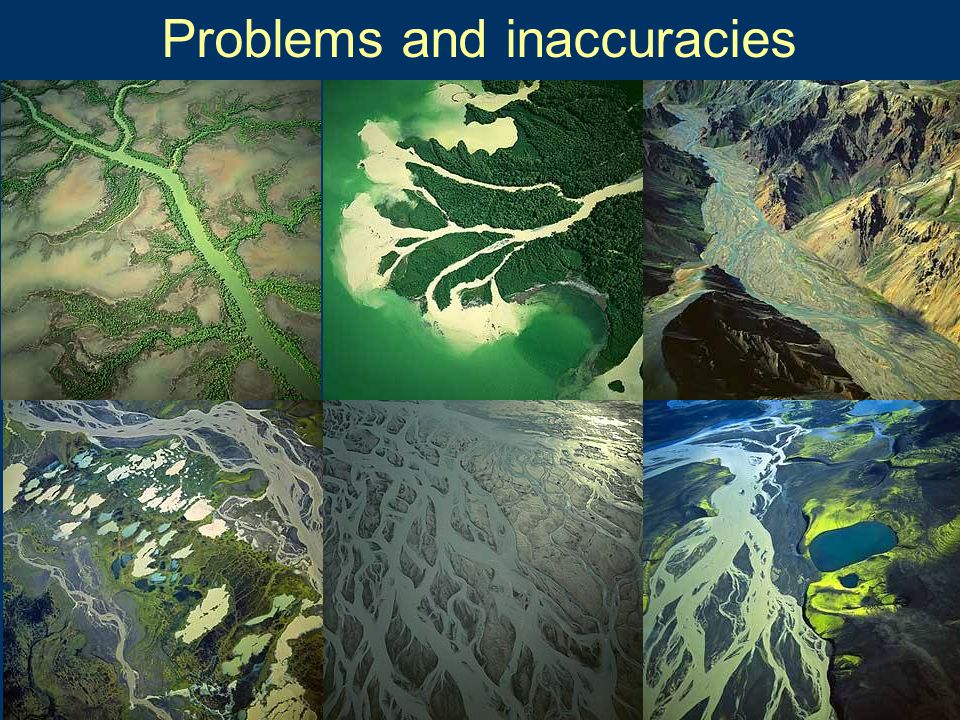
Vegetation (particularly in flat areas like large river floodplains) Smaller rivers with high riparian vegetation Roads in lowland vegetation (e.g. Amazon basin) Flat areas Braided rivers and deltas (more than one flow channel) Inland sinks Coastal areas (mangroves) Problems and inaccuracies
 Flat areas Braided rivers and deltas (more than one flow channel) Inland sinks Coastal areas (mangroves) Problems and inaccuracies.")
16
Examples of applications

17
Stream maps

18
Hydrological modeling (requires flow model)
")
19
Runoff generation maps (ditto)
")
20
Planning example: SW Amazon

21
Inputs to freshwater habitat classification

22
Sub-basin classification Larger stream classification

23
Floodplain classification (eCognition TM )
")
24
Gap analysis base layer

25
Gap analysis (20% goal) Subbasin habitat type Percent existing protected area High-elevation grass- and shrubland 0 High-elevation montane forest 47 Lowland dry tropical forest 18 Lowland wet tropical forest 53 Mid-elevation bamboo forest 80 Mid-elevation montane forest 70 Mid-elevation tropical forest 36 Pass-through basin 14 Stream habitat type Percent existing protected area High-elevation stream (Andean influence) 10 Lowland river (Andean influence) 9 Lowland river (no Andean influence) 0 Lowland stream (Andean influence) 57 Lowland stream (no Andean influence) 9 Mainstem Madre de Dios 1 Mid-elevation stream (Andean influence) 58 Mid-elevation stream (no Andean influence) 31 Shaded types fail to meet 20% goal with existing PAs Floodplain habitat type Percent existing protected area Mainstem floodplain20 Manuripi floodplain55 Braided floodplain24 Palm swamp on terraces 0 Palm swamp - riverine 48 Pampas20
 Subbasin habitat type Percent existing protected area High-elevation grass- and shrubland 0 High-elevation montane forest 47 Lowland dry tropical forest 18 Lowland wet tropical forest 53 Mid-elevation bamboo forest 80 Mid-elevation montane forest 70 Mid-elevation tropical forest 36 Pass-through basin 14 Stream habitat type Percent existing protected area High-elevation stream (Andean influence) 10 Lowland river (Andean influence) 9 Lowland river (no Andean influence) 0 Lowland stream (Andean influence) 57 Lowland stream (no Andean influence) 9 Mainstem Madre de Dios 1 Mid-elevation stream (Andean influence) 58 Mid-elevation stream (no Andean influence) 31 Shaded types fail to meet 20% goal with existing PAs Floodplain habitat type Percent existing protected area Mainstem floodplain20 Manuripi floodplain55 Braided floodplain24 Palm swamp on terraces 0 Palm swamp - riverine 48 Pampas20")
26
Threats (‘cost layer’)
")
27
FW representation & connectivity areas

28
HydroSHEDS Products

29
HydroSHEDS Provided resolutions 90 m (in 5-deg tiles) 500 m (continental) 1 km (global) Timeline: Latin America & Asia: available rest of world: end of 2007 Free distribution online via USGS EROS Data Center http://hydrosheds.cr.usgs.gov/
 500 m (continental) 1 km (global) Timeline: Latin America & Asia: available rest of world: end of 2007 Free distribution online via USGS EROS Data Center")
30
ArcView tools available mid-2007 scalable watershed boundaries scalable watershed boundaries flow accumulation flow accumulation upstream catchment delineation upstream catchment delineation sinuosity sinuosity flow distances flow distances distance to outlet/headwater distance to outlet/headwater planned: slopes along rivers planned: slopes along rivers planned: transport modeling planned: transport modeling planned: river topology & stream coding planned: river topology & stream coding

31
Future: Hydrologic information system

32
For more information please contact Robin Abell robin.abell@wwfus.org (also available at SCB meeting) You can find more information about HydroSHEDS at http://www.worldwildlife.org/hydrosheds
 You can find more information about HydroSHEDS at")
33
Thank you to all providers and distributors of data (SRTM), tools, ideas, and support to JohnsonDiversey, Inc. for major funding to Bob Pressey for the invitation to present and to Simon Linke for presenting in my absence.

Similar presentations