Download presentation
Presentation is loading. Please wait.

1
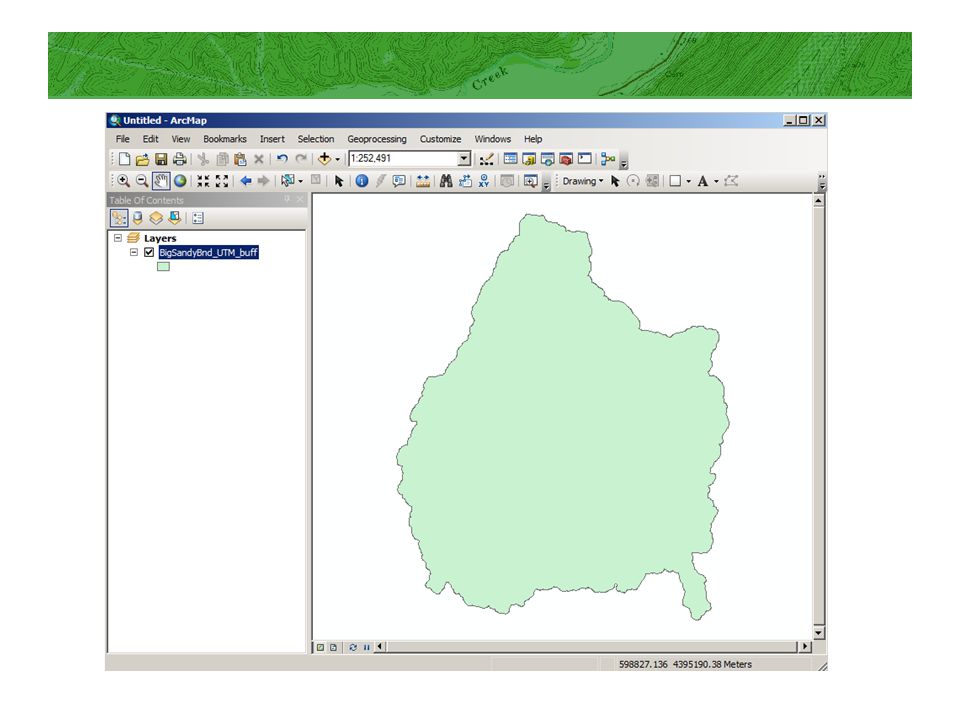
RunoffRunoff Creating a spatially explicit runoff grid

2
Goal Create a grid based surface in which each cell represents runoff transport Used for estimating streamflow Loadings and concentrations of water quality Driving factor in equations

3
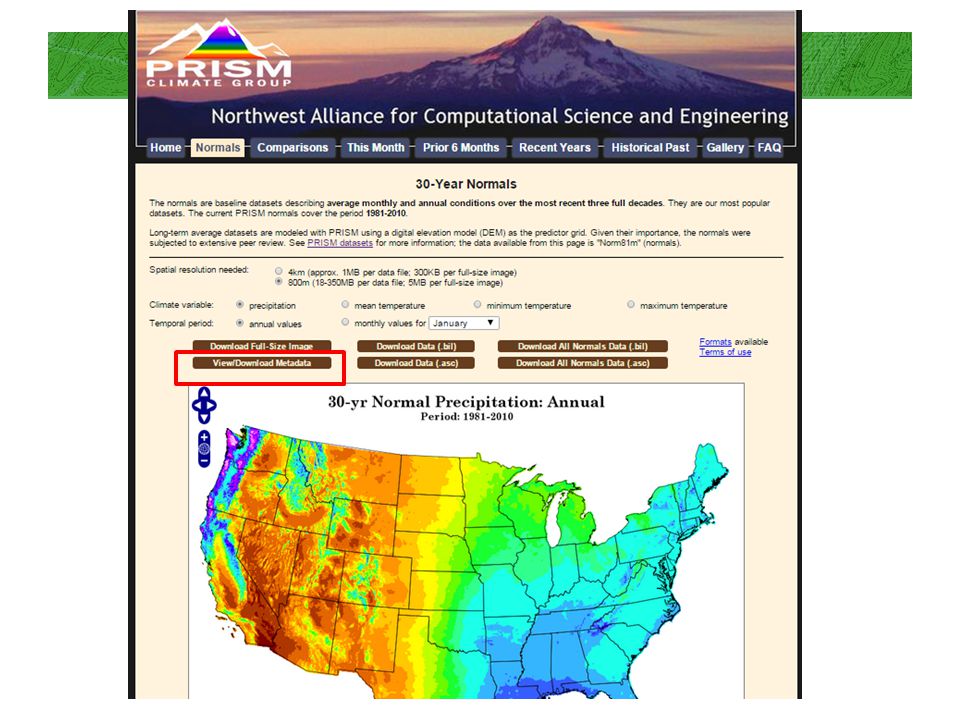
http://www.prism.oregonstate.edu/

6
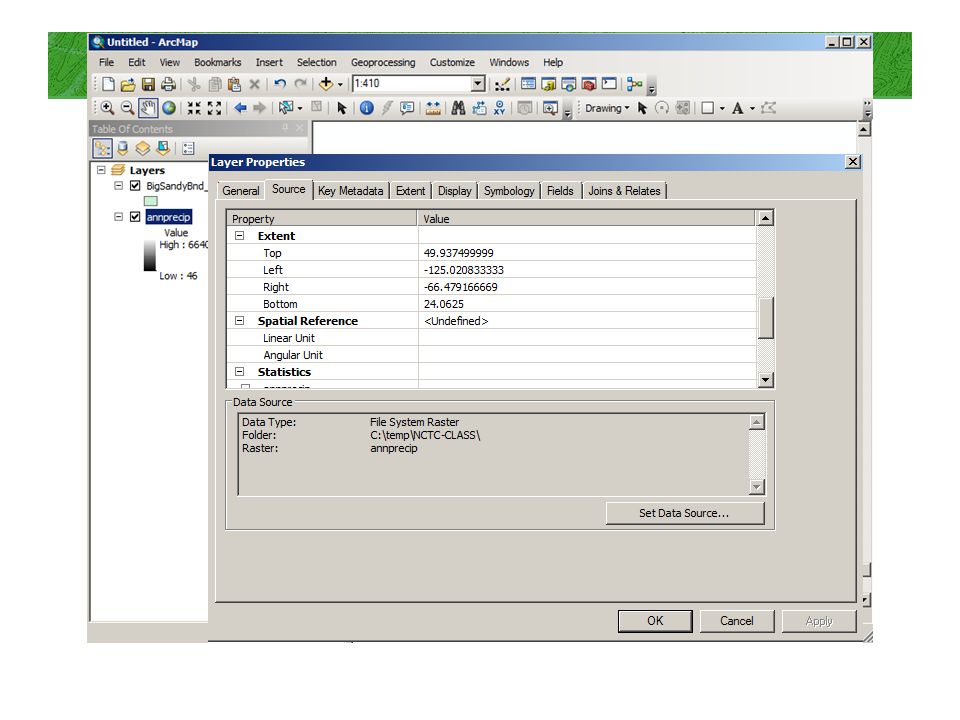
ASCII to Raster

11
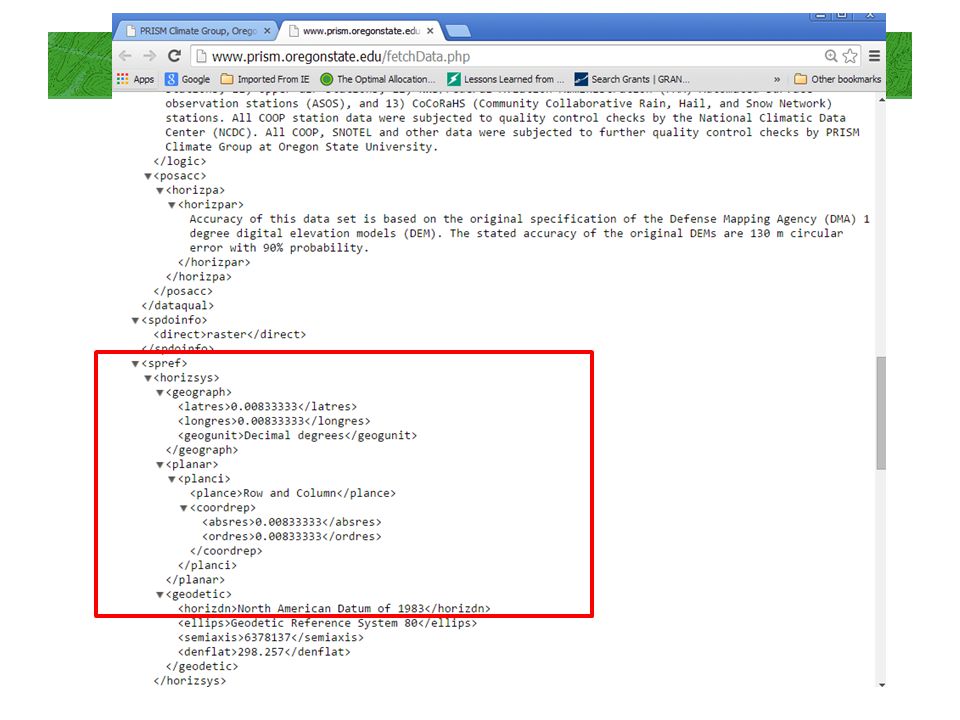
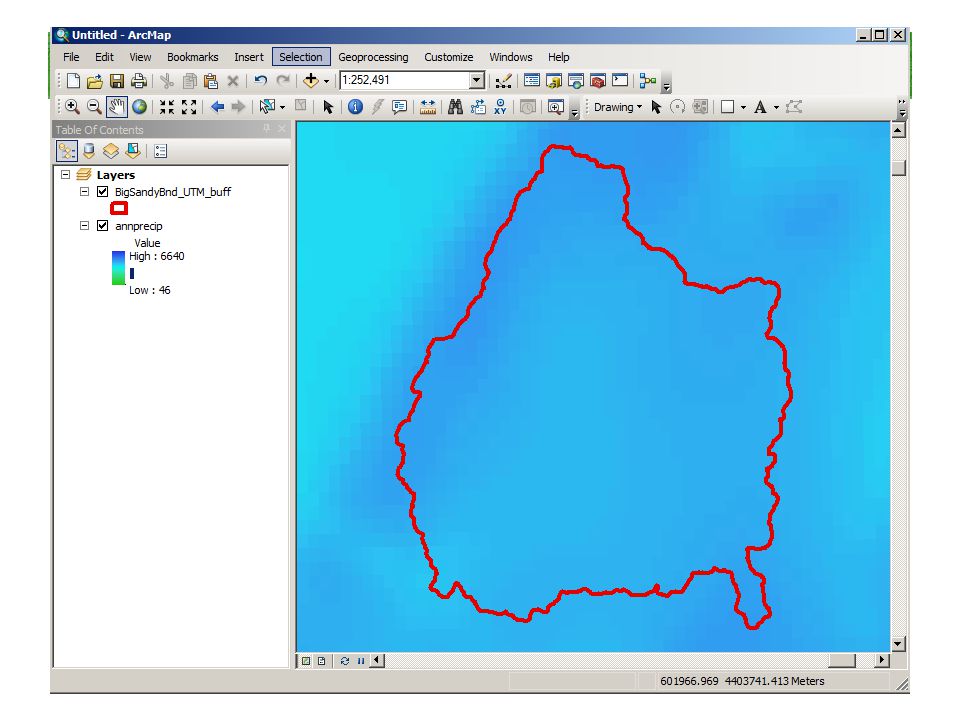
Defining a projection for the precip grid

18
Regression relationship For 5 gauging stations located within the Cheat and Tygart Drainage Basins (vicinity of study area) I found 30yr average annual precip and 30yr annual depth of stream flow - both values were in mm. Best fit was: Depth of streamflow in mm = (.655474) * annual precip total in mm
 * annual precip total in mm.")
19
Runoff grid

20
Now for cumulative annual runoff Part APart B

21
Cumulative runoff

22
Streamflow from cumulative runoff We multiply cu_runoff2 (which is in m 3 per year) by the number of cubic feet per cubic meter (35.2875) and divide by the number of seconds per year (31557600). For result called est_flow will have the 30yr annual average flow in cfs.

23
Estimated flow

24
Flow for stream cells only

25
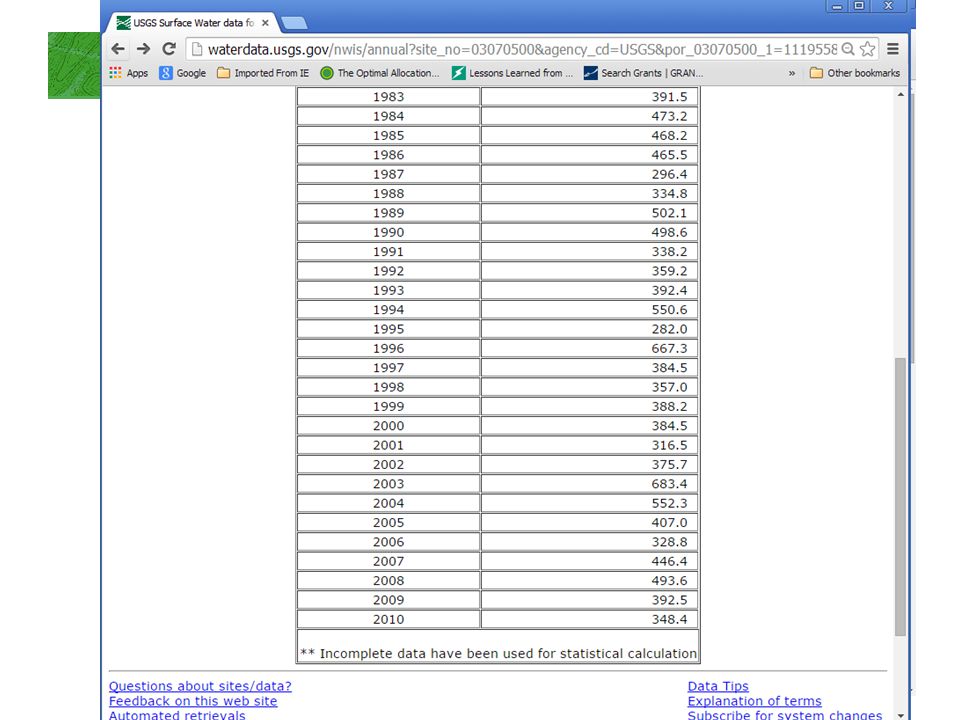
Checking the value to the gauge

29
421 cfs for 30yr annual gauge average compared to 471 modeled (within 89%)
")
30
Questions / Comments?

Similar presentations


 How many.>")


 Drainage Lines Corrected Stream Lines Filled DEM Burned DEM Flow Area Accumulation.>")

>")


