Download presentation
Presentation is loading. Please wait.

1
Using the iOBD2 Scan Tool

2
iOBD2 The iOBD2 interface is an inexpensive and easy to use diagnostic interface that allows the technician to: Read and record DTCs [Diagnostic Trouble Codes] Read freeze frame data Reset the ‘check engine’ light after a repair Read and record live data and display it as a graph Read OBDII monitor statuses

3
iOBD2 The iOBD2 can also display custom dashboard
Performance data can be obtained by combining vehicle data and GPS data to determine horsepower and torque during a road test

4
Getting started Open the App Store to download the software application App Store Type iOBD2 into the search box then hit the ‘Search’ button on the keyboard

5
Download the X-Tool application
In the menu bar select ‘iPad only’ Select the iOBD2 app by X-Tool Tech and tap on ‘Free’

6
Setup Bluetooth Insert the iOBD2 unit into the OBDII DLC connector under the dash The DLC is a sixteen pin ‘D’ shaped electrical connector

7
Diagnostic Link Connector location
The DLC is located inside the cabin, within arm’s reach of the driver 300mm Left side location is MAX 300mm from the vehicle centerline Most likely locations Alternate locations

8
Diagnostic Link Connector location
Normally the DLC is located under the steering column The iOBD2 interface module is powered by the +12 volt and ground terminal on the DLC

9
Connecting the iOBD2 interface
Insert the iOBD2 interface into the DLC

10
Go to ‘Settings’ to link by Bluetooth
Go to the settings App on your iPad to setup the Bluetooth link between your ipad and the iOBD2 interface module Make sure that no one else in your area is currently using their iOBD2 while you are setting up the Bluetooth connection If there are other students using a Bluetooth linked iOBD2 device move to another area of the shop or make the Bluetooth link outside the shop

11
Settings Go to Bluetooth and turn Bluetooth on
Select the iOBD2 interface module

12
Open the iOBD2 App Select the iOBD2 icon to open the App
You will be asked to setup a vehicle file the first time you open the App Input the data for the vehicle you currently drive or will use the iOBD2 interface on most often NOTE. The iOBD2 interface works only on vehicles built in MY 1996 and later

13
Select ‘Settings’ from the main screen
Connection Failure! Select ‘Settings’ from the main screen

14
Select ‘Connections‘ on the settings menu
Select connection to change the wireless interface type

15
Before connecting to the interface the app needs to know the type of connection
Select ‘Bluetooth MFI’ then return to the main screen

16
Connecting to the iOBD2 interface
Please wait … When you return to the main screen you should see ‘Please wait’ at the top of the screen and a flashing ‘Bluetooth’ icon in the upper left corner while the handshake between the ipad and the interface module is being made If ‘connection failure…’ is shown at the top of the screen check the Bluetooth settings in the iPad settings screen. If the Bluetooth setup looks good check for power and ground at terminals 4, 5 and 16 at the DLC

17
Main Screen Connection Successful When ‘Connection Successful’ is shown on the top of the screen the interface is ready for use

18
Main menu The diagnosis menu is a generic OBDII scan tool that is used to read codes, read serial data, check monitor readiness status and view freeze frame data

19
Main menu The ‘My dashboard’ allows you to set up custom dash instruments that can be seen easily as you drive the vehicle Note: Whenever a scan tool is connected to the DTC the communication between the scan tool and vehicle may interfere with the normal operation of the vehicle

20
Main menu The ‘Performance Test’ links data from the iOBD2 interface with data from the iPads GPS unit. This test is useful in evaluating the performance of the vehicle before and after making modifications to the engine or driveline Test done in this app need to be repeatable – 20 to 60 mph acceleration tests without changing gears is a better test than a 0-60 test as there should be no wheel spin during the test.

21
Main menu The performance graph calculates horsepower and torque during an acceleration test and displays the results as a graph The vehicle weight needs to be input into the ‘settings/vehicle’ screen before torque and power can be calculated

22
Main menu The ‘Settings’ screen is used to change:
Wireless communication protocol Units of measure Folders for vehicle history records Custom alarms

23
Main menu The ‘History’ screen is used to recall data from prior tests
Whenever you see in the upper right corner, you can save all the data on the screen to the current active folder by tapping on the save button The active folder is the folder you select or setup in ‘Settings’ when you first connect to the vehicle

24
Create a folder for vehicle data
Open the settings screen and select vehicle

25
Select ‘Vehicle’ to change the vehicle data folder or create a new folder
All saved vehicle data will be stored in this folder Each time you save data a new sub folder labeled with the current date is saved in the history folder

26
Use the ‘+’ button to create a new vehicle folder

27
Use the thumb-wheels to input Make, year and engine size
Use the keyboard to enter the Model

28
The vehicle folder with the check mark is the active folder where all data will be saved
Select the info icon on the right to edit the folder properties

29
Vehicle information The information screen allows you to edit some of the data You can alter the model to help identify the vehicle – ‘Bob Smith’s 2011 Civic’ This is also where you can delete the vehicle

30
Scan Tool Operation Select ‘Diagnosis’ from the main menu to begin using the iOBD2 in scan tool mode

31
Diagnosis main screen The ‘Diagnosis’ main screen has 8 sub-menus

32
Trouble codes Select ‘Trouble Codes’ to view:
Currently active trouble codes Pending trouble codes The ‘Trouble Codes’ is also used to reset the ‘Check Engine’ light Note: resetting the ‘check engine’ light will erase all freeze frame data and reset all monitor statuses to ‘not tested’

33
Trouble codes If there are multiple codes you may need to scroll to the bottom to read them all Tapping on the info icon will give you a brief explanation of the code

34
Trouble codes The built in code database is limited
Copy the code[s] and go to AllData for more information on what the code means and how to test the system to determine the exact cause of the code

35
Trouble codes The vehicles OBDII system monitors the operation of the emission control system If a fault occurs the will cause the vehicle to exceed 150% of the allowable emissions for that model year a Pending Code is set in the vehicles computer memory If the same fault occurs in two successive trips the ‘Check Engine’ {MIL} light will illuminate and a hard code will be recorded* * with some exceptions

36
OBDII Drive cycle [Trip]
The OBDII systems runs diagnostic for all emissions related system during a complete drive cycle [trip]. A drive cycle begins with an engine start when the coolant temperature is below 160 degrees F. The coolant temperature must rise 40 degrees F during the trip The vehicle must idle for a least 45 seconds and must be driven at speeds between 20 and 40 mph for 4 minutes or more
![OBDII Drive cycle [Trip]](http://slideplayer.com/slide/4557223/15/images/36/OBDII+Drive+cycle+%5BTrip%5D.jpg "The OBDII systems runs diagnostic for all emissions related system during a complete drive cycle [trip]. A drive cycle begins with an engine start when the coolant temperature is below 160 degrees F. The coolant temperature must rise 40 degrees F during the trip. The vehicle must idle for a least 45 seconds and must be driven at speeds between 20 and 40 mph for 4 minutes or more.")
37
OBDII Drive cycle [Trip] – cont.
About 10 seconds of ¼ throttle or more acceleration is required and the vehicle must decelerate to 0 mph at some point A short acceleration of up to 55 mph at ½ throttle is needed as well The test should cover 8 to 10 miles of driving and take about 12 to 15 minutes to perform all the test. If the trip does not fulfill all of the requirements any test data recorded during the test is erased
![OBDII Drive cycle [Trip] – cont.](http://slideplayer.com/slide/4557223/15/images/37/OBDII+Drive+cycle+%5BTrip%5D+%E2%80%93+cont..jpg "About 10 seconds of ¼ throttle or more acceleration is required and the vehicle must decelerate to 0 mph at some point. A short acceleration of up to 55 mph at ½ throttle is needed as well. The test should cover 8 to 10 miles of driving and take about 12 to 15 minutes to perform all the test. If the trip does not fulfill all of the requirements any test data recorded during the test is erased.")
38
Pending codes If a fault is detected during a completed trip a pending code is set – the check engine light will not illuminate If the same failure is not detected on the next completed trip the pending code is automatically erased

39
Hard codes & freeze frame
If the same fault happens on two consecutive trips the ‘check engine’ light illuminates and a hard code [DTC] is recorded in the vehicles memory The moment the code is set a number PIDs [parameter ID] are recorded in memory as an aid to the technician in determining the root cause of the failure PIDs stored in freeze frame include: Engine RPM Vehicle Speed Coolant Temperature MAP and MAF values Throttle position Calculated load Loop status O2 sensor voltage[s] Short term fuel trim Long term fuel trim Intake air temperature Ignition timing

40
Late model vehicles have permanent [non-erasable] codes that remain locked in memory after a DTC reset
![Late model vehicles have permanent [non-erasable] codes that remain locked in memory after a DTC reset](http://slideplayer.com/slide/4557223/15/images/40/Late+model+vehicles+have+permanent+%5Bnon-erasable%5D+codes+that+remain+locked+in+memory+after+a+DTC+reset.jpg "Late model vehicles have permanent [non-erasable] codes that remain locked in memory after a DTC reset")
41
P0123 Trouble Codes All OBDII Codes are 5 characters long
Specific circuit or system Body Chassis Powertrain Network 0 = Total System 1 = Fuel Air Control 2 = Fuel Air Control 3 = Ignition System 4 = Auxiliary Emissions Systems 5 = Idle Speed Control 6 = PCM & I/O 7 = Transmission 8 = Transmission 0 = SAE [Generic] 1 = Manufacturers All OBDII Codes are 5 characters long

42
Clearing codes Tapping on the ‘Clear Trouble Codes’ button will erase all trouble codes and turn off the ‘Check Engine’ light Besides clearing the codes all of the freeze frame data will be erased

43
Before clearing codes tap on the ‘Save’ button in the upper right corner
This will save the code to the history file [on your iPad ]

44
Live Data Live data is the meat and potatoes of the OBDII diagnostic system. Live data displays the output of selected sensors and may also display PCM output commands The amount and type of data displayed varies with the vehicle, model year and the software application Software updates can sometimes be purchased that provide a greater amount of vehicle sensor and output data

45
Tap on each PID [Parameter ID] you want to view
Alternatively you can tap on ‘All’ to select all available PIDs If the vehicle network is slow the data updates may take several seconds[slow frame rate] You may want to select just a few PIDs so that the data update is faster
![Tap on each PID [Parameter ID] you want to view](http://slideplayer.com/slide/4557223/15/images/45/Tap+on+each+PID+%5BParameter+ID%5D+you+want+to+view.jpg "Alternatively you can tap on ‘All’ to select all available PIDs. If the vehicle network is slow the data updates may take several seconds[slow frame rate] You may want to select just a few PIDs so that the data update is faster.")
46
After selecting all the PIDs you want to view tap ‘Done’ to begin receiving live vehicle data
Tapping the ‘Inverse’ button clears all the selected PIDs

47
Data for each selected PID now appears on the right side of the screen
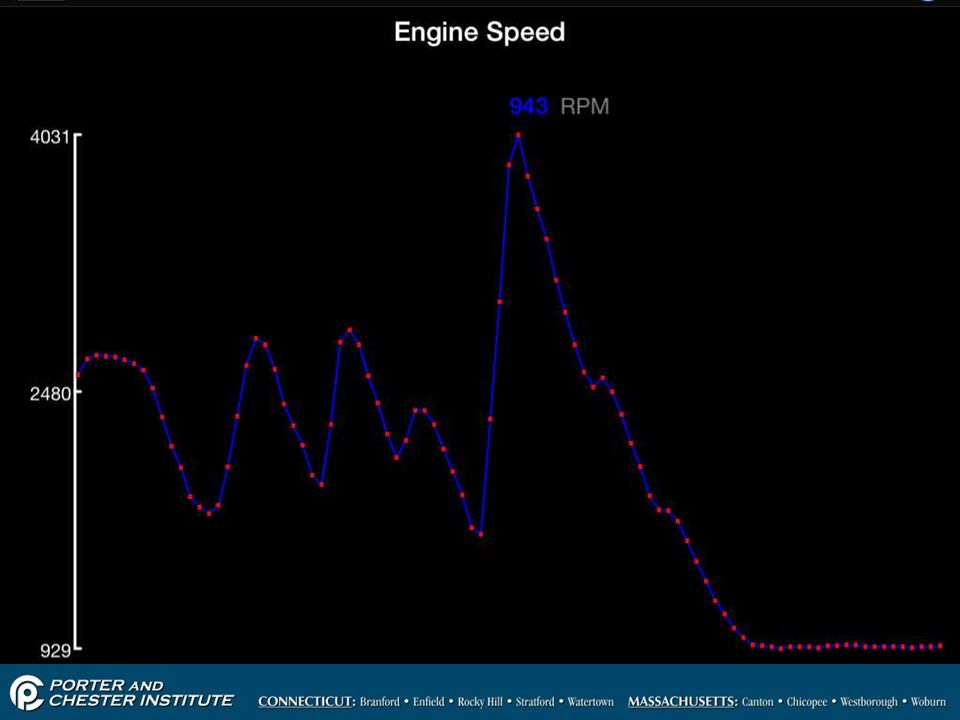
Tap anywhere on the PID line to display the data as a graph

48
The pause button in the upper right corner allows you to freeze the display
The scale on the left side will auto-range to fit the maximum and minimum values

50
Saving a screen If you want to save a data display:
Sleep / Wake button If you want to save a data display: Press and hold the Sleep/Wake button Press the Home button The screen will flash white for a second and you should hear the camera shutter sound The image is stored in the ‘Photos’ folder on the main screen Home button

51
The dots at the bottom of the live data screen indicate the number of pages of data available
Unlike most iPad apps scrolling is done horizontally in the live data screen

52
Click on Save to save to the history file
The data folder that you setup in ‘Settings’ will hold the data on the screen at the time you tapped the save button

53
Freeze Frame Freeze frame is a snap shot of PID data that is recorded the moment a DTC is set If there is more than one DTC the DTC with the higher priority will overwrite the lower priority freeze frame data Some vehicles will display more data than others but they all should display: Vehicle speed Engine RPM Coolant temperature MAP/MAF Calculated Load Long term fuel trim Short term fuel trim DTC that caused the code to be set

54
The freeze frame data shown here was set by code P0123

55
Readiness Test The readiness test checks to see if all of the monitors needed to pass a state emissions test have been completed and passed If any of the test show ‘supported and incomplete’ the vehicle will fail a state emissions test

56
Select ‘Monitor status since DTCs cleared to see if the vehicle will pass emissions testing
Select ‘Monitor status this driving cycle’ to see if the road test done after a repair was sufficient to run the monitor for the system that was repaired

57
Readiness Test When the indicator here is red the PCM has commanded the MIL light [Check Engine] on. These 3 emissions devices are not installed on this vehicle
![Readiness Test When the indicator here is red the PCM has commanded the MIL light [Check Engine] on.](http://slideplayer.com/slide/4557223/15/images/57/Readiness+Test+When+the+indicator+here+is+red+the+PCM+has+commanded+the+MIL+light+%5BCheck+Engine%5D+on..jpg "These 3 emissions devices are not installed on this vehicle.")
58
MIL light On status When buying a used car you should always check the MIL light status with a scan tool It is common to find that the bulb that illuminates the check engine light has been removed on an older car During a state emissions test if the Readiness test status reveals a MIL light status of ‘on’ the vehicle will fail the test

59
Vehicle Information The Vehicle Information screen shows:
VIN Number ECU [PCM] calibration numbers In-use performance tracking ECU calibration numbers are used to determine if the PCM has been re-flashed and if the software can be updated to a newer version In-use performance tracking keeps tabs on how many times the system monitors have run

60
Compare the Calibration ID numbers with those listed in AllData or Identifix to see if a re-flash is appropriate

61
O2 sensor test The values here are stored values – not live data
The O2 sensor test displays the results of the last monitor test of the oxygen sensor The values here are stored values – not live data

62
Select the sensor you want to look at
On a V6 or V8 engine Bank 1 is the side of engine where #1 cylinder is located The is no Bank 2 on an inline engine [4 cyl] Sensor 1 is the sensor closest to the combustion chamber Sensor 2 is normally at the converter output

63
The most useful data here are the lean/rich and rich/lean switch times
The switch times should be less than 100ms When switch times increase above 100ms the sensor has become lazy and is due for replacement

64
Mode 6 Data Mode 6 data is raw data that the PCM uses for basic vehicle operation and emissions testing that can be accessed for diagnostic purposes The amount and type of Mode 6 data varies between vehicle and scan tools The Mode 6 data is stored data that was recorded when the monitor was last run

65
Cylinder misfire data is valuable data that can be used to track down the cause of a P0300 code [random misfire]
![Cylinder misfire data is valuable data that can be used to track down the cause of a P0300 code [random misfire]](http://slideplayer.com/slide/4557223/15/images/65/Cylinder+misfire+data+is+valuable+data+that+can+be+used+to+track+down+the+cause+of+a+P0300+code+%5Brandom+misfire%5D.jpg "Cylinder misfire data is valuable data that can be used to track down the cause of a P0300 code [random misfire]")
66
RPM/Load block The system records how many times a misfire was detected over a 2000 revolution period If one cylinder has a substantially higher number of misfires it points to a fault at that cylinder

67
This test is often run several hours after the engine is shot down
The heaters for the O2 sensors are turned on and the PCM measures the change in current flow as the heaters warm up

68
Component test Component test are bi-directional controls where the scan tool is used to command the PCM to turn an electrical circuit on or off The only b-directional control found on most generic scan tools is the EVAP system test where the scan tool is used to close the canister vent solenoid and open the purge solenoid This test is useful when using a smoke machine to find the source of an EVAP system leak

69
Tap on Evap Leak test to begin the test

70
Non Scan Tool functions

71
Dash Boards Dashboards are primarily intended for hobbyist who want to tinker with there vehicles They can be useful in road testing a vehicle for an intermittent problem that doesn’t have any gauges

72
3 boiler plate dash boards
Idle Mode Cruise Mode Sport Mode

73
Custom dashboard The custom dashboard allows the user to select and display 8 PIDs simultaneously

74
Heads-Up display The HUD button is available in all of the dashboard modes The HUD function inverts and flips the display to a mirror image When the iPad is placed on top of the dash the reflection of the iPad screen on the windshield will be easily readable

75
Performance test Performance tests use the data from the VSS [vehicle speed sensor] and GPS to determine how fast the vehicle can accelerate If the weight of the vehicle and the rate of acceleration are known the amount of engine torque can be calculated The acceleration test measures the time and distance traveled while accelerating between two preset velocities The meter acceleration test is timed ¼ mile test that records elapsed time and trap speed
![Performance test Performance tests use the data from the VSS [vehicle speed sensor] and GPS to determine how fast the vehicle can accelerate.](http://slideplayer.com/slide/4557223/15/images/75/Performance+test+Performance+tests+use+the+data+from+the+VSS+%5Bvehicle+speed+sensor%5D+and+GPS+to+determine+how+fast+the+vehicle+can+accelerate..jpg "If the weight of the vehicle and the rate of acceleration are known the amount of engine torque can be calculated. The acceleration test measures the time and distance traveled while accelerating between two preset velocities. The meter acceleration test is timed ¼ mile test that records elapsed time and trap speed.")
76
Acceleration test The acceleration test requires the user to input a start and end velocity You normally want to choose a range that will allow you to remain in second or third gear so that the engine will be near redline at the end speed

77
¼ mile test The 0 – 400 Acceleration test simulates a ¼ timed run…400 meters is 7 ½ feet shorter than ¼ mile The timer starts as soon as the VSS exceeds 0 mph and ends when the vehicle has traveled 400 meters The distance here is greater than 400 meters because the data transfer rate between the vehicle and the iOBD2 is relatively slow

78
Performances Graphs Performance graphs are normally recorded under a full throttle acceleration run There are two test modes Vehicle speed / Engine RPM Engine RPM / Engine torque & Power Currently the program displays engine power in Kw [the metric equivalent of horsepower] regardless of how the unit of measure is setup in settings

79
This graph shows the effective gear ratios as the vehicle accelerates and decelerates
The vehicle shown has a CVT transmission so the graph is very different from a vehicle with a standard transmission

80
The weight of the vehicle is needed in the power calculation
If the weight shown here is incorrect it can be changed in the settings window To convert kw to horsepower divide by 0.746 Example: 86.1 kw / = 115hp

81
History The history screen allows you to review data that was recorded in previous sessions You don’t need to be link to the iOBD2 interface to access the history screen

82
Select the vehicle you want to review

83
Selecting ‘Edit’ allows you to delete unwanted history files
Select what type of data you want to look at

84
Tap on the delete button on the left edge of the data folder and the folder will shift left to reveal the delete box on the right

85
Tapping on the folder line opens a screen that contains all the data at the moment the ‘Save’ button was tapped Vehicle was running in electric mode when save button was tapped

86
Trip Map When a dashboard is opened the start point and end point of a trip is recorded in the history file. Note: the end point is currently the first time the vehicle comes to a dead stop When the trip is opened in the history file the start and end points will be displayed on a map

87
Updates The manufacture of the iOBD2 interface is continuously updating the software Go to the App Store and tap on the ‘Updates’ icon on the bottom of the screen If there is an update available tap on the update box to begin the download

Similar presentations


 IGNITION SYSTEM DISTRIBUTORLESS IGNITION SYSTEM.>")


 118 931 4062 F :>")

