Download presentation
Presentation is loading. Please wait.

1
An Overview of Food And Nutrition Situation in Pakistan Freedom from hunger and malnutrition is a basic human right. Nutrition has been expressed as a right in various international declarations and human rights instruments from time to time. According to UN Article 24, states are mandated to provide medical assistance and health care to all children, combat disease and malnutrition through provision of adequate nutritious foods, safe drinking water and adequate sanitation and provide families with information about the advantages of breast feeding.

2
Intake of Food by Food Groups Food groupsPer person per day (gm) Distribution of food among Adult Males (%) Urban Rural Total Cereals42699 Wheat362 Rice38 Other Cereals26 Fat and oils399896 Sugar80 Roots383138 Pulses1833 Meat36 24 Fish744 Eggs6116 Milk4113859 Vegetables945441 Fruits8852 Tea28264 Source: FAO (2000). Food Balance Sheet. Rome. National Institute of Health (1988). National Nutrition Survey, Islamabad.
. National Nutrition Survey, Islamabad..")
3
Dietary Pattern of Adult Males (%) in Different Provinces Food TypePunjabSindhNWFPBalochistan AJ&K Cereals9899 98 100 Fat & Oils981009789 100 Roots14544236 6 Pulses30412532 38 Meat27243441 50 Fish12014 1 Eggs10858 14 Milk57721727 14 Vegetables64293027 75 Leafy Vegetables 51063 5 Fruits6262 5 Tea71439796 90 Source: National Institute of Health (1998) National Nutrition Survey, Islamabad
 in Different Provinces Food TypePunjabSindhNWFPBalochistan AJ&K Cereals Fat & Oils Roots Pulses Meat Fish Eggs Milk Vegetables Leafy Vegetables Fruits Tea Source: National Institute of Health (1998) National Nutrition Survey, Islamabad")
4
Availability of Dietary Energy from various Food Groups Food Groups Available Calories per head per day 19902000Desirable Total Cereals 13931274924 Pulses 5861139 Vegetables & Fruits 75102231 Total Animal Products 237430462 Added Fats & Oils 324302231 Sugar & Honey 265283185 Others 40060 Total Calories 23922452 Average Requirements 2310 Calories % Requirement 103.5106.1 Sources: FAO (1990, 2000) food Balance Sheet. Rome Pakistan is not a food insecure country.

5
Quantity and Nutritional Quality of Diets Available During 1990 & 2000 IndicatorsPer capitaPer dayCriteria for balance diet 19902000 Quantity Calories23922452 Proteins (g)58.462.5 Fats (g)58.564.2 Quality Percent Calories from: Protein9.810.210.-15 Carbohydrates68.266.255-70 Fats22.023.620-30
 Fats (g) Quality Percent Calories from: Protein Carbohydrates Fats")
6
Causes of Malnutrition Poverty Shortage of food Maldistribution of Food Infections Ignorance

7
Food Insecurity Profile – District Wise Calories/Capita/day of all food (Consumption Vs. Production) Punja b NWF P Sindh Baloc histan N.AAJKFATA High Insecu re 420315477 Mediu m Insecu re 33141-- Secure271135--- Source: State of food insecurity in rural Pakistan. SDPI, 2003. National Outlook: Out of 120 district settings, 74 (62%) were found to be food deficit.
 Punja b NWF P Sindh Baloc histan N.AAJKFATA High Insecu re Mediu m Insecu re Secure Source: State of food insecurity in rural Pakistan. SDPI, National Outlook: Out of 120 district settings, 74 (62%) were found to be food deficit..")
8
Nutritional Status Nutrient Intake of School Girls (6-15 Years) % of RDA Calories 86% Protein118 Iron67 Prevalence of Malnutrition (Under Five) Low birth weight25-34% (1.42 -1.94 million) Under Weight 40% (9.5 million) (Low Weight for Age) Stunting50% (12 million) (Low Height for Age) Wasting9% (12 million) (Low weight for Height) Anemia51% (Iron Deficiency) Goitre (Iodine Deficiency) 77% School age children Bitot’s Spot (Vitamin A Deficiency) 5.8%
 % of RDA Calories 86% Protein118 Iron67 Prevalence of Malnutrition (Under Five) Low birth weight25-34% ( million) Under Weight 40% (9.5 million) (Low Weight for Age) Stunting50% (12 million) (Low Height for Age) Wasting9% (12 million) (Low weight for Height) Anemia51% (Iron Deficiency) Goitre (Iodine Deficiency) 77% School age children Bitot’s Spot (Vitamin A Deficiency) 5.8%")
9
Incidence of Malnutrition (Under five) in Pakistan MalnutritionNHSNNSFAO___________ Indicators1990-94 2000-02 1990 1999-2000 ____________________________________________________________________ Underweight39%38% Stunting35%37%35%50% Wasting14%13% ____________________________________________________________________ Child Mortality in Pakistan Mortality/1000 live births19901999 Infant mortality10490 Under five mortality rate138126 ____________________________________________________________________ Cost of Malnutrition Malnutrition costs the country Rs 200 billion every year equivalent of more than 5% of GNP in lost lives, disability and productivity.
 in Pakistan MalnutritionNHSNNSFAO___________ Indicators ____________________________________________________________________ Underweight39%38% Stunting35%37%35%50% Wasting14%13% ____________________________________________________________________ Child Mortality in Pakistan Mortality/1000 live births Infant mortality10490 Under five mortality rate ____________________________________________________________________ Cost of Malnutrition Malnutrition costs the country Rs 200 billion every year equivalent of more than 5% of GNP in lost lives, disability and productivity.")
10
Breast Feeding Practices Duration UNICEF NNS 1990 2000 2000 - 2 0-3 months 87%16%62% 6-9 months 74% 31%35%

11
Other Indicators Related To Child Nutrition Infant mortality rate90 per 1000 live births Under five mortality rate126 per 1000 live births Adult female literacy rate24% Female literacy as % of males48% Number of children out of school8.2 million Number of girls out of school 5.9 million Primary school enrollment46% Middle school enrollment16% Secondary school enrollment52% Drop out of rural girls at primary school Level75% Rural girls (12 year old) continue school 3% Rural boys (12 year old) continued school18% Coefficient of educational efficiency68% No of Government primary school Without water and sanitation facilities90% No of primary school without shelter And boundary wall50%
 continue school 3% Rural boys (12 year old) continued school18% Coefficient of educational efficiency68% No of Government primary school Without water and sanitation facilities90% No of primary school without shelter And boundary wall50%")
12
Quality of Life Poverty % population below poverty line34 % population below $ 1 a day31 % population below $ 2 a day85 New born weighted at birth (%)12 Babies registered at birth (%)30 Breast feeding practices 0-3 months (%)16 6-9 months (%)31 Access to sanitation30 (% of population) Access to improved water source60 (% of population) Parasitic Infections60 (% of population) Consumption of iodized salt19 (% of households) (% of households) Vitamin A supplementation1 (% coverage of pre-school children) Physicians (Per 1000 people)0.6 Health Expenditure (% of GDP)0.9 Education Expenditure (% of GDP)2.7 Economic cost of Malnutrition200 Economic cost of Malnutrition200 (Billion rupees per year)(5% of GDP) Life ExpectancyMales61 years Females63 years
12 Babies registered at birth (%)30 Breast feeding practices 0-3 months (%) months (%)31 Access to sanitation30 (% of population) Access to improved water source60 (% of population) Parasitic Infections60 (% of population) Consumption of iodized salt19 (% of households) (% of households) Vitamin A supplementation1 (% coverage of pre-school children) Physicians (Per 1000 people)0.6 Health Expenditure (% of GDP)0.9 Education Expenditure (% of GDP)2.7 Economic cost of Malnutrition200 Economic cost of Malnutrition200 (Billion rupees per year)(5% of GDP) Life ExpectancyMales61 years Females63 years")
13
REPRODUCTIVE HEALTH Female Population 48.2 (% of Total) Total Fertility 4.8 (Births per Women) Adolescent Fertility Rate100 (Births per 1000 Women) Contraceptive Prevalence Rate 24 (% of Women) (% of Women) Pregnant Women Receiving Prenatal Care27 Births Attended By Skilled Health Staff19 (% of Total) (% of Total) Prevalence Of Anemia 37 (% of Pregnant Women) Maternal Mortality Rate 340/100,000 (600,000/ year) (600,000/ year)
 Total Fertility 4.8 (Births per Women) Adolescent Fertility Rate100 (Births per 1000 Women) Contraceptive Prevalence Rate 24 (% of Women) (% of Women) Pregnant Women Receiving Prenatal Care27 Births Attended By Skilled Health Staff19 (% of Total) (% of Total) Prevalence Of Anemia 37 (% of Pregnant Women) Maternal Mortality Rate 340/100,000 (600,000/ year) (600,000/ year)")
14
Indicators Indicating the Progress of a Nation % of children adequately nourished % of being educated to at least 5 th grade % of children surviving to age of five National Performance Gap * Children under five mortality-27% Children under weight-13% Children reaching grade five-18% _________________________________________________ *A measure of the extent to which positive child right are being honored in relation to available resources. *Country has not achieved considerably social progress *Low level of education and poor health and nut status are limiting pale productivity and adversely affecting economic growth and poverty redirection prospects.

15
Indicators for Assessing and Monitoring Nutritional Problems Food Crises Production patterns Production patterns market prices market prices Food stocks Food stocks Fall in body weights Fall in body weights Protein – energy malnutrition Children’s anthropometry (weight for height for age, weight for age, height for weight) Children’s anthropometry (weight for height for age, weight for age, height for weight) Children's’ growth Children's’ growth Infectious disease rate Infectious disease rate Food intake relative to need Food intake relative to need Body mass index Body mass index Micronutrient deficiencies Iron deficiency : rates of anemia Iron deficiency : rates of anemia Vitamin A deficiency: night blindness/xerophthalmia Vitamin A deficiency: night blindness/xerophthalmia Iodine deficiency: goiter, cretinism Iodine deficiency: goiter, cretinism Household food security Employment levels Employment levels Market prices Market prices Changes in real income and purchasing power Changes in real income and purchasing power Dietary energy supply Dietary energy supply Caring capacity Maternal education Maternal education Maternal employment, public expenditure Maternal employment, public expenditure Literacy rates Literacy rates Breast feeding (duration and percentage) Breast feeding (duration and percentage)
 Children’s anthropometry (weight for height for age, weight for age, height for weight) Children s’ growth Children s’ growth Infectious disease rate Infectious disease rate Food intake relative to need Food intake relative to need Body mass index Body mass index Micronutrient deficiencies Iron deficiency : rates of anemia Iron deficiency : rates of anemia Vitamin A deficiency: night blindness/xerophthalmia Vitamin A deficiency: night blindness/xerophthalmia Iodine deficiency: goiter, cretinism Iodine deficiency: goiter, cretinism Household food security Employment levels Employment levels Market prices Market prices Changes in real income and purchasing power Changes in real income and purchasing power Dietary energy supply Dietary energy supply Caring capacity Maternal education Maternal education Maternal employment, public expenditure Maternal employment, public expenditure Literacy rates Literacy rates Breast feeding (duration and percentage) Breast feeding (duration and percentage)")
16
NUTRITIONAL CHALLANGES Poor Household Food Security Low Birth Weight Child Feeding Malpractices Childhood Under-Nutrition (PCM) Micronutrient Deficiencies (Vitamin A, Iodine, Iron, Zinc)
 Micronutrient Deficiencies (Vitamin A, Iodine, Iron, Zinc)")
17
Interventions for Improving Nutrition Status Interventions Benefits Breast Feeding Improved breast feeding practice Can reduce child malnutrition and reduced bottle feeding mortality and can save more children Improved Food Intake Per capita food availability Can reduce child malnutrition by 26% During pregnancy Can reduce LBW by 40%, infant disability by 33% and infant mortality by 50% Vitamin A Supplementation During Pregnancy Can reduce maternal mortality by 44% To new born in the first 48 hours Can reduce infant mortality by 24% Improved Health Environment Can reduce child malnutrition by 19% Improved Education Level Of Mothers Primary School Can reduce child stunting by 13% Secondary School Can reduce child malnutrition by 43% Income Increased per capita income by 10% Can reduce child stunting by 2%

18
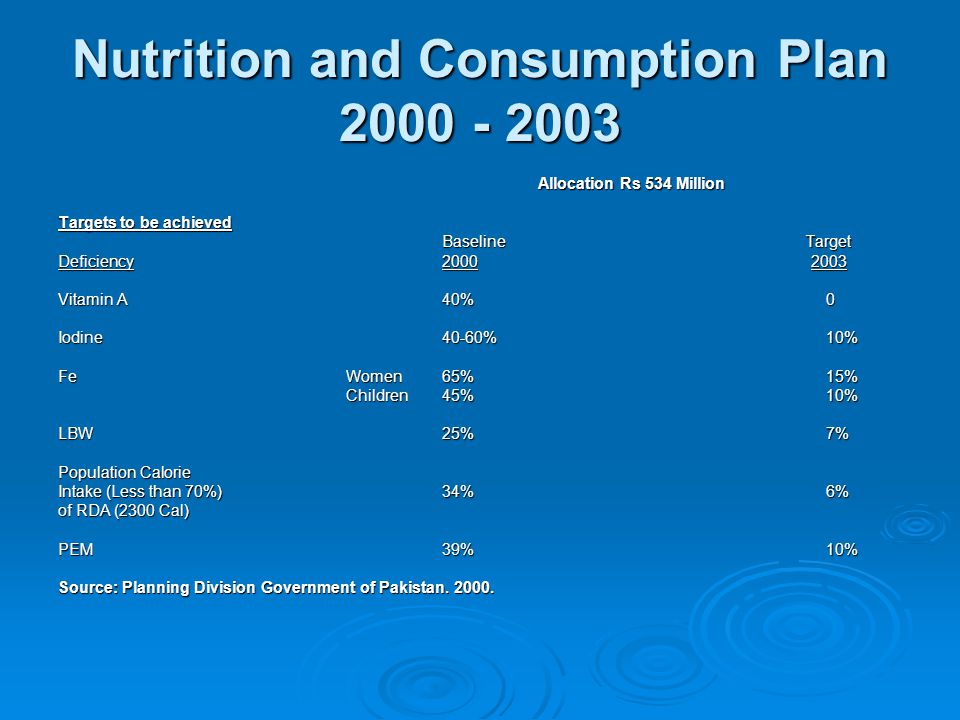
Nutrition and Consumption Plan 2000 - 2003 Allocation Rs 534 Million Allocation Rs 534 Million Targets to be achieved Baseline Target Deficiency 2000 2003 Vitamin A40%0 Iodine40-60%10% FeWomen65%15% Children45%10% LBW25%7% Population Calorie Intake (Less than 70%)34%6% of RDA (2300 Cal) PEM39%10% Source: Planning Division Government of Pakistan. 2000.
19
Policies and Strategies to Improve Nutrition By improving household income and food security Education levels of mothers Children feeding practices Nutrition education and investment in nutrition Health environment National nutrition surveillance and statistical system Biotechnology applications Communication between public and private sectors Good governance Political stability

20
Some points to ponder Good nutrition in early life pays dividends in childhood and in later life. Malnutrition adversely affects mental development, physical development, productivity and span of working years, all of which significantly influence the economic potential of man. Poverty is closely correlated with under nutrition. No progress in child health can be achieved unless under nutrition among children is eliminated. A malnourished nation cannot participate in economic development effectively unless its nutritional problems are solved. Low levels of education and poor health and nutrion status are limiting Pakistan’s productivity and adversely affecting economic growth and poverty reduction prospects. Investment in nutrition reduces health care cost and the burden of non-communicable diseases. The country has not achieved normalcy in nutritional stability due to poor nutrition planning and implementing national programmes.

21
Nutritional Interventions of Tawana Pakistan Project Nutritional Interventions Deworming Drugs Noon Meal Micronutrient Supplements Including iron, iodine and Vitamin A Improves Nutritional Status Prevents Infections and Nutritional Deficiency Diseases Improves School Enrollment and Performance Benefits To School Girls

22
Tawana Pakistan Project: School Nutrition Package for Girls Objectives Improve nutritional status of school girls (5-12 years) through school feeding programme, deworming and micronutrient supplements. Increase enrollment and sustain attendance of girls and to reduce gender gap in School Enrollment. Create community awareness for healthy living through health and nutrition education. Beneficiaries Number of high poverty districts:29 Number of girls (5-12 years):530,000 Number of schools:5,300 Communities in target villages:5,300 (10.5 million)
:530,000 Number of schools:5,300 Communities in target villages:5,300 (10.5 million).")
Similar presentations


 Jamai-Osmania (P.O.), Hyderabad.>")


 Kevin Cleaver Director of Agriculture and Rural Development November 2004.>")
