Download presentation
Presentation is loading. Please wait.

1
Developing and Using a Simple Regression Equation. The simple regression model is based on the equation for a straight line: Yc = A+BX

2
Yc = A+BX where: Yc = the calculated or estimated value for the dependent variable A= the Y intercept B= the slope of the line X = independent variable

3
Graphical depiction of a regression line Y X 0 Yc = A + BX intercept slope

4
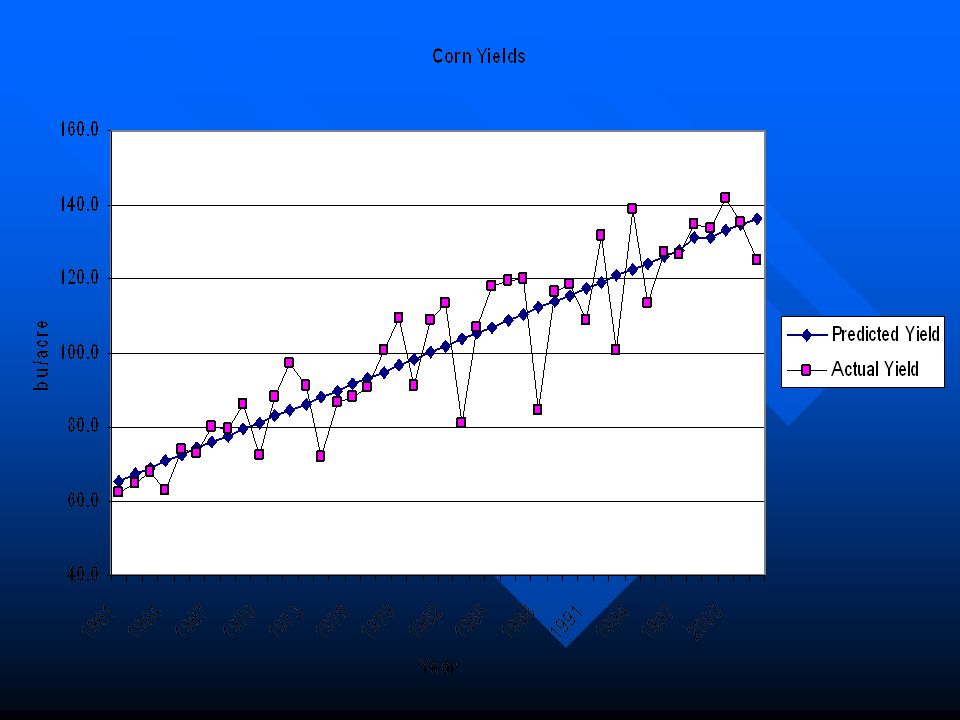
How can we estimate next year’s yield?

5
Take the average?

7
What might trend represent?

8
What might trend represent? Technology – innovation – hybrid development

9
We want to find the line of best fit. An average just won’t cut it.

10
Graphical depiction of a regression line Y X 0 * * * * * *

11
Step 1: Collect the historical data. Every Y observation must have an X.

12
Step 2: Put the data in a tabular form. X Y

13
Step 3: Calculate the Means of X and Y

14
X = X ----- n Y = Y ----- n

15
Step 4. Compute the slope (B) and Y intercept (A) B = XY – n X Y ------------------ X 2 – n X 2
 and Y intercept (A) B = XY – n X Y X 2 – n X 2")
16
A = Y - BX

18
B = 1823124 – (7*1997*130.414) ______________________ 27916091 – (7*1997*1997) B = (67/28) = 2.3929
 ______________________ – (7*1997*1997) B = (67/28) =")
19
A = 130.414 – (2.3929 * 1997) A = 130.414 – 4778.62 A = - 4648.20
 A = – A =")
20
Y 2001 Y 2001 = -4648.20 +(2.3929*2001) Y 2001 = 139.99
 Y 2001 =")
Similar presentations