Download presentation
Presentation is loading. Please wait.

1
Behavior-based Authentication Systems
Multimedia Security

2
Part 1: Part 2: User Authentication Through Typing Biometrics Features
User Re-Authentication via Mouse Movements

3
User Authentication Through Typing Biometrics Features
Lívia C. F. Araújo, Luiz H. R. Sucupira Jr., Miguel G. Lizárrage, Lee L. Ling, and João B. T. Yabu-Uti, Correspondence, IEEE Transactions on Signal Processing, vol. 53, no. 2, Feb. 2005,

4
Introduction The login-password authentication is the most usual mechanism used to grant access. low-cost familiar to a lot of users however, fragile (careless user / weak password) The paper provides better approach to improve above one using biometric characteristics. unique cannot be stolen, lost, forgotten
 The paper provides better approach to improve above one using biometric characteristics. unique. cannot be stolen, lost, forgotten.")
5
Introduction (cont.) The technology used is typing biometric, keystroke dynamics. monitoring the keyboard inputs to identify users based on their habitual typing rhythm pattern The method's advantages low-cost (using keyboard) unintrusive (using a password) using a static approach (using the login session)
 unintrusive (using a password) using a static approach (using the login session)")
6
Some Keywords Target String
The input string typed by the user and monitored by system String length is important issue. (at least ten characters) Number of Samples Samples collected during the enrollment process to compound the training set Its number varies a lot. Features key duration (the time interval that a key remains pressed) keystroke latency (the time interval between successive keystrokes)
 Number of Samples. Samples collected during the enrollment process to compound the training set. Its number varies a lot. Features. key duration (the time interval that a key remains pressed) keystroke latency (the time interval between successive keystrokes)")
7
Some Keywords (cont.) Timing Accuracy Trials of Authentication
The precision of the key-up and key-down times have to be analyzed. It varies between 0.1ms ad 1000ms. Trials of Authentication The legitimate users usually fail in the first of authentication. If the user still fail in the second time, he will be considered an impostor. Adaptation Mechanism Biometric characteristics changes over time. The system need updated. Classifier k-means, Bayes, fuzzy logic, neural networks, etc.

8
The Approach Proposed Get target string with at least ten characters.
Get ten samples. (more than ten samples may annoy the users) Analysis features: (The combination of these features is novel in this paper.) key code two keystrokes latencies key duration 1-ms time accuracy is used. An adaptation mechanism is used to update template.
 Analysis features: (The combination of these features is novel in this paper.) key code. two keystrokes latencies. key duration. 1-ms time accuracy is used. An adaptation mechanism is used to update template.")
9
Flowchart of the Methodology

10
Main Issue Timing Accuracy Keystroke Data Features Template Classifier
Adaptation Mechanism

11
Timing Accuracy Since 98% of the samples' value are between 10 and 900ms, 1-ms precision is used.

12
Keystroke Data m characters, n keystrokes (m ≦ n) sample w, account a
Each is composed of

13
Features key code down-down (DD)
up-down (UD) (This feature may be pos. or neg.) down-up (DU) (key interval)
 (This feature may be pos. or neg.) down-up (DU) (key interval)")
14
Features (cont.) The distance will be discussed later.
 The distance will be discussed later.")
15
Template (constructed by ten samples)
")
16
Classifier If , the sample is considered false.
Otherwise, for each time feature, calculate the distance between template and samples.

17
Classifier (cont.) The sample will be considered true if
A user’s feature with a lower variance demands a higher threshold and vice versa.

18
Adaptation Mechanism If , add this sample into template and discard the oldest one. The standard deviation for each feature is modified and the threshold are modified.

19
Experiements 30 users (men and women between 20 and 60 years old)
Three situation Legitimate user authentication Imposter user authentication Observer imposter user authentication Seven experiments 1) only DD; 2) only UD; 3) only DU; 4) DD and UD; 5) DD and DU; 6) UD and DU; 7) DD, UD, and DU
 only DD; 2) only UD; 3) only DU; 4) DD and UD; 5) DD and DU; 6) UD and DU; 7) DD, UD, and DU.")
20
Result False Acceptance Rate (FAR) False Rejection Rate (FRR) Zero FAR
Zero FRR Equal Error Rate (EER)
")
21
Only DD time; Only UD time; Only DU time; DD and UD times; DD and DU times; UD and DU times; DD, UD, and DU times.

23
Discussion A target string with capital letters increases the difficulty of authentication. The familiarity of the target string to the user has a significant impact. (FRR 17.26%) One-trial authentication significantly increase the FRR. (FRR 11.57%) The adaptation mechanism decreases both rate. (FAR 4.70% FRR 4.16%)
 One-trial authentication significantly increase the FRR. (FRR 11.57%) The adaptation mechanism decreases both rate. (FAR 4.70% FRR 4.16%)")
24
Discussion (cont.) If the adaptation mechanism is always activated, the FAR increase a lot. (FAR 9.4% FRR 3.8%) A higher timing accuracy decreases both rate. (FRR 1.63% FAR 3.97) FRR increases as the number of samples is reduced.
 FRR increases as the number of samples is reduced.")
27
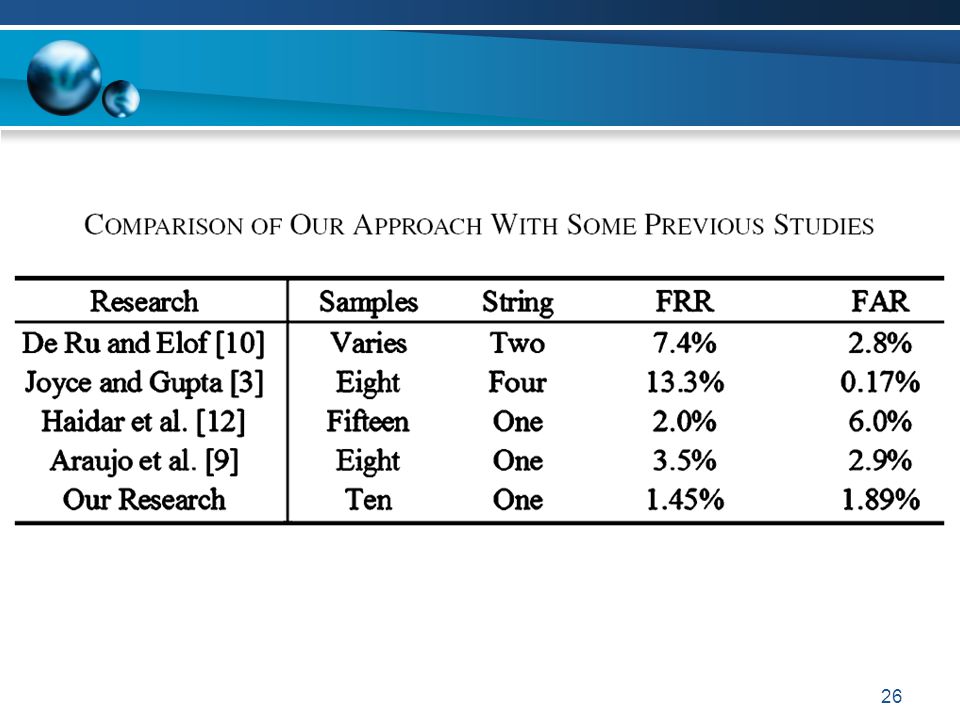
Conclusion The method applied uses just one target string and ten samples in enrollment. The best performance was achieved using a statistical classifier base on distance and the combination of four feature (key code, DD, UD, DU times) which is novel, obtaining a 1.45% FRR and 1.89% FAR. This paper shows the influence of some aspects, such as the familiarity of the target string, the two-trial authentication, the adaptation mechanism, the time accuracy, the number of samples in enrollment.
 which is novel, obtaining a 1.45% FRR and 1.89% FAR. This paper shows the influence of some aspects, such as the familiarity of the target string, the two-trial authentication, the adaptation mechanism, the time accuracy, the number of samples in enrollment.")
28
User Re-Authentication via Mouse Movements
Maja Pusara and Caria E.Brodley, Proceedings of the 2004 ACM workshop on Visualization and data mining for computer security

29
Outline Introduction User Re-Authentication via Mouse Movements
An Empirical Evaluation Future work

30
Introduction(1/3) Why re-authentication?
The purpose of a re-authentication system is to continually monitor the user’s behavior during the session to flag “anomalous” behavior Defend “insider attacks” Ex. Forget to logout, forget to lock… Ex. Employees, temporary workers, consultants.

31
Introduction(2/3) Traditional re-authentication
Periodically ask the user to authentication via passwords, tokens, … . Behavioral re-authentication Direct: keystroke, mouse, … . Indirect: system call trace, program execution traces, … .

32
Introduction(3/3) This paper…
Collect data form 18 users all working with Internet Explorer and browse the fixed webpages with fixed mouse device.

33
User Re-Authentication via Mouse Movements
Roughly Data Collection and Feature Extraction Building a Model of Normal Behavior Anomaly Detection

34
The cursor movement Examine whether the mouse has moved every 100msec.
User Re-Authentication via Mouse Movements Data Collection and Feature Extraction(1/4) The cursor movement Examine whether the mouse has moved every 100msec. Record distance, angle, and speed. Extract mean, standard deviation, and the third moment values over a window of N data points.
 The cursor movement. Examine whether the mouse has moved every 100msec. Record distance, angle, and speed. Extract mean, standard deviation, and the third moment values over a window of N data points.")
35
User Re-Authentication via Mouse Movements Data Collection and Feature Extraction(2/4)
The mouse event NC area: the area of the menu and toolbar

36
The mouse event Record time of the event.
User Re-Authentication via Mouse Movements Data Collection and Feature Extraction(3/4) The mouse event Record time of the event. Record distance, angle, and speed between pairs of data point A and B, where B occurs after A. Calculate the value every f (frequency) data points. Extract mean, standard deviation, and the third moment values over a window of N data points
 The mouse event. Record time of the event. Record distance, angle, and speed between pairs of data point A and B, where B occurs after A. Calculate the value every f (frequency) data points. Extract mean, standard deviation, and the third moment values over a window of N data points.")
37
Summary of feature extraction
User Re-Authentication via Mouse Movements Data Collection and Feature Extraction(4/4) Summary of feature extraction The # of observed events in the window. (6) - events. The mean, standard deviation, and the third moment of the distance, angle, and speed between pairs of points. ( 3 * 3 * (6+1) ) - cursor & events. The mean, standard deviation, and the third moment of the X and Y coordinates. ( 3 * 2 * (6+1) ) - cursor & events.
 Summary of feature extraction. The # of observed events in the window. (6) - events. The mean, standard deviation, and the third moment of the distance, angle, and speed between pairs of points. ( 3 * 3 * (6+1) ) - cursor & events. The mean, standard deviation, and the third moment of the X and Y coordinates. ( 3 * 2 * (6+1) ) - cursor & events.")
38
Using supervised learning algorithm Specify the window size N
User Re-Authentication via Mouse Movements Building a Model of Normal Behavior(1/1) Using supervised learning algorithm Specify the window size N Specify frequency for every categories
 Using supervised learning algorithm. Specify the window size N. Specify frequency for every categories.")
39
User Re-Authentication via Mouse Movements Anomaly Detection(1/1)
Simple method Trigger an alarm each time a data point in the profile is classified as anomalous Smooth filter Require t alarms to occur in m observations of the current user’s behavior profile. If it is anomalous : asks the user to authenticate again or reports the anomaly to a system administrator.

40
An Empirical Evaluation(1/6)
The goal of our experiments is to determine whether a user x when running an application (e.g., Internet Explorer) can be distinguished from the other n-1 users running the same application.
 can be distinguished from the other n-1 users running the same application.")
41
An Empirical Evaluation(2/6)
2/4 for training, 1/4 for parameter selection, 1/4 for testing. Data Sources 18 students 10000 unique cursor locations The same set of web pages Windows Internet Explorer Parameter selection Frequency: 1,5,10,15,20 Window size: 100,200,400,600,800,1000 Smoothing filter m: 1,3,5,7,9,11

42
An Empirical Evaluation(3/6)
Decision Tree Classifier

43
An Empirical Evaluation(4/6)
Pair-Wise Discrimination: Distinguish two people #6 and #18 with too few mouse movements

44
An Empirical Evaluation(5/6)
Anomaly Detection: False positive rate: authorized user -> intruder False negative rate: intruder -> authorized user A high false positive rate means too few mouse events

45
An Empirical Evaluation(6/6)
Smoothing Filter:

46
Future work Research the impact of replay attacks
How best to apply unsupervised learning How to incorporate the results from different sources. (ex keystroke , mouse)
")
Similar presentations


 Usually configured to protect from at least two types of attack ▪ Control sites which local users.>")

 by adding a dynamic branching mechanism to neural networks.>")

 Developed.>")


