Download presentation
Presentation is loading. Please wait.

1
Realizing Our Potential Phil Widman

2
Performance Continues to Improve Markets are generally robust with pockets of weakness Rapid growth continues to strain our capabilities, requiring heroic efforts in many cases Benefit of internal initiatives is starting to show Delivering industry leading Return on Invested Capital – with room to improve Continued vigilance still required on Business Practices

3
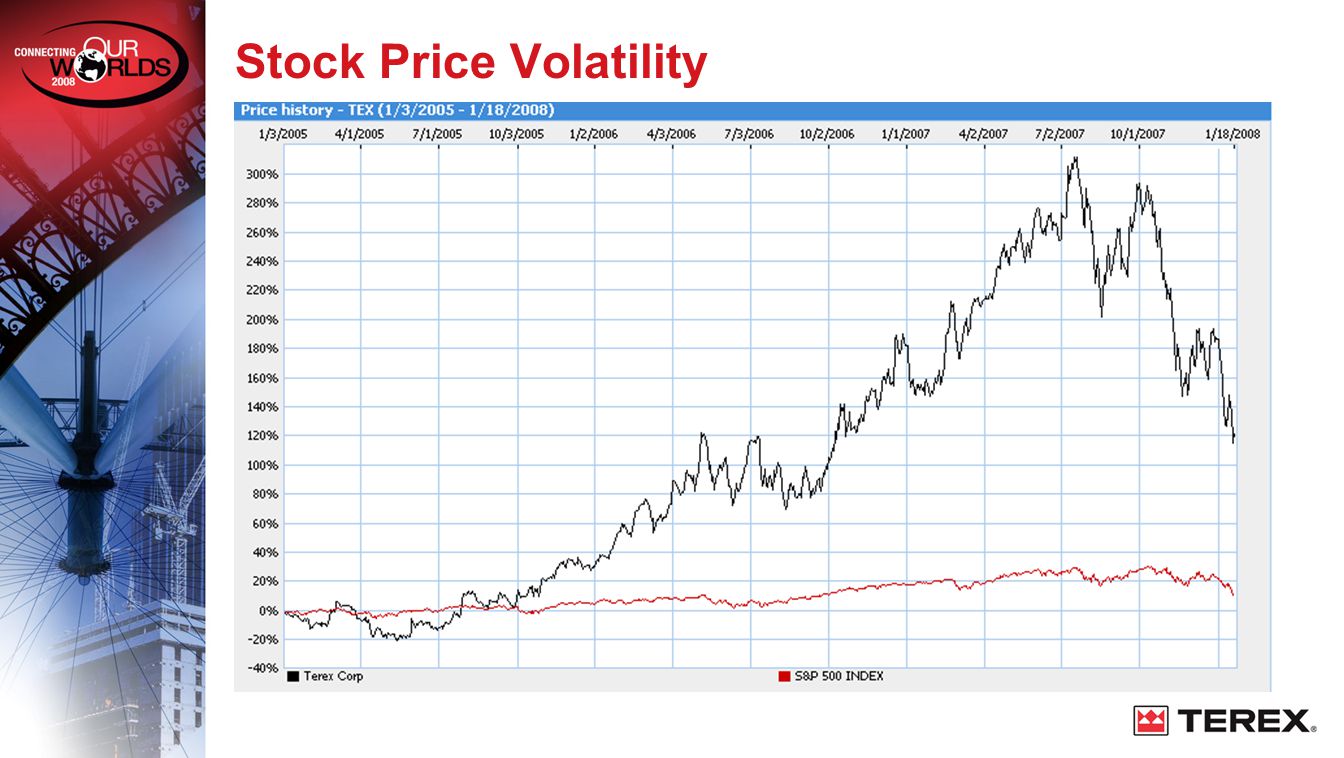
3 Stock Price Volatility

5
Strong Performance Continues 3Q 2007 YTD Sales17% Operating Profit34% Earnings Per Share46% Return on Invested Capital42% Working Capital / Annualized Sales23%

6
Trading Value Does Not Reflect Performance Low High

7
Stock Price Volatility - External Factors U.S. Residential Construction Slowdown Credit Tightening Recession Brewing Is Europe “Topping Out”? Momentum investors – Quantitative triggers Impact of slowing U.S. on rest of world?

8
How do we differentiate ourselves in this environment? Sales > 60% outside U.S. Backlog at record levels Emerging markets require significant infrastructure development - driving demand for MPM & Cranes, in particular Internal initiatives provide opportunities that are not as market dependant

9
Stock Price Volatility We have not changed our message: 12 x 12 in 2010 We must manage in response to external factors Watch customer credit – extending terms Order deliveries rescheduled Order intake/quotation activity weakening Tighter terms (recourse guarantees) from Financing partners Adjust cost base accordingly Executing our plans effectively will differentiate us
 from Financing partners Adjust cost base accordingly Executing our plans effectively will differentiate us")
10
Achieving our 12 x 12 in ’10 Goal Supply management savings Effective emerging and home market approach Quickly integrate and realize benefits from acquisitions Talent development and talent acquisition to execute key initiatives Major “order to cash” process improvement => productivity Increase velocity Minimize waste Supply management savings Effective emerging and home market approach Quickly integrate and realize benefits from acquisitions Talent development and talent acquisition to execute key initiatives Major “order to cash” process improvement => productivity Increase velocity Minimize waste How?

11
11 2007 High Level Assessment

14
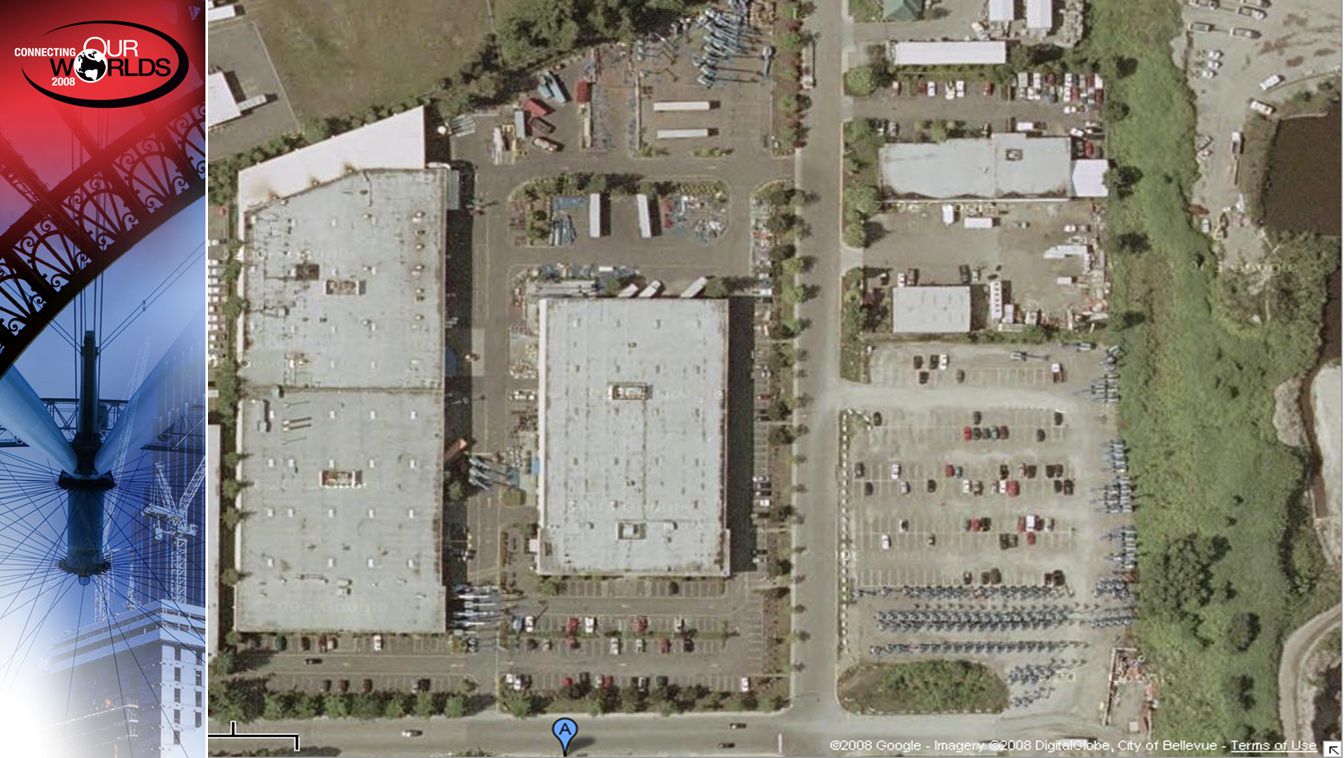
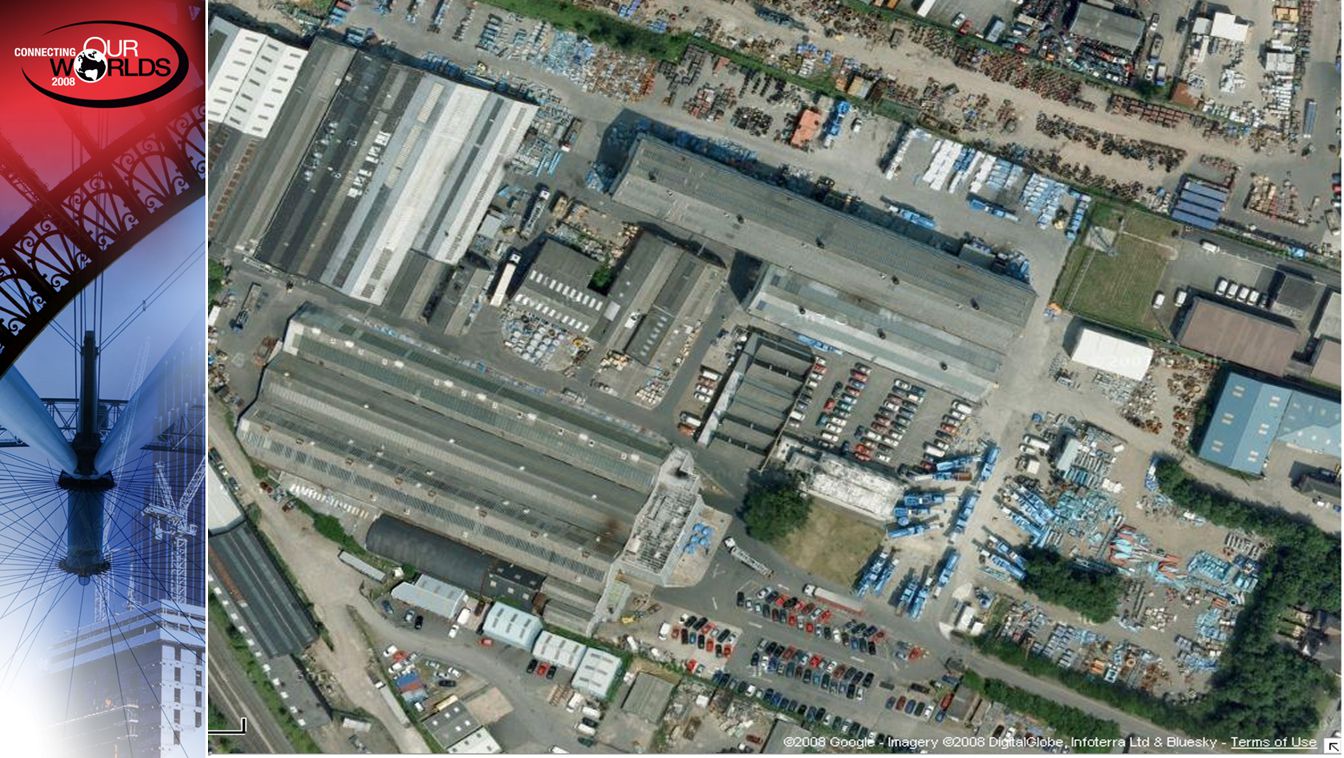
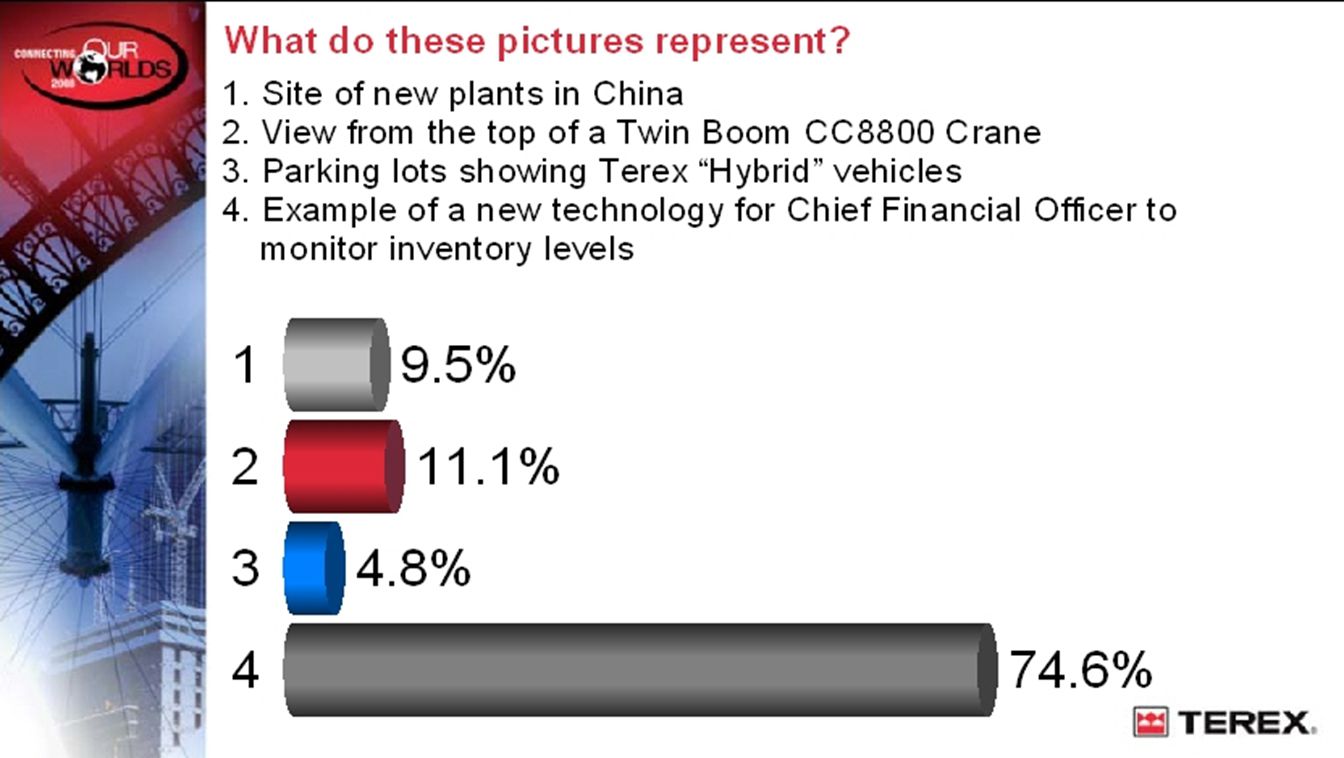
What do these pictures represent? 1.Site of new plants in China 2.View from the top of a Twin Boom CC8800 Crane 3.Parking lots showing Terex “Hybrid” vehicles 4.Example of a new technology for Chief Financial Officer to monitor inventory levels

16
Financial Performance - 9/30/07

17
Working Capital 2007 Expense Control - 9/30/07

18
Which segment improved their Working Capital to Sales % versus Budget and 2006? 1.AWP 2.Construction 3.Cranes 4.Material Processing & Mining 5.Roadbuilding & Utility

20
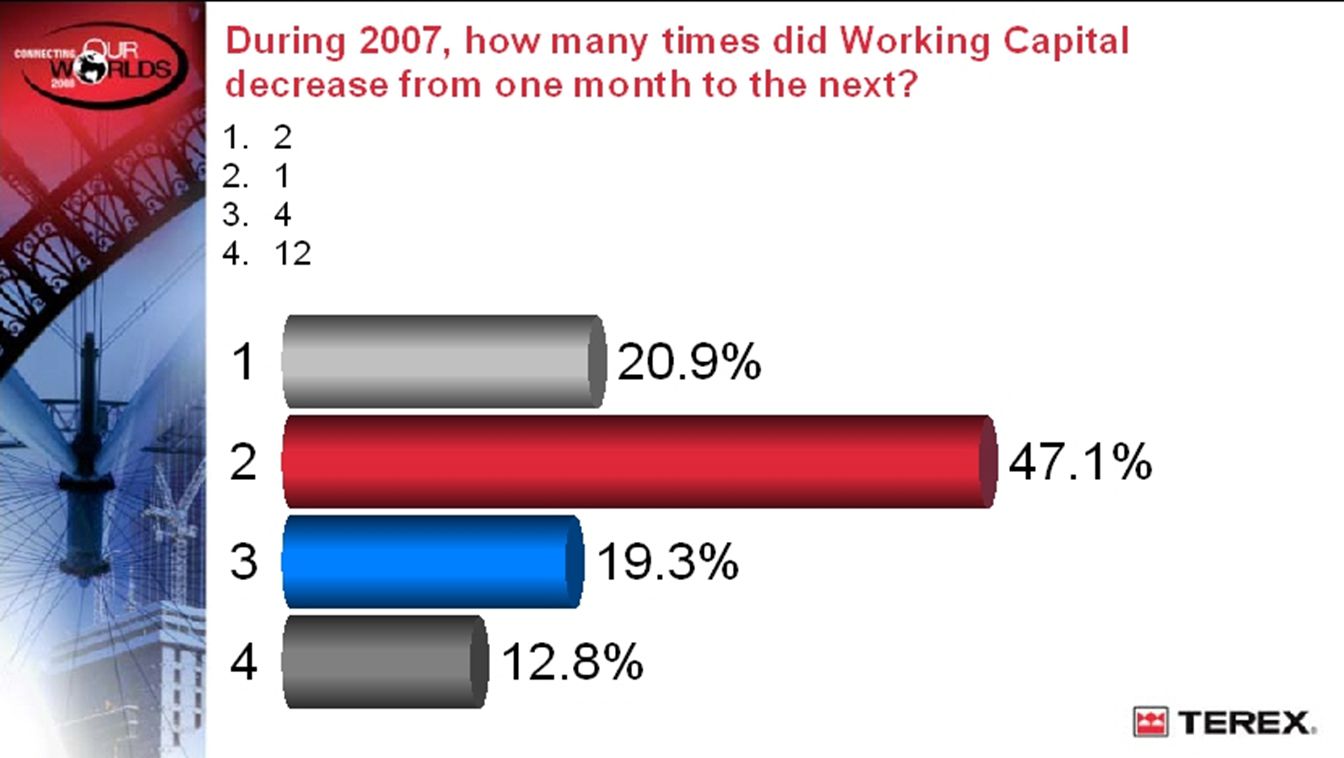
During 2007, how many times did Working Capital decrease from one month to the next? 1.2 2.1 3.4 4.12

22
22 Return on Invested Capital

23
Operating Profit Invested Capital Our Measure of Shareholder Value As of 3Q 2007 ROIC = 42% Last 4 quarters Operating Profit / average last 4 quarters Invested Capital 2006 2007 2006 2007

24
Invested Capital Impacted Through - Faster collection of receivables Increased velocity of inventory Selling idle or slow moving assets Capital expenditures in high return projects Securing advance payments from Customers (Total Assets – Cash) – (Total Liabilities – Debt)
 – (Total Liabilities – Debt)")
25
Average Invested Capital was $300 million higher than budget. What was the most significant reason? 1.Debt increased by $800 million in 4Q 2.Average inventory was higher than Plan 3.Stock price was low so we repurchased shares 4.Purchased Superior Highwall in 4Q for $140 million

27
27 ROIC AFTER TAX

28
Our Measure of Shareholder Value in 2008 Operating Profit x (1 - Effective Tax Rate) Average Invested Capital More aligned to shareholder expectations Significant opportunity to deliver value exists Requires coordinated effort to maximize opportunity
 Average Invested Capital More aligned to shareholder expectations Significant opportunity to deliver value exists Requires coordinated effort to maximize opportunity")
29
Effective Tax Rate Net income as % of profit before tax (“PBT”) 36% 29% 28% 27% 27% 22% 18% 17% 45% 55% 65% 75% 85% 95% 100% 64% 71% 72% 73% 78% 82% 83% Terex CATKMTUTXDHR PKI IR ETN 0% Swiss Ruling Bermuda Inversion w/ Irish Entrepreneur “Big bang’” Switzerland 5% Singapore Ruling To increase shareholder value we should … … keep more of the income we generate
 36% 29% 28% 27% 27% 22% 18% 17% 45% 55% 65% 75% 85% 95% 100% 64% 71% 72% 73% 78% 82% 83% Terex CATKMTUTXDHR PKI IR ETN 0% Swiss Ruling Bermuda Inversion w/ Irish Entrepreneur Big bang’ Switzerland 5% Singapore Ruling To increase shareholder value we should … … keep more of the income we generate")
30
36% 2% 3% 6% 25% 2006 Effective Tax Rate Statutory Tax Rate Reduction Traditional tax planning & execution OATSStretch Effective Tax Rate Tax rate reduction comes from several sources … OATS are most significant

31
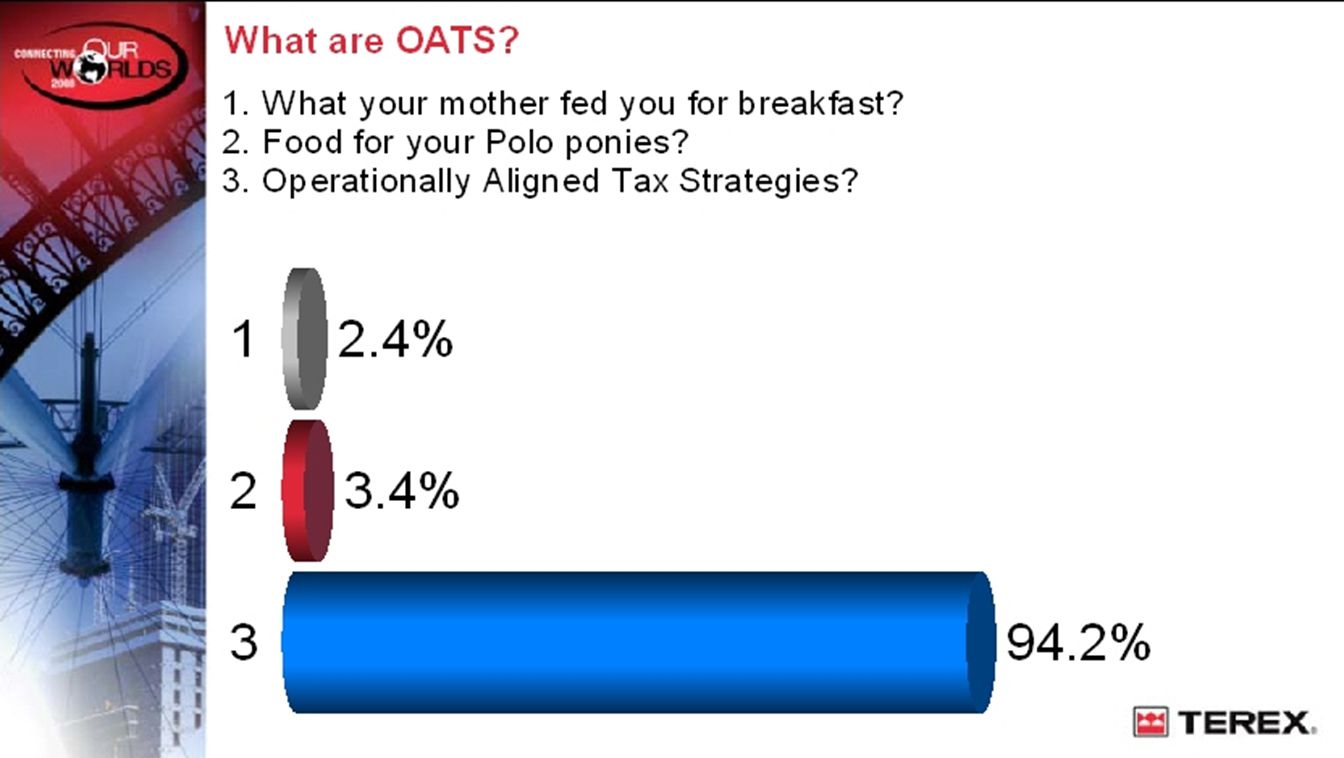
What are OATS? 1.What your mother fed you for breakfast? 2.Food for your Polo ponies? 3.Operationally Aligned Tax Strategies?

33
TREC Synergistic Combination of OATS Limited Risk Distributor Toll Manufacturing Time and Connectivity Income Tax Benefit Low High Intangibles Management Integrated Intangibles Management Aftermarket Distribution Contract Manufacturing Procurement Strategic Sourcing Commissionaire Sales Field Service & Training Warranty Management Integrated Customer Portal One Face To Customers & Suppliers Terex Financial Services Engineering Shared Service Center(s) TBS Production Planning Quality Control OATS success requires individual actions … …the whole is greater than the sum of the parts
 TBS Production Planning Quality Control OATS success requires individual actions … …the whole is greater than the sum of the parts")
34
OATS expand cash flow and Earnings Per Share... wealth effect grows our business! Tax Savings $M $430M income $21 Share price increase $2B in shareholder wealth $20M $35M $53M $76M $105M $141M 2007200820092010201120122013 36% 34% 33% 32% 31% 30% 29% Effective Tax Rate Tax Savings Effective Tax Rate 36% $140 $120 $100 $80 $60 $40 $20 34% 32% 30% 28%

35
35 BUSINESS PRACTICES

36
Business Practice awareness has improved, however Customer issues are still the most challenging Transparency – need ALL the FACTS Risk of loss not transferred Lack of documentation Cultural differences Transaction changes after original agreement Lack of “process” documentation leads to inconsistency Your vigilance reinforces proper behavior

37
Your Efforts Make a Difference Operational performance will differentiate us – Stock Rapid growth strains our capabilities – Root Cause Internal initiatives deliver results - Execution Return on Invested Capital – INVENTORY! Return on Invested Capital After Tax – OATS Business Practice vigilance – or the rest doesn’t matter Thank You!!!!!

Similar presentations


. WACC What precisely do the terms “cost of capital” and “weighted average cost of capital” mean? To begin,>")


