Download presentation
Presentation is loading. Please wait.

1
Benasque: Alan Watson 18 March, Lecture 3 1

2
2

3
3 Spectrum measured by different method using inclined shower 60 < θ < 80 ° submitted for publication

4
4

5
5 However the steepening itself is INSUFFICIENT for us to claim that we have seen the Greisen-Zatsepin-Kuz’min Effect Steepening is significant at 6 sigma level – and up-date is even stronger It might simply be that the sources cannot raise particles to energies as high as 10 20 eV – Nature could be teasing us! It would be enormously helpful if the arrival directions were anisotropic Also knowing the mass composition would be useful

6
Does the steepening mark the limit that the accelerators can reach – or is it the GZK effect? What are the accelerators? Synchrotron Acceleration E max = ZeBR c Single Shot Acceleration E max = ZeBR c Diffusive Shock Acceleration E max = kZeBR c, with k<1 6

7
7 Diffusive Shock Acceleration E max = kZeBR c, with k<1 (e.g. Shocks near AGNs, near Black Holes, Supernova……?) SN1006 Hillas 1990
 SN1006 Hillas")
8
Ultra High Energy Cosmic Rays are difficult to accelerate (i)Diffusive Shock Acceleration may not work (Hillas diagram - next) (ii) Greisen’s argument (1965) (i) accelerator > Larmor radius (ii) synchrotron losses < Energy Gain W magnetic > 300Γ 5 ergs, so for 10 20 eV, W magnetic > 10 57 ergs 8
Diffusive Shock Acceleration may not work (Hillas diagram - next) (ii) Greisen’s argument (1965) (i) accelerator > Larmor radius (ii) synchrotron losses < Energy Gain W magnetic > 300Γ 5 ergs, so for eV, W magnetic > ergs 8")
9
9 Hillas 1984 ARA&A B vs R B R E max = kZeBRβc k < 1 Synchrotron Losses Colliding Galaxies Magnetars

10
10 Decided to use catalogue of galaxies like this and see if they lined up with the directions of our event image of M87 with Hubble Space Telescope Active Galactic Nuclei

11
11 Science: 9 November 2007 First scan gave ψ 56 EeV

12
12

13
13 Correlation has fallen from ~ 68% to ~ 28% (2007 –> 2014) compared with 21% for isotropy: about 1.4% probablity Cen A may be a source: in 13º circle around: 12 seen/1.7 A clear message from the Pierre Auger Observatory:- We made it too small (2 per month at energy of interest)
 compared with 21% for isotropy: about 1.4% probablity Cen A may be a source: in 13º circle around: 12 seen/1.7 A clear message from the Pierre Auger Observatory:- We made it too small (2 per month at energy of interest)")
14
Hot Spot from Telescope Array: E > 57 EeV 20 0 smoothing BackgroundSignificance The 72 events 14

15
15 Broad anisotropy search in right ascension

16
16 Recently the Santiago group have completed analysis of inclined events above 4 EeV and the addition of 30% more data has (i)given a broader sky coverage and (ii)improved the significance of the largest energy bin Note that the phase is in good agreement with previous work Latest News (Astrophysical Journal to be published)
given a broader sky coverage and (ii)improved the significance of the largest energy bin Note that the phase is in good agreement with previous work Latest News (Astrophysical Journal to be published)")
17
17

18
18 An anisotropy implies that the energy spectrum changes across the sky Result, to be shown in summer conferences (Ioana Maris – Granada)
")
19
19 To interpret these arrival direction data a crucial question is “What is the mass of the cosmic ray primaries at the highest energies?” Answer is dependent on unknown hadronic interaction physics at energies up to ~ 30 times CM energy at LHC In particular, cross-section, inelasticity and multiplicity Here is an important link between particle physics and astroparticle physics

20
20 photons protons Fe Data log (Energy) X max How we try to infer the variation of mass with energy Energy per nucleon is crucial Need to assume a model < 1% above 10 EeV dX max /log E = elongation rate
 X max How we try to infer the variation of mass with energy Energy per nucleon is crucial Need to assume a model < 1% above 10 EeV dX max /log E = elongation rate")
21
21 Some Longitudinal Profiles measured with Auger rms uncertainty in X max < 20 g cm -2 from stereo-measurements 1000 g cm -2 = 1 Atmosphere ~ 1000 mb

22
19759 events above 6 x 10 17 eV 22 Distribution of X max as function of energy PRD 90 1220005 2014

23
23

24
“We remain with the dilemma: protons versus heavy nuclei. A clear cut decision cannot be reached yet. I believe that up to the highest energies the protons are the most abundant in the primary cosmic rays. However, I must confess that a leak proof test of the protonic nature of the primaries at the highest energies does not exist. This is a very important problem. Experimentally it is quite a difficult problem.” G Cocconi: Fifth International Cosmic Ray Conference, Guanajuato, Mexico, 1955 Question of Mass Composition “Fere libenter homines id, quod volunt, credunt!” 24

25
25 Detailed study of X max distributions are required

26
26 Auger Interpretation: Phys Rev D 90 1222006 2014 (arXiv 1409.5083) 3768 165 37
")
27
27 Recent Result from TA: arXiv 1408.1726 822 events

28
28 TA analysis using Auger Mass Composition

29
The conclusions on the mass are dependent on assumptions about the particle physics at energies well-beyond anything that will be reached by man-made accelerators However small fraction of protons may be present and is needed to explain the anisotropy seen Searching for protons at highest energy is an important feature of future plans for the Observatory 29

30
1 km, 22° 1 km, 80°: ~ 5000 g cm -2 37 stations 69 stations 30 Using inclined showers

31
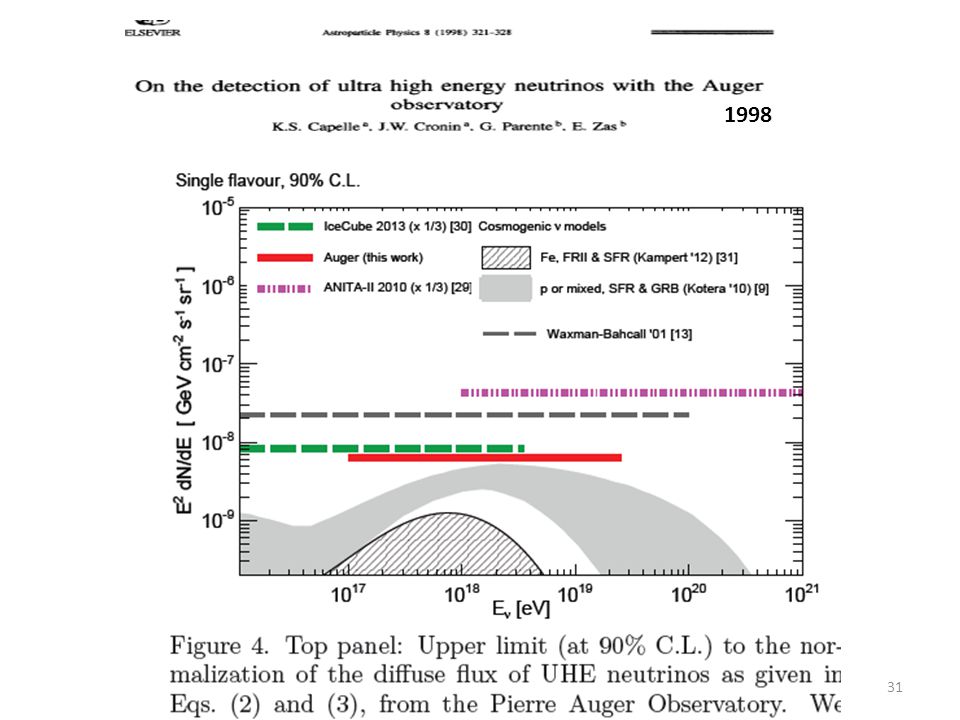
31 1998
32
32 Hadronic Interactions Some demonstrations of problems

33
33 d’Enterria, Engel, Pierog, Ostapchenko and Werner (2011)
")
34
We find that there are problems with models at high energies and large angles where muon numberin showers can be measured can be fairly readily explained Summary of following papers:- Inclined Reconstruction: JCAP 08 019 2014 Inclined Muon Number: arXiv 1408.1421 MPD paper: Phys Rev D 90 (2014) 012012 34 Inclined showers are proving very useful to test models
 Inclined showers are proving very useful to test models")
35
37 stations 71° 54 EeV Fit made to density distribution Energy measured with ~20 % accuracy 35

36
36

37
37

38
Muon numbers predicted by models are under-estimated by 30 to 80% (20% systematic) 38
 38")
39
39

40
log (E/eV) = 19.5 40 Second method of testing models: Muon Production Depth (MPD)
 = Second method of testing models: Muon Production Depth (MPD)")
41
91 EeV 33 EeV 41

42
42

43
43 How can we interpret the data at all energies? There are many interpretations – an indication of how weakly constraining the data are – particularly at the highest energies Models range across ALL particles from Cen A above a few from galaxy at low energies (Biermann and de Souza) All produced in GRB within our galaxy 10 5 years ago (Calvez et al) Succession of different sources in different energy ranges
 All produced in GRB within our galaxy 10 5 years ago (Calvez et al) Succession of different sources in different energy ranges.")
44
44 Taylor, arXiv:1107.2055

45
45

46
46 Model of successive Peter’s Cycles Gaisser ApJ 35 801 2012 Gaisser, Stanev and Tilav Front. Phys 8 (6) 748 2013 Rigidity, R = Pc/Ze, where P is the momentum
 Rigidity, R = Pc/Ze, where P is the momentum.")
47
47

48
48

49
49

50
50 The Future for the Auger Observatory

51
51 Puzzles: Large number of protons near ankle but low anisotropy suggests that they must be extragalactic (phase plot) Protons diminish around 10 EeV and helium becomes more dominant Protons needed to explain anisotropy (AGN and Cen A correlations) at highest energies SO: NEED TO KNOW MORE ABOUT THE MASS Must measure muons Proposal is to augment water-Cherenkov detectors by scintillators and to get muon component by subtraction
 Protons diminish around 10 EeV and helium becomes more dominant Protons needed to explain anisotropy (AGN and Cen A correlations) at highest energies SO: NEED TO KNOW MORE ABOUT THE MASS Must measure muons Proposal is to augment water-Cherenkov detectors by scintillators and to get muon component by subtraction")
52
52 But we clearly need more exposure at the highest energies Hope had been that JEM-EUSO would succeed establish sources and neutrinos Then case for huge array(s) on ground might be made Presently the EUSO program is delayed EUSO – Extreme Universe Space Observatory that was proposed to ESA as a free-flyer Fluorescence Detector in Space
 on ground might be made Presently the EUSO program is delayed EUSO – Extreme Universe Space Observatory that was proposed to ESA as a free-flyer Fluorescence Detector in Space")
53
53

54
54

55
55

56
56 JAXA finally (late 2013) – despite strong pressure from NASA and ESA - decided against JEM-EUSO However the collaboration is still alive:- Project had a successful balloon flight last year and is now proceeding on two fronts 1.Many of the Collaboration have joined forces with the Russians 2. US Groups proceeding towards long-duration balloon flight and then to free-flyer

57
57 The test flight in 2014 went well From Timmins in Canada Plane below balloon with Xenon laser to produce artificial showers Spanish IR camera (for clouds etc) worked well No reconstructions yet reported
 worked well No reconstructions yet reported")
58
58. US groups (PI Angela Olinto) working towards LDF from New Zealand with NASA Super-Pressure balloon 2 – 4 week flight Long enough to observe showers from above March 2016 – 2017 Then aim would be for a free-flyer
 working towards LDF from New Zealand with NASA Super-Pressure balloon 2 – 4 week flight Long enough to observe showers from above March 2016 – 2017 Then aim would be for a free-flyer.")
59
59 Japanese and Europeans have joined forces with Russians European Leader: Piergiorgio Picozza

60
60

61
61 Summary We have hugely better data than 10 years ago at all energies – leading to improved ideas about sources At low energies AMS will continue and ISS-CREAM will extend spectrum of directly-measured particles to close to 1 PeV In the knee region the KASCADE and KASCADE-Grande data may be reanalysed with more modern models. Other projects such as LHASSO in China will increase data Plans for UHECR in the very long term depend on success of Auger phase II and fluorescence detection, possibly from K-EUSO

Similar presentations


 Pierre Sokolsky University of Utah.>")

 Conclusions Isola.>")

 Alan Watson University of Leeds>")

