Download presentation
Presentation is loading. Please wait.

1
Monitoring & Feedback Control

2
Monitoring & Feedback Learning Activities View Slides;
Read Notes, Listen to lecture Do on-line workbook Lesson Objectives When you finish this lesson you will understand: Monitoring and control of power circuits Review of sensor techniques Sensing for weld quality Keywords Monitoring, Feedback Control, Force Gage, Piezoelectric Gage, Voltage, Manganen Shunt, Meter Calibration, Rogowski Coil, Hall Effect Transducer, Power Factor Monitoring, Automatic Voltage Control, Current Regulation, Constant Current, Nugget Expansion, Optical Fringe Sensor, Dynamic Resistance, Dynamic Power Factor, Current Stepper, Acoustic Emission, Ultrasonic, Direct Temperature, Infrared

3
Sensors for Monitoring
Control of Welder Control of Weld Quality

4
Electrode Force Gage

7
Secondary Current Shunts
Must have geometry - no skin effect HF problems Return Conductors not Couple with Magnetic Field Sometime high weight for robotics Not completely secondary impedance non-intrusive

8
Meter Calibration

9
Can not use: IRMS = 0.707 Ipeak
Androvich “Resistance Welding Constant Current Heat Control”, AWS Sheet Metal ConfV, 1992

10
Non-ferromagnetic Material In Core
No Saturation

11
X-Ray Bowling, DeLeon, Pietsch, Senior Project report, 1999

12
Rogowski Coils Are: Extremely Amplitude-Linear Devices Not Frequency Sensitive (good Coils have 8 Octaves) Position Sensitive (Coil Winding Imperfections) Sensitive to Return Conductor Position
 Sensitive to Return Conductor Position.")
14
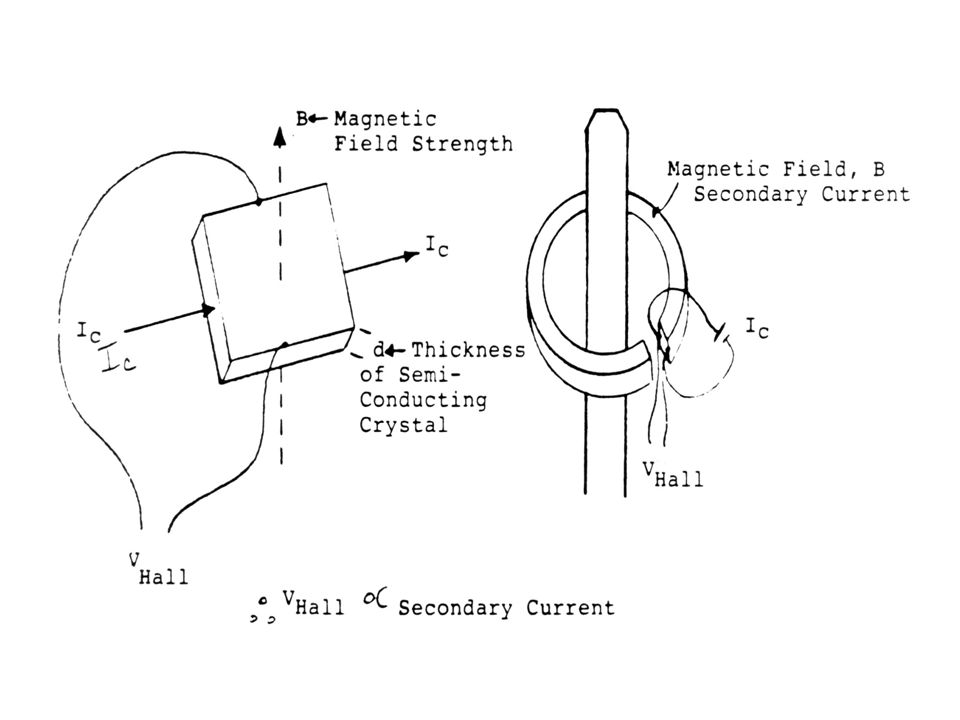
Hall Effect Devices Are:
Very Position Sensitive Temperature Sensitive Proportional to Current not Rate of Change Can Use on 3 phase Sensitive to Location of Return Conductors

15
Current Transformers

16
Secondary Impedance Measurements

17
Current Through &Voltage Across Primary
Power Factor: Current Through &Voltage Across Primary

19
Control of Welder Automatic Voltage Control (AVC) Current Regulation Constant Current
 Current Regulation Constant Current")
20
Androvich “Resistance Welding Constant Current Heat Control”,
AWS Sheet Metal ConfV, 1992

21
AVC Heat Control (constant voltage)
Compensates for primary voltage changes Act. % Avail Current = [Act. Volt/Set Volt] x Programmed % Current AVC: Holds Prim & Sec Voltage Constant on a 1/2 cycle basis Changes total available current based on voltage changes Does not compensate correctly for change in sec Resistance or Impedance Usually has current pick up coil to alarm problems Androvich “Resistance Welding Constant Current Heat Control”, AWS Sheet Metal ConfV, 1992

22
Current Regulation Heat Control
Uses Current Pick-up Coil & Analog Feedback Circuit Requires variable gain, reset, dead band, that effect current output Normally requires 3 to 5 cycles to stabilize Therefore, used mostly with seam welding not spot welding Androvich “Resistance Welding Constant Current Heat Control”, AWS Sheet Metal ConfV, 1992

23
Constant Current Heat Control
Program Controller Directly in Secondary Amperes, then controller holds secondary current within +/- 1% Controller Needs to Perform: Digital Sampling of Primary and Secondary Current or Use Turns Ratio to Calculate Secondary Calculate RMS Current on 1/2 cycle basis Respond to process changes on 1/2 cycle basis (Use Predictive Feedback) Self teach relationship between current and % available current Primary benefit is its ability to compensate for changes in secondary impedance Androvich “Resistance Welding Constant Current Heat Control”, AWS Sheet Metal ConfV, 1992
 Self teach relationship between current and % available current. Primary benefit is its ability to compensate for changes in secondary impedance. Androvich Resistance Welding Constant Current Heat Control , AWS Sheet Metal ConfV,")
24
Predictive Feedback Use Large Firing Angle (small current) for first 1/2 cycle Read results of current Calculate a ratio between % available current and actual Predict where to fire the next 1/2 cycle using tables

25
Androvich “Resistance Welding Constant Current Heat Control”,
AWS Sheet Metal ConfV, 1992

26
Lower Resistance Note: an increase in primary voltage is required to overcome the increase in secondary resistance Longer Fire Angle Higher Resistance Shorter Fire Angle Androvich “Resistance Welding Constant Current Heat Control”, AWS Sheet Metal ConfV, 1992

27
Benefit Extends to Seam Welding Also
Longitudinal Seam welders have large, deep secondary , and inductance changes as more ferromagnetic material goes into throat. Circumferential seam welders have short, small secondary with constant inductance Constant Current Adjusts Cuff, Seam Welding with Constant Current Controls Welding Journal, Sept 1998

28
Control of Weld Quality

29
Secondary Monitoring

32
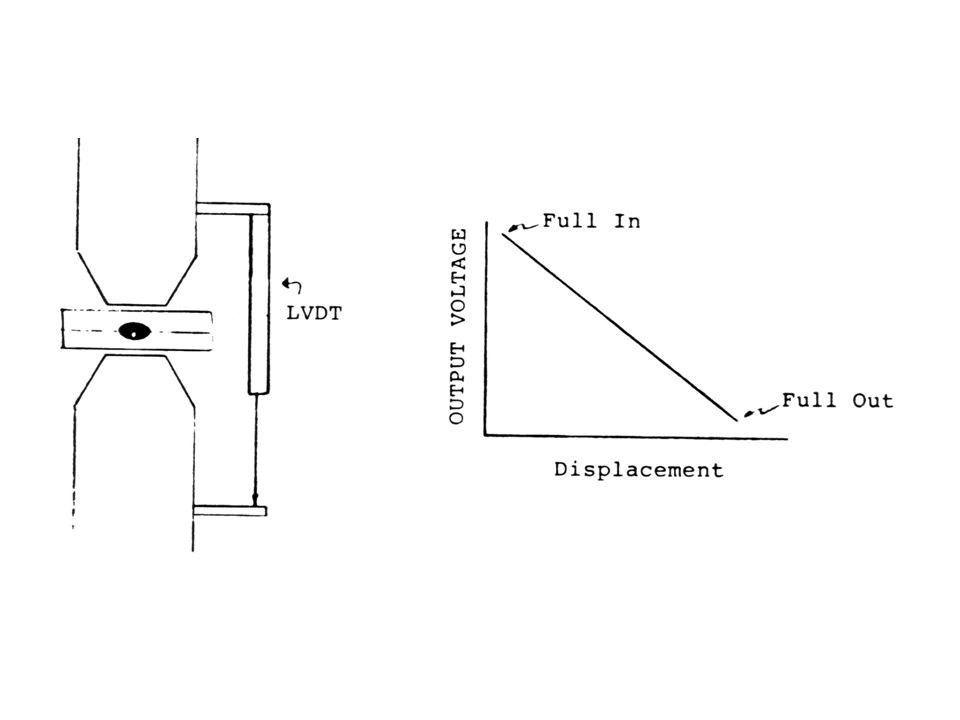
Monitor systems based upon thermal expansion of the weld nugget and surrounding material during heating and melting have also been developed. This thermal expansion causes electrode separation during spot weld production which can be monitored by a displacement transducer attached to the movable welding electrode. A typical trace obtained is illustrated in the above figure. A weld made with too high a heat input has rapid expansion characteristics and expulsion resulting in rapid electrode closing. A monitor system based on this rapid electrode motion has been proposed. In some cases, this may be acceptable. However, expulsion welds are generally considered substandard. A weld made with too low a heat input has slow expansion and does not attain full electrode separation. A weld made with correct heat settings has an intermediate expansion rate and obtains a maximum electrode separation, as illustrated in the above figure. A weld tolerance range for acceptable spot welds has been established. Additional studies at the Welding Institute, however, have indicated that using the maximum displacement may lead to lack of discrimination. To overcome this, they suggest the measurement of expansion rate in the initial portion ( 25%) of the weld cycle. If the initial expansion rate were in the correct range, welds would be completed after a preset weld time. Any other expansion rate would signal a defective weld. This procedure does not account for variable sheet thickness..
 of the weld cycle. If the initial expansion rate were in the correct range, welds would be completed after a preset weld time. Any other expansion rate would signal a defective weld. This procedure does not account for variable sheet thickness..")
33
Actual measurement under control situations are presented in this figure. Note the expansion during heating and melting and the contraction after the current stops during the solidification and cooling. Tsai, Experimental Study of Weld Nugget Expan, Paper B1, Sheet Metal Welding Conf V, AWS, 1992

34
4 Cycle 12 Cycle 6 Cycle 14 Cycle 16 Cycle 8 Cycle 22 Cycle 10 Cycle
Tsai, Experimental Study of Weld Nugget Expan, Paper B1, Sheet Metal Welding Conf V, AWS, 1992

35
9.8 ka 12.2 ka 10.8 ka 13.8 ka 14.0 ka Tsai, Experimental Study of Weld Nugget Expan, Paper B1, Sheet Metal Welding Conf V, AWS, 1992

36
Real Time Equipment Arrangement
Power Supply Strain Gage Signal Conditioner Oscilloscope Voltage Leads Print Displacement Transducer Isolation Box Data Recorder Tap Integration

37
Dynamic Resistance = Voltage/Current

38
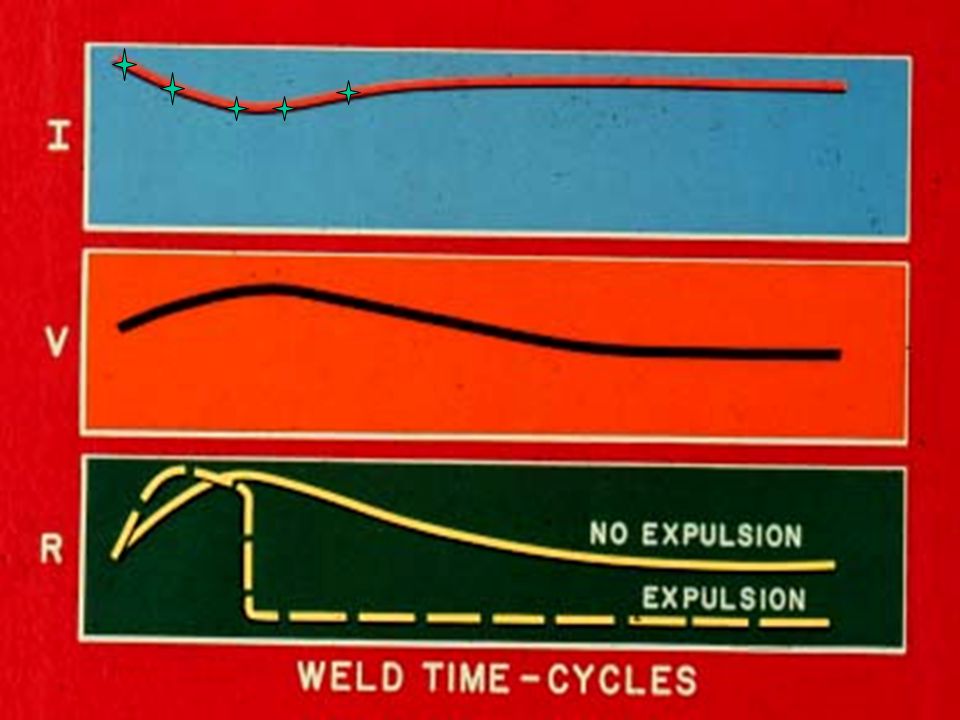
The measurement of electrical parameters as monitoring signals has received the bulk of the spot weld monitoring attention. Values which can be monitored include voltage, current, and time. From these values, dynamic resistant power (p = ei cos ), and energy (E = Pdt) can be calculated. Voltage measurements are obtained by attaching voltage probes to the top surface and bottom surface of the materials to be welded or to the upper and lower electrode to obtain a voltage trace.

39
V Current Voltage Two Points per Cycle (+ & - 1/2 cycles)
")
41
Liang, “Fundamental Study of Contact Behavior in RSW”
OSU Dissertation, 2000

42
One difficulty in the universal application of this system to all materials is that the dynamic resistance curves vary for different classes of material. The variation in curve shape has been related by one author to the rate of surface breakdown. Alloys having tenacious oxide layers would show initial high resistance which falls as the oxide breaks down. Those alloys having good initial surface contact (such as the galvanized materials) show initial low resistance values increasing as the material heats. For this reason, the use of this control model has been thought to be restricted to plain carbon and high-strength low-alloy steels. However, some recent work has shown some promise in using this system on the zinc-coated and aluminum-coated steels. Dickinson, Welding in Auto Industry, AISI, 1981

43
Considerable changes in resistant (or impedance) occurs during the spot welding of mild steel as illustrated. This curve has been represented to have five separate stages, as illustrated in the above figure, and an interpretation for the typical shape of this dynamic resistance curve is proposed based upon these stages as described below: Stage I - The workpieces are brought into contact under the pressure provided by the electrode force. This creates areas of electrical contact at the points where asperities on the surfaces meet. Voltage is applied between the electrodes, causing current to flow at the microcontact points. The resistance between electrodes at this point is equal to the sum of the bulk resistance of the two workpieces, the two electrode-to-work contact resistances, and the work-to-work contact resistance. Under normal conditions, surface films, oxide layers, or other contaminants will be present on the workpieces. Since these are essentially insulators, the initial contact resistance will be very high. Therefore, the initial generation of heat will be concentrated at the surfaces, especially at the work-to-work contacts. This heat will cause the surface contaminants to break down, resulting in a very sharp drop in resistance. Dickinson, Characterization of Spot Weld..” Welding Journal, 1980

44
continued Stage II - Immediately after the breakdown of surface contaminants, metal-to-metal contact exists. However, the surface resistance may still remain relatively high due to the limited area for current flow provided by the asperity contacts. Heating then is concentrated at the work-to-work surface, and temperature in this region and in the bulk material will increase. As heating progresses, the asperities soften and the contact area increases, thus causing resistance to decrease. At the same time, increasing temperature results in increasing resistivity, thus providing an opposite effect. The competition between two mechanisms determines whether resistance in increasing or decreasing, and thus determines the position of the minimum. Eventually, the increase in contact area will be overcome by the increasing temperature effect, and the total resistance will begin to rise.

45
Stage III - During this period, the increase in resistivity resulting from increasing temperature dominates the resistance curve. The end of Stage III should correspond to local melting beginning to occur at the asperity contacts. The transition to Stage IV will probably occur near the inflection point in the curve (d2R/dt2 = 0). Stage IV - Three mechanisms influence Stage IV. The bulk of the workpieces continue to increase in temperature, thus causing resistivity and resistance to increase. But, the heat being generated also causes additional melting to occur at the surfaces, increasing the size of the molten region and the cross-sectional area available for current flow. This mechanism causes a resistance decrease. Also, increased softening will result in some mechanical collapse, shortening the path for current flow and decreasing resistance. The peak is a consequence of the temperature beginning to stabilize, while nugget growth and mechanical collapse begin to dominate, and therefore resistance starts to decrease. Stage V - Beyond the peak, the growth of the molten nugget and mechanical collapse continue to cause resistance to decrease. If the nugget grows to a size such that it can no longer be contained by the surrounding solid metal under the compressive electrode force, expulsion will occur.

46
The shape of the dynamic resistance curve has also been related to position on the weldability lobe curve by several authors. This is an important observation and demonstrates that the dynamic resistance curve shape is relevant to today’s automotive spot weldability criteria. Dickinson, Welding in Auto Industry, AISI, 1981

47
Expulsion Interfacial Expulsion Surface Expulsion Excessive Current
Excessive Time Surface Expulsion Excessive Current Low Force Dirty Material Poor Fit-up Worn Electrodes

48
Dynamic Power Factor Monitoring
Power Factor = Cos = 100% if pure Resistive = 0% if pure Reactive Reactance is basically fixed; Changes only if size or shape of secondary changes So Dynamic Changes in Resistance Result in Dynamic PF Changes

49
Power Factor Can Be Measured at Controller, No Wires at Electrode Needed
} } = Negative Half Cycle + = Positive Half Cycle Count # of Expulsions Per 25 Welds Boilard, “Automatic Current Steppers for Improved Weld Quality” AWS Sheet Metal Welding Conf. V, 1992

50
Automatic Current Stepper Based on Dynamic Power Factor
If 5 Expulsions/25 Welds Current Decrease 1% If No Expulsion Current Increase 1%

51
During the production of an electric resistance spot weld, the material heated undergoes several different stages, including expansion (and resulting stress buildup), recrystallization, solid-state transformations, plastic deformation (forging), melting, vaporization, solidification, and sometimes cracking. Each of these stages can emit stress waves which can be detected as acoustical emissions. These signals are measured by a piezoelectric transducer mounted on the welding machine, as illustrated in the above figure. The amplitude of the stress waves may be quite high. Havens “Controllin Spot Welding Quality and Expulsion” SME Paper AD

52
A typical signature of acoustic emission waves developed during spot welding is presented in the above figure. The largest signals are present at the weld start and at expulsion. By appropriate gating networks, it is possible to isolate the expulsion peak and use that as a controlling parameter. That is, with proper feedback controls, the weld can be terminated at the initiation of expulsion. The weld current is selected and the weld is terminated at a weld time when expulsion is observed. Note that this procedure saves energy and reduces electrode mushrooming, as a result of lower electrode heating, when compared to weld termination at a typical point. Havens “Controllin Spot Welding Quality and Expulsion” SME Paper AD

53
As the spot weld nugget grows, it heats the surrounding metal
As the spot weld nugget grows, it heats the surrounding metal. Based upon fairly rigorous calculations, the surface temperature can be related to the maximum nugget temperature at the nugget center. Therefore, temperature sensing of the heated surface has been used to monitor nugget growth. Several methods have been employed to measure the temperature of the spot weld. These methods are discussed below. Some of the earliest methods were to mount thermocouples on the workpiece or electrode and use these devices to sense temperature change. Because of the difficulties with thermocouple and extra wires, this technique is not acceptable for production. Additionally, the electrode temperature is dependent upon current level (power level) and weld time, each of which cause variations in electrode temperature gradients which make control difficult. A second system to monitor nugget temperature is based upon the infrared radiation emitted from the metal surface near the nugget. One method of observing this radiation is through an aperture in the welding electrode. The radiation can be detected either directly or after transmission through a light guide. Bhattacharya “Temp Measurement of Resistance Spot Welds” Welding & Metal Fabrication, Nov 1969
 and weld time, each of which cause variations in electrode temperature gradients which make control difficult. A second system to monitor nugget temperature is based upon the infrared radiation emitted from the metal surface near the nugget. One method of observing this radiation is through an aperture in the welding electrode. The radiation can be detected either directly or after transmission through a light guide. Bhattacharya Temp Measurement of Resistance Spot Welds Welding & Metal Fabrication, Nov")
54
A second method is to sense this radiation in an annular region some distance from the electrode contact edge, as illustrated in the above figure. The amplitude of the detector trace from small nuggets was low and these nuggets exhibited low shear loads. The trace amplitude for acceptable nuggets was intermediate, while a large trace amplitude was observed for expulsion welds. All infrared techniques suffer from the disadvantage that dirt and fumes may cause spurious results and that surface oxides may cause variations in surface infrared emissivity. The awkwardness of the placement of the sensors in the electrode or near the weld zone has also caused concern. Because of these problems, temperature monitoring has not been readily accepted. Snee “Infrared Monitoring of Resistance Spot Welding” Metal Construction April 1972

55
Typical temperature traces observed by these methods are presented here. Note that these methods have not found a lot of success in controlling the welds during production, but in situations where a post weld temper is applied in the spot welder, these devices can give a relative good feeling for the post weld temper heat cycle, a value which general is just determined by trial and error. Thus these devices may find some use in the establishment and set up of quench and temper cycles. Beevers “Temp Measurement to Determine Post Weld Heat Treatment..” British Welding Journal, April 1963

56
Several different ultrasonic techniques and different ultrasonic signals (including transmitted signals, reflected signals, a signal attenuation, and signal velocity) have been suggested for spot weld monitoring. The first technique involves two transducers mounted as illustrated in the above figure. Ultrasonic energy pulses are transmitted from the transmitting crystal throughout the weld cycle, and collected at the receiving crystal. Burbank “Ultrasonic In-Process Inspection of Resistance Spot Welds” Welding Journal May 1965

57
Changes taking place during the weld, such as forging, melting, and solidification, cause changes in the transmitted ultrasonic signal height, as illustrated in the above figure. The shape of this curve is explained as follows. The initial signal height during squeeze time is dependent upon electrode and sheet contact area. Generally, higher electrode forces would lead to higher signal response. During the weld time, the faying surfaces heat. When the heated area is equal to the transmitted beam area, the ultrasonic signal decreases toward zero. As melting occurs, the electrodes indent the surface and enlarge the beam cross section. As this occurs, more of the signal can pass around the molten nugget, resulting in a signal increase. As the nugget grows, it interrupts the signal, thus causing a reduction in amplitude. When the nugget solidifies, the signal increases sharply. Thereafter, shrinkage reduces the electrode contact area and thus reduces the signal. Nugget growth can thus be monitored, as illustrated in the above figure, by observing the change in signal height during the weld time. Corrections have been made between ultrasonic signal height and spot weld nugget strength. Burbank “Ultrasonic In-Process Inspection of Resistance Spot Welds” Welding Journal May 1965

58
Another technique utilizes a pulsed-echo, single transducer method to inspect previously welded spot welds. A schematic illustration of the test arrangement is presented in the above figure. The ultrasonic pulse is transmitted into the weld area and the initial pulse echo and pulse attenuation are analyzed.

59
An illustration of the pulse echoes received for various welding conditions are presented in the above figure. In welds which are larger than the ultrasonic beam width, only reflections from the top and bottom (A & C) surfaces are observed, but these large welds promote rapid peak attenuation due to scattering of the ultrasonic energy by the large-grained solidified nugget region (compare the above figure a and b). In undersized nuggets, some intermediate reflections are observed from the faying surface (surface B). In stick welds where no nugget is formed but the intermediate surfaces are coalesced, ultrasonic reflections are seen predominantly from the top and bottom surfaces (surfaces A & C). This case differs from that of the acceptable welds in that attenuation is very slight. Finally, in samples where no weld at all is seen, reflections occur from only the top and intermediate surfaces (Surfaces A & B). A number of difficulties have been encountered in the use of the ultrasonic monitoring technique. These include a) a reasonable surface is necessary for good coupling, b) weld defects are often overlooked, c) welds in thin materials are difficult to test because of lack of signal resolution (especially the pulsed-echo techniques), d) in some cases, interpretation of oscillograph traces was necessary which made automation difficult, e) extraneous signals are sometimes observed from zinc surfaces on galvanized materials, and f) the thin fragile transducers and the transducer locations do not lend themselves to heavy-duty production. In spite of these difficulties, some ultrasonic methods are being evaluated at several companies.
 a reasonable surface is necessary for good coupling, b) weld defects are often overlooked, c) welds in thin materials are difficult to test because of lack of signal resolution (especially the pulsed-echo techniques), d) in some cases, interpretation of oscillograph traces was necessary which made automation difficult, e) extraneous signals are sometimes observed from zinc surfaces on galvanized materials, and f) the thin fragile transducers and the transducer locations do not lend themselves to heavy-duty production. In spite of these difficulties, some ultrasonic methods are being evaluated at several companies.")
60
Dynamic Temperature Measurements Using Ultrasonics
During welding, ultrasonic pulses (shear waves) are transmitted through the weld deposit. The changes in the ultrasonic transmissivity of the base material are recorded during the welding process and used for determining the size of the weld nugget. Waschkies, E. “Process-Integrated Resistance Spot-Welding Testing Using Ultrasound Techniques” Welding In the World, Vol 39, No 6, 1997
 are transmitted through the weld deposit. The changes in the ultrasonic transmissivity of the base material are recorded during the welding process and used for determining the size of the weld nugget. Waschkies, E. Process-Integrated Resistance Spot-Welding Testing Using Ultrasound Techniques Welding In the World, Vol 39, No 6,")
Similar presentations


>")


>")


 It is defined as the ratio of the number of turns in the secondary winding (N sec ) to the number.>")


