Download presentation
Presentation is loading. Please wait.

2
Tide Gauges for Tsunami monitoring system Over 15 Installed locally and thru the Virgin Island Reference points for the ETAS

3
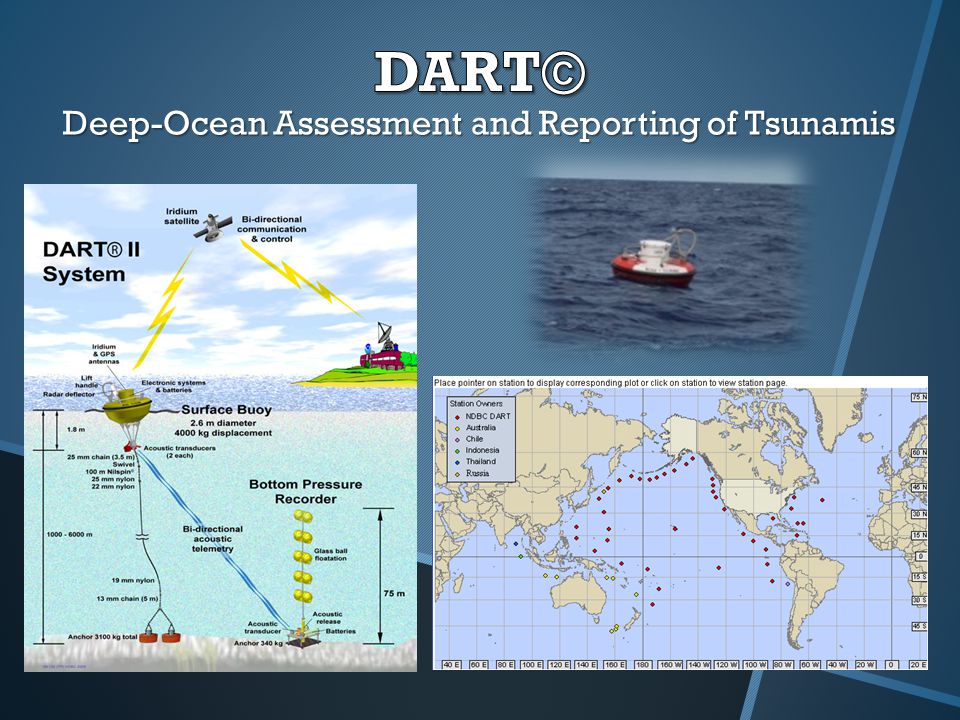
Contributing, Contributing RTX (DART), Existing, Gap, Planned, Non Operational/Unknown Caribbean Sea Level Monitoring Stations NOAA NWS Caribbean Tsunami Warning Program http://www.srh.noaa.gov/srh/ctwp/
, Existing, Gap, Planned, Non Operational/Unknown Caribbean Sea Level Monitoring Stations NOAA NWS Caribbean Tsunami Warning Program")
4
Broad Stakeholders Group Tsunami Warning Centers Hydro Met Services Climate Centers Shipping Community Hydrographic Services Tourist and Hotel Associations Emergency Management Agencies Science and Technology community

5
Equipment at Tide Gauge Stations Sea Level Sensors (sensors will vary by station) Wind Direction and Speed Temperature and humidity Rainfall Water Temperature Barometric Pressure
 Wind Direction and Speed Temperature and humidity Rainfall Water Temperature Barometric Pressure")
6
Aquatrak sensor

7
Bubbler Sensor

9
GOES Satellite System

10
Internet

11
Sutron - XConnect TideView Decoders and plotting programs

12
Tide Gauges Map http://www.prsn.uprm.edu/English/EstacionesV2/tidegauges.php This map shows all gauges stations monitored in real- time at the PRSN. The map is divided in 3 sections; Caribbean, Northeastern Caribbean and Puerto Rico Colors of the triangle represents the latency of the station over that time interval. Example: a green triangle means no (or less than 10 min) gaps, a red triangle means no data.
 gaps, a red triangle means no data..")
13
The first part shows the station details, including location on Google map and a picture of the station. The second part displays the data on a plot view. The data shown represents the last day. To search for more data click “Perform another search”.Plot

14
Data The first part shows the station details, including location on Google map and a picture of the station. The second part displays the data in a table view. The data shown represents the last day. To search for more data click “Perform another search”.

15
Blog The Blog contains a station log and other records.

16
Latency – tide Quality & Availability Qtide is used to measure the quality & availability of a data set generated periodically by the gauges stations.

17
Qtide – Form Using this form, you select the station and the date range of your search.

18
Qtide – Table The first table shows the degree of completeness. The second table shows the gap list.

19
Qtide – Graph This graph shows gaps from each sensor of the station selected. Red means no data.

20
NOAA Tides & Currents http://tidesandcurrents.noaa.gov/station_retrieve.shtml?type=Tide+Data

21
NOAA Tides & Currents http://tidesandcurrents.noaa.gov/station_retrieve.shtml?type=Tide+Data

22
NOAA Tides & Currents http://tidesandcurrents.noaa.gov/station_retrieve.shtml?type=Tide+Data

23
http://www.ioc-sealevelmonitoring.org/map.php Only quality control monitored is data availability, the quality of the data per se is NOT reviewed

24
http://www.ioc-sealevelmonitoring.org/map.php

26
http://www.pol.ac.uk/psmsl/programmes/gloss.info.html GLOSS - The Global Sea Level Observing System Establishment of high quality global and regional sea level networks for application to climate, oceanographic and coastal sea level research and monitoring. Coordinated by the Intergovernmental Oceanographic Commission (IOC) Major contributor to IOC’s Global Ocean Observing System (GOOS) Organizes and supports training courses, including the Caribbean and publication of manuals for operators and sea level reports for GLOSS stations by UHSLC and UK Proudman Sea Level Center
 Major contributor to IOC’s Global Ocean Observing System (GOOS) Organizes and supports training courses, including the Caribbean and publication of manuals for operators and sea level reports for GLOSS stations by UHSLC and UK Proudman Sea Level Center.")
27
COCONet Project NSF/UNAVCO/2.5 M US$ To be able to get better geodetic control and address the issue of ground displacement vs sea level changes over short time term (earthquake/tsunami) and long term (sea level), efforts are being made to collocate some of the COCOnet GPS stations within 1 km of existing or proposed sea level stations. The final COCONet siting plan. Green dots represent new (50) or refurbished stations (15), red dots represent existing stations (61), and the blue triangle represents one alternate site on Sombrero Island. Large green dots represent the seven completed COCONet stations to date.
 or refurbished stations (15), red dots represent existing stations (61), and the blue triangle represents one alternate site on Sombrero Island. Large green dots represent the seven completed COCONet stations to date..")
28
CTWC “Providing regional service, strengthening local capabilities…” NOAA NWS established in February 1, 2010 the Caribbean Tsunami Warning Program, jointly located at the Puerto Rico Seismic Network at the University of Puerto Rico at Mayagüez as a 1rst step of the U.S. towards the establishment of a Caribbean Tsunami Warning Centre. Endorsed by UNESCO/IOC/CARIBE EWS Funds are yet to be identified for full implementation of Center

29
CTWC “Providing regional service, strengthening local capabilities…” Currently supports and monitors all sea level stations in the Caribbean using Tide Tool. Co-Organizer of June 2011 CARIBE EWS sea level network operator workshop in Mexico Received special funding of $80,000 to develop tools for integration of sea level data into Caribbean and Western Atlantic Hydromet Offices and Tsunami Warning Focal Points

30
Sea Level Network Operators in the Caribbean US NOAA NOS Puerto Rico Seismic Network, UPRM University of Hawaii Sea Level Center Caribbean Institute of Meteorology and Hydrology National University of Mexico IPGP-France SHOM-France National Office of Meteorology, Dominican Republic Bahamas Met Service Nicaragua Territorial Services Institute Jamaica Met Service Curacao Met Services National University of Costa Rica Dominica Emergency Management Grenada Met. Services Coastal Zone Management Unit of Barbados Antigua and Barbuda Met Service Caribbean Community Center for Climate Change, Belize Belize Met Services Guatemala Seismological, Volcanological and Meteorological Institute

31
PRSN with the University of Hawaii and funding from NWS is installing and providing maintenance thru at least 2013 for 10 Tide Gauges installations in the Caribbean (only sea level, no met component). 2 Dominican Republic 2 Colombia Panama Limon Grand Turks Curacao Grenada Dominica PRSN with UNESCO and funding from Brazil and Saint Kitts/Nevis is installing 5 Tide Gauges in Caribbean. Nicaragua Guatemala Cayman Saint Vincent Saint Kitts Haiti PRSN with ONAMET with NWS funding is installing a station. Barahona, Dominican Republic Predicted tides for stations Improving the Tsunami monitoring system. PRSN work in progress

32
Issues with Caribbean Sea Level Stations Broaden the user base, currently the sea level data is ingested by the TWC, but is mostly underutilized for other climate/hydromet/shipping applications. Broaden the user base, currently the sea level data is ingested by the TWC, but is mostly underutilized for other climate/hydromet/shipping applications. Additional training for sea level network operators-next workshop for June 2012 in Mexico (UNESCO/UNAM/NWS) Additional training for sea level network operators-next workshop for June 2012 in Mexico (UNESCO/UNAM/NWS) Explore alternatives for robust real time high rate transmission, 1minute. Explore alternatives for robust real time high rate transmission, 1minute. Need for QC for many of the stations Need for QC for many of the stations Need to determine the predicted tides for many stations Need to determine the predicted tides for many stations Need for a Caribbean Sea Level Data Center as a repository and for data QC/Analysis Need for a Caribbean Sea Level Data Center as a repository and for data QC/Analysis Publication on Caribbean sea level data Publication on Caribbean sea level data
 Additional training for sea level network operators-next workshop for June 2012 in Mexico (UNESCO/UNAM/NWS) Explore alternatives for robust real time high rate transmission, 1minute. Explore alternatives for robust real time high rate transmission, 1minute. Need for QC for many of the stations Need for QC for many of the stations Need to determine the predicted tides for many stations Need to determine the predicted tides for many stations Need for a Caribbean Sea Level Data Center as a repository and for data QC/Analysis Need for a Caribbean Sea Level Data Center as a repository and for data QC/Analysis Publication on Caribbean sea level data Publication on Caribbean sea level data.")
33
Caribbean Sea Level Monitoring Stations Progression (1960-present) Source: CTWP
 Source: CTWP")
34
Questions ?

Similar presentations


 2012 Mark Merrifield University of Hawaii Requirements Status Strategies Partnerships Emerging technologies.>")


 Philip L. Woodworth Permanent Service for Mean Sea Level.>")

 building capacity to manage.>")


 Training Activities Presented by: Bernie Connell (CIRA) Includes contributions from: NOAA Office of Satellite and Product Operations.>")


 UNESCO.>")