Download presentation
Presentation is loading. Please wait.

1
Assessing Health and Economic Outcomes for Diagnostic Imaging William C. Black, M.D. Dartmouth-Hitchcock Medical Center

2
Outline “ Outcomes” research Relevance to imaging Methods –Health outcomes –Economic outcomes –CEA

3
“ Outcomes” - History Geography is destiny More is not better Pt preferences matter

4
http://www.cms.hhs.gov/NationalHealthExpendData/02_NationalHealthAccountsHistorical.asp#TopOfPage US Health Care Expenditures

5
Health Expenditures by Country 2006

6
Life Expectancy by Country CountryLife ExpRank Macau84.41 Japan82.13 Canada81.27 United Kingdom79.036 Bosnia78.543 United States78.149 Mexico76.171 China73.5108 Iraq70.0145 Angola38.2224

7
Factors Increasing Spending Congressional Budge Office. Nov 2007 New medical technology & services Increases in income and insurance Aging population

8
Growth in physician services

9
Imaging Boom1997-2006 Washington GHC XS imaging vol ↑2X pm CT vol ↑2X pm, MR vol ↑3X pm Costs for all imaging ↑2X pm XS 54-70% imaging costs Smith-Bindman et al. Health Aff, 2008. 27(6): p. 1491-502.
: p")
10
“ Outcomes” - Mission Determine what works Assess pt preferences Deliver appropriate care

11
To ensure that observed differences in outcome depend only on the interven- tions under investigation and not on other factors that affect outcome. Randomized Clinical Trial

12
Heirarchical Model of Efficacy Level 1. Technical Level 2. Diagnostic accuracy Level 3. Diagnostic thinking Level 4. Therapeutic Level 5. Patient outcome Level 6. Societal Fryback & Thornbury. Medical Decision Making 1991;11:88-94.

13
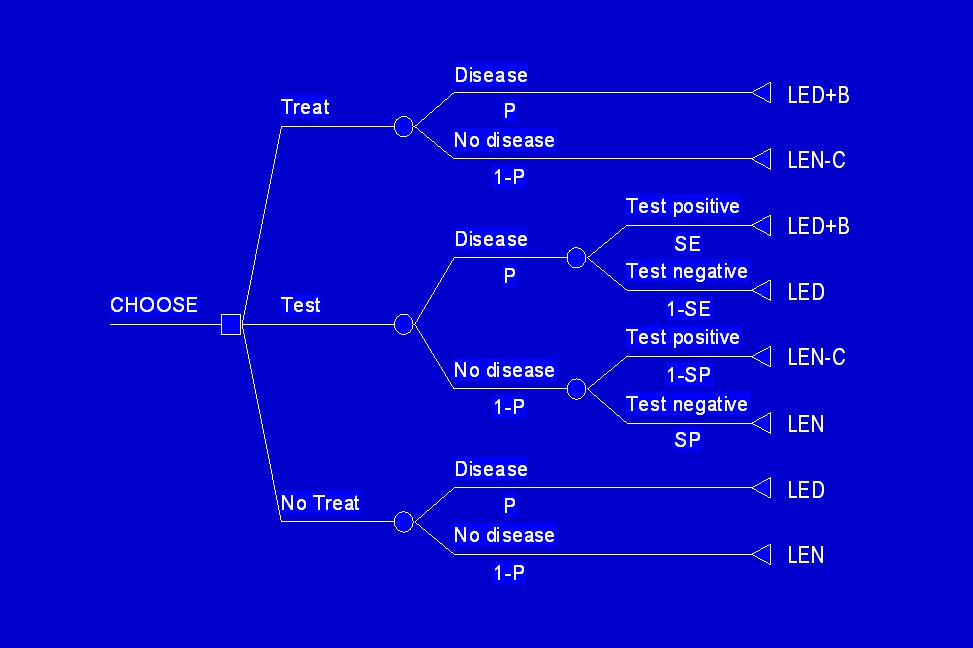
Evaluation of Accuracy Binary model of disease SE & SP interdependent SE & SP independent of P and effects of treatment

15
Baseline Values P0.5 B, C1.0 LEN2.0 LED0.0 SE, SP0.8

16
Baseline Analysis Treat1.0 Test1.3 No Treat1.0

17
Limitations of Binary Model Disease spectrum Accuracy of test Natural History of dz Effectiveness of treatment

18
RCT of Test Prevalence of disease Rate of adverse events Accuracy of testing Test-treatment strategy Collaboration

19
ACRIN OECL Measure HRQOL Measure costs Analyze cost-effectiveness

20
HRQOL Global rating Symptoms Functional status

21
HRQOL Non-preference based –Generic, e.g., EVGFP, SF-36 –Disease-specific, SAQ Preference based –Direct, e.g., VAS –Derived, e.g., SF-6D

22
Measuring Preferences - Direct Rating scale Standard gamble Time-tradeoff

23
Standard Gamble

24
Measuring Preferences - Derived Quality of Well Being Health utilities index EuroQoL-5D Short Form -6D

25
Measure of patient utility Measured on a scale of 0-1.0 Can be assessed directly or derived from health survey, e.g., SF-36 Quality Adjusted Life Year

26
Quality Adjusted Life Years 00.51.0 0.5 1.0 Quantity of Life Quality of Life QALY = 0.5+0.25 = 0.75

27
QALYs

28
Methods of Cost Analysis Cost Minimization Analysis (CMA) Cost Effectiveness Analysis (CEA) Cost Benefit Analysis (CBE)
 Cost Effectiveness Analysis (CEA) Cost Benefit Analysis (CBE)")
29
Methods of Cost Analysis MethodCostsHealth CMADollarsNone CEADollarsLYs, QALYs CBANMB

30
Cost Perspective Rad DeptRadiologists, technologists, technology (payment) HospitalOther physicians, nurses, technicians, technology (payment) PayerPlus outpatient costs SocietalPlus other public agencies, patients, family Tarride et al. J Am Coll Radiol, 2009. 6(5): 307-16.
:")
31
CER = ∆COSTS ∆QALYS

32
Comparison Do Nothing Do Something STRATEGYCOSTQALYSCER 0 $100,000 0 4 NA $25,000

33
c e III ? Cost-Effective III ? Not Cost-Effective IV Black. Med Decis Making 1990. 10(3): 212-4.
:")
34
c e IIIB IV IIIA IA IIIB K Black. Med Decis Making 1990. 10(3): 212-4.
:")
35
Incremental vs Average CE 1 2 3 STRATCOSTQALYSAVG CERICER -$250,000 $250,000 $750,000 5 20 25 -$50,000 $12,500 $30,000 $33,333 $100,000

36
$THOUS QALYS 10 15 -50510152025 -400 -200 0 200 400 600 800 1 1 2 2 3 3

37
Efficient Frontier e c

38
Uncertainty Sensitivity analysis Scatterplot of ICE CE Acceptability curves

39
Copyright ©2008 American Heart Association Weintraub, W. S. et al. Circ Cardiovasc Qual Outcomes 2008;1:12-20 Scatterplot ICE

40
Copyright ©2008 American Heart Association Weintraub, W. S. et al. Circ Cardiovasc Qual Outcomes 2008;1:12-20 CE Acceptability curve

41
RESCUE Health outcomes Economic outcomes CEA

42
Medical Record Abstraction Coordinated by CSS at Brown University Questionnaires @ 6, 12, 18, and 24 months –Health Status and Medical Utilization –Time and Travel Central MRA company

43
Medical Record Abstraction Coordinated by CSS at Brown University Triggered by exam results, Q responses MACE/revascularization events Medical care for cardiac care and IFs

44
Health Outcomes MACE/ Revacularization Life years (Vital Status) QALYs (SF-36) @ BL, 12 mos Angina Status –CCS @ BL, 6, 12, 18, & 24 mos –SAQ @ BL, 12 mos
 QALYs BL, 12 mos Angina Status BL, 6, 12, 18, & 24 mos BL, 12 mos")
45
Life Years All observed deaths thru trial All projected deaths after trial –Framingham survival estimates based on age, sex, and cardiovascular events

46
QALYs Derived from SF-36 @ BL, 1 yr SS-6D utility scoring Adjusted for age after trial

47
Economic Outcomes Direct cardiac* –inpatient care –outpatient care –medications Indirect cardiac* –time and travel

48
Economic Outcomes Based on 201x dollars Adjusted for timing w MC CPI Projected by age beyond trial

49
Hospitalization Costs Triggered by patient questionnaire DRGs and CPTs coded by MRA Medicare reimbursement –Part A MEDPAR –Part B Physician Fee Schedule

50
Outpatient Costs Triggered by patient questionnaire CPTs coded by MRA Medicare Physician Fee Schedule Red Book avg wholesale prices

51
Indirect Costs Triggered by patient questionnaire Travel and other expenses Time from usual activities

52
CEA Societal perspective In-trial and lifetime horizons Discounting @ 3% Sensitivity analysis ICER with 95% CI –nonparametric bootstrapping

53
Base Case StrategyCostQALYs Cost QALYs ICER CCTA SPECT

54
Copyright ©2008 American Heart Association Weintraub, W. S. et al. Circ Cardiovasc Qual Outcomes 2008;1:12-20

55
Copyright ©2008 American Heart Association Weintraub, W. S. et al. Circ Cardiovasc Qual Outcomes 2008;1:12-20

56
US Life Expectancy 1970-2005

57
Sensitivity Analysis Bootstrap methods 1-way sensitivity analysis Prob sensitivity analysis

Similar presentations


>")


