Download presentation
Presentation is loading. Please wait.

1
Measuring Quality and Impact of the Social Sciences Concepts, Opportunities and Drawbacks Pre-Conference of the 10 th International Conference on Science and Technology Indicators University of Vienna, September 17, 2008 Anthony F.J. van Raan Center for Science and Technology Studies (CWTS) Leiden University
 Leiden University.")
2
This presentation will highlight recent CWTS projects: * Benchmarking & Evaluation * HEFCE * Identification of Excellence

3
From these recent studies we present empirical results for social science fields particularly concerning: * WoS coverage * Characteristics of WoS publications * Characteristics of n-WoS publications * Bibliometric results and peer judgments

4
First the basic principles of bibliometric analysis

5
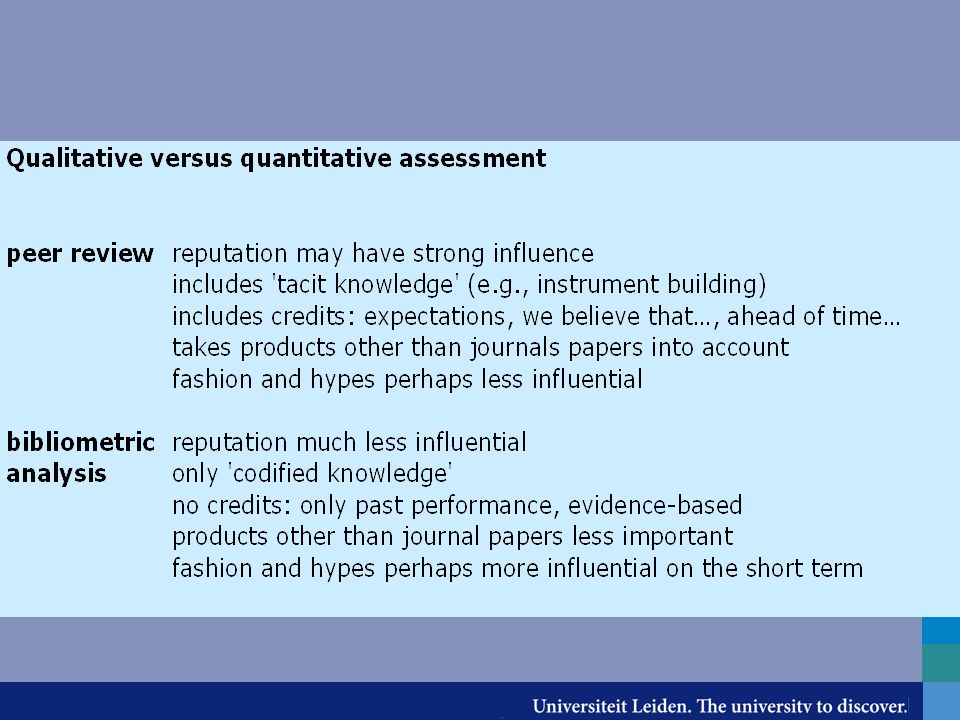
Basic Concept: Quality Scientific performance relates to achieved quality in the contribution to the increase of our knowledge (‘scientific progress’) (1) as perceived by others: peer review (2) as measured by advanced bibliometric analysis
 (1) as perceived by others: peer review (2) as measured by advanced bibliometric analysis")
6
Basic issues for research assessment, also in the social sciences: * Objectivity * Transparency * How to handle interdisciplinarity, definition of fields * Different ways, prestige and intensity of publication * Role of co-authors in publications * Orientation of research: local vs. global * Language * Ageing of research results * PhD training * Time dimension of awards * Socio-economic impact

7
Citing Publications Cited Publications All calculations are corrected for self-citations!

8
What do citations measure? - Many studies showed positive correlations between citations and qualitative judgments - In principle it is valid to interpret citations in terms of intellectual influence which is an important aspect of scientific quality - Thus, the concepts of citation impact and scientific quality do not coincide ‘automatically’

9
WoS sub-universe 8,000 j; 1,000,000p/y Refs > nWoS Compendex Medline non-WoS publ: Books Book chapters Conf. proc. Reports ArXiv Total publ universe LNCS Source expansion Target expansion Scopus *CWTS is in license agreement negotiations with Scopus *CWTS currently compares Scopus- vs. WoS coverage *CWTS bibliometric algorithms can be applied to Scopus data Google Scholar

10
Network of publications (nodes) linked by citations (edges) Lower citation-density Higher citation-density e.g., applied research, e.g., basic natural social sciences medical research FCSm JCSm CPP Expected values for normalization Absolutely necessary but……are they appropriate?
 linked by citations (edges) Lower citation-density Higher citation-density e.g., applied research, e.g., basic natural social sciences medical research FCSm JCSm CPP Expected values for normalization Absolutely necessary but……are they appropriate")
11
Journal Field = set of journals ‘established fields’ scientific medium-grained structure + reference-based re-definition (expansion) of fields CWTS applies two types of field definitions:
 of fields CWTS applies two types of field definitions:")
12
fields Main field: Social and Behavioral Sciences Major field, e.g. Economics & Business journals All publication titles + abstracts (~30,000,000) have been grammatically parsed to enable bibliometric analysis by themes/concepts/ instruments and to create word-correlation based maps of science
 have been grammatically parsed to enable bibliometric analysis by themes/concepts/ instruments and to create word-correlation based maps of science.")
13
cluster Field = clusters of concept-related publications new, emerging often interdisc. fields scientific fine-grained structure

14
Social Sciences Top-50 EU universities, their top-10% publications in this field Now specific sub-field CPP/FCSm values can be calculated, for instance for research on democracy But, obviously, the finer grained, the more ‘noisy’

15
Basic Performance Indicators POuput: Number of publications in internationally refereed CI-covered journals CAbsolute Impact: Number of (self-ex) citations to these publications HHirsch-index CPPOutput-normalized Impact: Average number of cits/pub of the institute JCSmAverage number of cits/pub of the journal set used by the institute FCSmAverage number of cits/pub of all journals of a specific field in which the institute is active (FCSm) p0Percentage of not-cited publications
 citations to these publications HHirsch-index CPPOutput-normalized Impact: Average number of cits/pub of the institute JCSmAverage number of cits/pub of the journal set used by the institute FCSmAverage number of cits/pub of all journals of a specific field in which the institute is active (FCSm) p0Percentage of not-cited publications")
16
CWTS Key Research Performance Indicators: JCSm/FCSmRelative impact of the used journal set CPP/JCSm Internat. journal-normalized impact CPP/FCSm Internat. field & doc-normalized impact Pt/ΠtContribution to the top-5, 10, 20,..% P*CPP/FCSm Size & Impact Together: Brute Force

17
Applied research, engineering Basic research high FCSm Up to factor ~20 high FCSm, but low JCSm low FCSm low FCSm, but high JCSm High CPP low CPP

18
Internal WoS-coverage of social science fields results from HEFCE and Benchmark projects

19
Internal WoS coverage of main fields of science

20
What is the internal WoS coverage and how is it calculated? Example: EUR 2000-2004

22
Internal WoS coverage (%) of submitted publications per UoA From: Moed, Visser, Buter, 2008
 of submitted publications per UoA From: Moed, Visser, Buter, 2008")
23
Internal WoS coverage for all main fields of science

24
purple: non-WoS ref light blue: CI ref 1991-2006

25
purple: non-WoS ref light blue: CI ref 1991-2006

26
External WoS-coverage of social science fields results from HEFCE and Evaluation projects

27
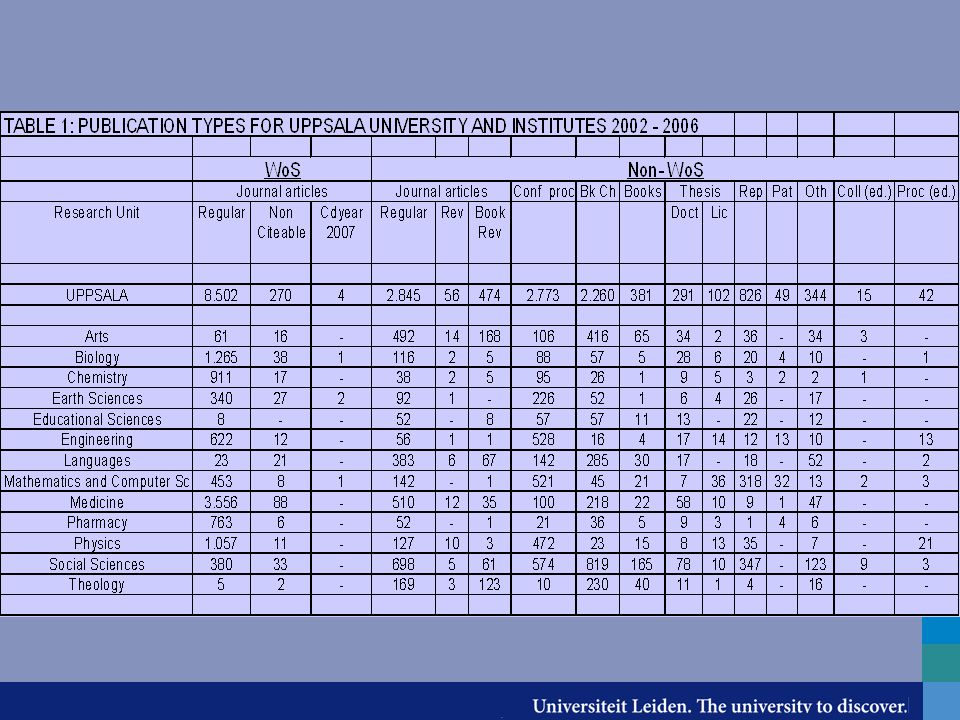
What is the external WoS coverage and how is it calculated? Example: Uppsala 2002-2006

28
From: Van Leeuwen 2006

29
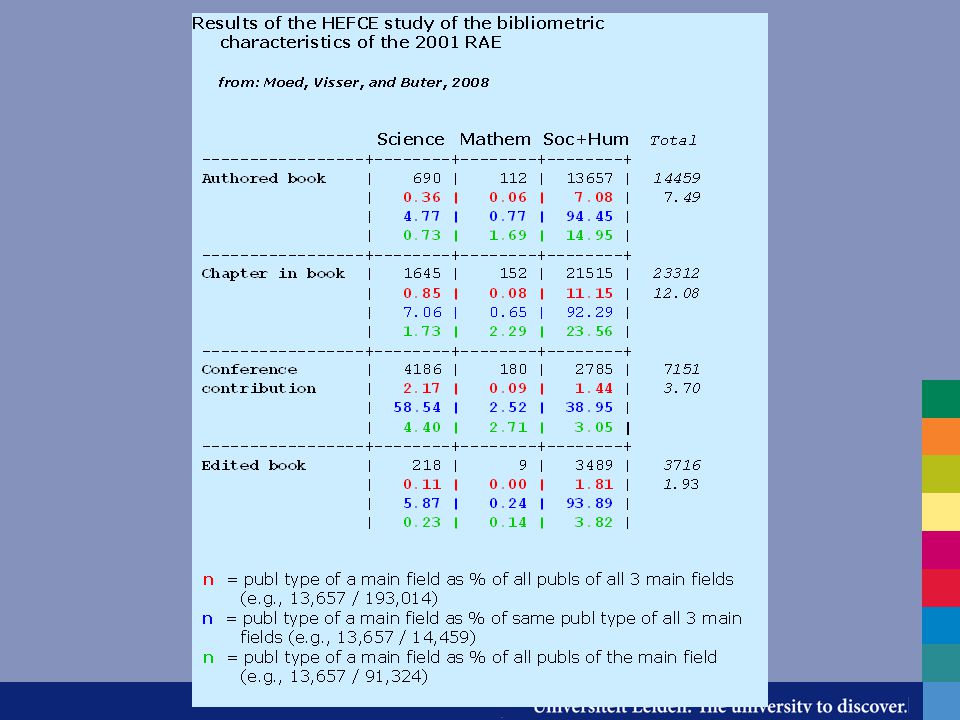
84% of the total number of publications submitted to the 2001 RAE from science-related departments were published in WoS-covered journals. For Mathematics publications the WoS coverage is only slightly lower (82%), It is substantially lower for Social Sciences and Humanities (25%) From: Moed, Visser, Buter, 2008
, It is substantially lower for Social Sciences and Humanities (25%) From: Moed, Visser, Buter,")
31
External WoS coverage (%) of submitted publications per UoA
 of submitted publications per UoA")
32
What is the correlation between internal and external WoS coverage?

33
Characteristics of WoS publications in social science fields results from HEFCE and Benchmark & Evaluation projects

34
Publications from 1991,….1995 time lag & citation window

35
Main differences with the natural and medical sciences: *Lower numbers (more than 1 order of magnitude….) *Slower rise, broader peak and much slower decay (less hectics…)
 *Slower rise, broader peak and much slower decay (less hectics…)")
39
EUR 200-2006 Benchmark Study

42
Characteristics of non-WoS publications in social science fields results from HEFCE and Benchmark & Evaluation projects

44
Top-10% (of impact) of EU publications in Political Science, Economics, and Psychology 1997-2003, 4-y citation window (to calculate their impact) From references all WoS-references removed, only non-WoS references ( with freq > 2) have been analyzed Total about 28,000
 of EU publications in Political Science, Economics, and Psychology , 4-y citation window (to calculate their impact) From references all WoS-references removed, only non-WoS references ( with freq > 2) have been analyzed Total about 28,000")
45
From: Nederhof, van Leeuwen, van der Wurff 2008 From these:

47
(> 1980)
")
48
Top-50 non-WoS >1980 references by document type

49
Bibliometric results and peer judgments results from HEFCE and Benchmark & Evaluation projects

53
Comparison WoS vs. Scopus results from one of the HEFCE projects: see tomorrow Martijn Visser and Henk Moed: “Comparing Web of Science and Scopus on a paper-by- paper basis”

54
Conclusion Advanced bibliometric analysis is a powerful tool to make research assessment more objective, transparent and effective, particularly in the natural science and medical fields, and also in many of the engineering and social science fields but both internal and external WoS/Scopus coverage are absolutely necessary parameters to assess the validity of WoS/Scopus based measurements (including the non-WoS/Scopus publications…) As always, never use it as a stand-alone tool. But also: it is an effective instrument for measuring interdisciplinarity, knowledge flows and knowledge diffusion -even for non-WoS/Scopus publications!

55
Thank you for your attention more information: www.cwts.leidenuniv.nl

56
Appendix

57
According to an influential Swiss scientist: Bibliometric investigations are clearly not very reliable…. In particular, the "frequency of citation" does not account for the quality of the researchers, because (1 ) it depends more often on the social recognition of the researcher than excellence of his/her scientific work; (2) it favors researchers who work on fashionable topics; (3) it favors the fields of knowledge which traditionally publish shorter articles compared to those where publications are longer; (4) it cannot differentiate between the fashion and the substance of a paper; (5) it can favor the authors of "surveys", who are very frequently cited, compared to the authors of focused research papers; (6) a position article or even an erroneous article can be criticized and consequently well cited.
 it depends more often on the social recognition of the researcher than excellence of his/her scientific work; (2) it favors researchers who work on fashionable topics; (3) it favors the fields of knowledge which traditionally publish shorter articles compared to those where publications are longer; (4) it cannot differentiate between the fashion and the substance of a paper; (5) it can favor the authors of surveys , who are very frequently cited, compared to the authors of focused research papers; (6) a position article or even an erroneous article can be criticized and consequently well cited..")
58
According to an influential Swiss scientist: How to increase your ‘bibliometric values’

59
Main anecdotal objections against citation analysis - Mendel Syndrome - Wittgenstein Syndrome - Lowry Effect - Einstein effect - Old boys clique - Disgusting anyway

60
A scientist has index h if h of his/her N papers have at least h citations each and the other (N-h) papers have no more than h citations each
 papers have no more than h citations each")
62
Hirsch (h-) index AFJ van Raan = 18
 index AFJ van Raan = 18")
66
Large European University Among top 25 % in publication output and citation impact Top 25% Bottom 25% Impact ranking Publ.ranking Top 25%Bottom 25%

67
‘Top’ research university University has a top position in each discipline Bottom 25% Publ.ranking Top 25% Impact ranking Bottom 25%

68
Citation-counting scheme based on ‘roof-tile’ method: Citation years 19951996 1997 1998 1999 2000 2001 2002 1995 1996 1997 1998 1999 2000 2001 2002 1995 1996 1997 1998 1996 1997 1998 1997 1998 1998 1996 1997 1998 1999 1997 1998 1999 1998 1999 1999 1997 1998 1999 2000 1998 1999 2000 1999 2000 2000 1998 1999 2000 2001 1999 2000 2001 2000 2001 2001 1999 2000 2001 2002 2000 2001 2002 2001 2002 2002

69
Example: The Lancet Publs Cits 2000+012002 Art7847134 Not144 593 Rev 29 232 Subtot 957(a) 7959(b) Let41814264 Edi1313905 Other1421909 Total7872 14037 (c) ISI IF Citations in 2002__________ Citeable documents in 2000 and 2001 14037 (c) 957 (a) IF=14.7 CWTS IF Citations to Art/Not/Rev in 2002 Art/Not/Rev in 2000 and 2001 7959 (b) 957 (a) Citations to Art/Let/Not/Rev in 2002 Art/Let/Not/Rev in 2000 and 2001 7959+4264 957+4181 IF=8.3 IF=2.4
 7959(b) Let Edi Other Total (c) ISI IF Citations in 2002__________ Citeable documents in 2000 and (c) 957 (a) IF=14.7 CWTS IF Citations to Art/Not/Rev in 2002 Art/Not/Rev in 2000 and (b) 957 (a) Citations to Art/Let/Not/Rev in 2002 Art/Let/Not/Rev in 2000 and IF=8.3 IF=2.4")
70
Manipulability of citation indicators proposed in this study To which extent are our citation-based indicators sensitive to manipulation? Can one increase actual citation impact by:

71
(1) Increasing author self citation? Author self-citations are not included: increasing author self-citation has no effect

72
(2) Publishing in high impact journals? A case study of 2,000 UK senior authors with >10 p/y revealed that journal impact explains ~20% of the variance in the citation impact rates. Journal impact is therefore not a dominant determinant of actual citation impact at the level of individual senior authors.

73
(3) Collaborate more intensively? Some studies report positive correlation between number of authors and citation impact, but they ignore differences in authoring practices among research fields. Author self-citations are not included in this study. It all depends upon who collaborates with whom. There is also the issue of causality: ‘good’ research may attract high-impact collaborators.

74
(4) Publishing with US authors because they overcite their own papers? Studies found no conclusive evidence that US scientists in science fields excessively cite papers originating from their own country.

75
(5) Publishing less, only the very best papers? One would expect a higher citation impact per paper. Longer term effects of such a publication strategy are uncertain. PhD students need papers in their CV’s. It may become difficult for a group to attract good PhD students if its policy is to let them publish only a few papers. Another factor is that publications also enhance the visibility of a group’s research activities. If a group starts publishing substantially less papers, this may lead to a lower visibility and hence to a lower citation impact, even per paper.

76
(6) Making citation arrangements? A high impact group receives its citations from dozens of different institutions. The distribution of citations amongst citing institutions is very skewed. The contribution of the tail of the distribution to the citation impact is relatively large. Making arrangements with a few institutions will not lead to a substantial increase in citation impact.

82
More information: www.cwts.leidenuniv.nl mapping example: http://studies.cwts.nl/projects/leiden-benchmark www.cwts.leidenuniv.nl http://studies.cwts.nl/projects/leiden-benchmark

83
Application of Thomson-ISI Impact Factors for research performance evaluation is irresponsible * Much too short ‘Citation window’ * No Field-specific Normalization * No distinction between document types * Calculation errors/inconsistencies nominator/denominator * Underlying citation distribution is very skew: IF-value heavily determined by a few very highly cited papers

85
* What is quality? * Numbers are order of magnitude lower > examples (e.g., profiles) * H-index example social sciences * National publications (also the case for engineering!) * Coverage * Figures about the role of books vs. journal papers (Uppsala data?) * Language * Citation window * non-WoS analysis, target known * non-WoS analysis, target unknown (CHE-2 results) * Societal relevance of social sciences > try sustainability maps for social science themes! * Database problems (EC-ASSIST list) * Social science data from benchmark studies * Norwegian Association of Higher Education Institutions classification of sources * European Reference Index for the humanities journal classifications ERIH-ESF-HERA * Library Catalog Analysis: number of library copies per book title, e.g., Worldcat (Linmans); exploratory study of 43 catalogs in economics (ask HM…) * Use slides of HMs and TNs CHERPA presentations! * bibliometrics is more than an instrument of research performance analysis, it van also reveal patterns of knowledge development and diffusion
 * H-index example social sciences * National publications (also the case for engineering!) * Coverage * Figures about the role of books vs. journal papers (Uppsala data ) * Language * Citation window * non-WoS analysis, target known * non-WoS analysis, target unknown (CHE-2 results) * Societal relevance of social sciences > try sustainability maps for social science themes. * Database problems (EC-ASSIST list) * Social science data from benchmark studies * Norwegian Association of Higher Education Institutions classification of sources * European Reference Index for the humanities journal classifications ERIH-ESF-HERA * Library Catalog Analysis: number of library copies per book title, e.g., Worldcat (Linmans); exploratory study of 43 catalogs in economics (ask HM…) * Use slides of HMs and TNs CHERPA presentations. * bibliometrics is more than an instrument of research performance analysis, it van also reveal patterns of knowledge development and diffusion.")
86
* Is the lifetime of a book longer than that of a journal article? * Flemish study on social sciences and humanities! * Nature of citations may be different * Hierarchy of books through reputation of publishers? * Results of our HEFCE analysis of the RAE 2001 * Figures on p.37-40 in HEFCE Scoping report * Leiden Benchmarking: social sciences and humanities: order of magnitude, ranking, trend, soc sc & hum profiles, ‘bolletjes’ charts *

87
Field N Political science4742 Economics9062 Psychology14132

93
In the set of ‘best’ publications submitted to the 2001 RAE it was found that journal articles constitute 73% of submitted papers from all Subject Groups. For science-related Units of Assessment we find 92%. The profile for Mathematics is quite similar to that for Science. In Social Sciences and Humanities books are important publication sources. The shares of authored books and book chapters are 15 and 24%, respectively.

95
The comparison of WoS and Scopus coverage of the 2001 RAE ‘best’ publications shows that Scopus coverage is especially better in the Subject Groups Subjects allied to Health (e.g., clinical dentistry, nursing, pharmacy), and to a lesser extent also in Engineering & Computer Science and Health Sciences. In Clinical Medicine, Biological Sciences and Physical Sciences, however, Scopus coverage is slightly lower than WoS coverage. from: Moed and Visser 2008, Appraisal of Citation Data Sources, HEFCE-report

97
Distribution of %WoS papers found in Scopus, science fields

101
purple: non-WoS ref light blue: CI ref 2006

102
purple: non-WoS ref light blue: CI ref 2006

Similar presentations


 A large number of the records are enhanced with.>")


