Download presentation
Presentation is loading. Please wait.

1
The table shows the pay d (in dollars) as a function of the number of hours worked h. 1.) Complete the table of values and graph using the equation: Hours (h)14710 Dollars earned (d) 2.) Thinking of the graph of this function, should you connect the dots? Why or why not? 4.) Would it be reasonable to expect 40 hours to have $280 earned? Why or why not? 3.) How much money was made after working 4 hours? Express your answer in function notation.
 Complete the table of values and graph using the equation: Hours (h)14710 Dollars earned (d) 2.) Thinking of the graph of this function, should you connect the dots. Why or why not. 4.) Would it be reasonable to expect 40 hours to have $280 earned. Why or why not. 3.) How much money was made after working 4 hours. Express your answer in function notation..")
2
WordYour GuessDefinitionExample Domain Range Max Value Min Value Zero/s Y-intercept The y-values that can be plugged into the function The point(s) where the graph crosses the x-axis (x-intercept) The point(s) where the graph crosses the y-axis The x-values that can be plugged into the function The highest point on the graph (in a particular interval) The lowest point on the graph (in a particular interval)
 where the graph crosses the x-axis (x-intercept) The point(s) where the graph crosses the y-axis The x-values that can be plugged into the function The highest point on the graph (in a particular interval) The lowest point on the graph (in a particular interval)")
3
WordYour GuessDefinitionExample X-intercept Interval of Increase Interval of Decrease End Behavior Parent Function The interval where a graph is increasing (like climbing a hill) The interval where a graph is decreasing (like going down a hill) The direction the end of the graph is pointing. The head and tail of a graph. The basic functions used as building blocks for more complicated functions. The point(s) where the graph crosses the x-axis (zero)
 where the graph crosses the x-axis (zero).")
4
Parent Graphs Thoughts on Parenthood….. Your children need your presence more than your presents. ~Jesse Jackson Parents often talk about the younger generation as if they didn't have anything to do with it. ~Haim Ginott What’s this have to do with math??????

5
Parent Graphs/Parent Functions

6
Which parent am I related to? _____________________

9
X-intercepts and Zeros Always expressed as an ordered pair!

10
Minimum- Maximum- The lowest point in a particular section of a graph The highest point in a particular section of a graph It’s where the graph CHANGES directions!

11
Intervals of increase and decrease

12
(1,-2) (-1,2) increasing decreasing Increasing and decreasing are stated in terms of domain
 (-1,2) increasing decreasing Increasing and decreasing are stated in terms of domain")
13
(2, 1)(0, 1) increasing decreasingconstant Ex. 4cIncreasing and decreasing are stated in terms of domain

14
End Behavior

15
Domain

16
Domain

17
Domain

18
List the Domain. Domain

21
What is the domain? Choose the best answer (2,4) (-1,-5) (4,0) y = f(x)
 (-1,-5) (4,0) y = f(x)")
22
Ex. 2Find the domain of

23
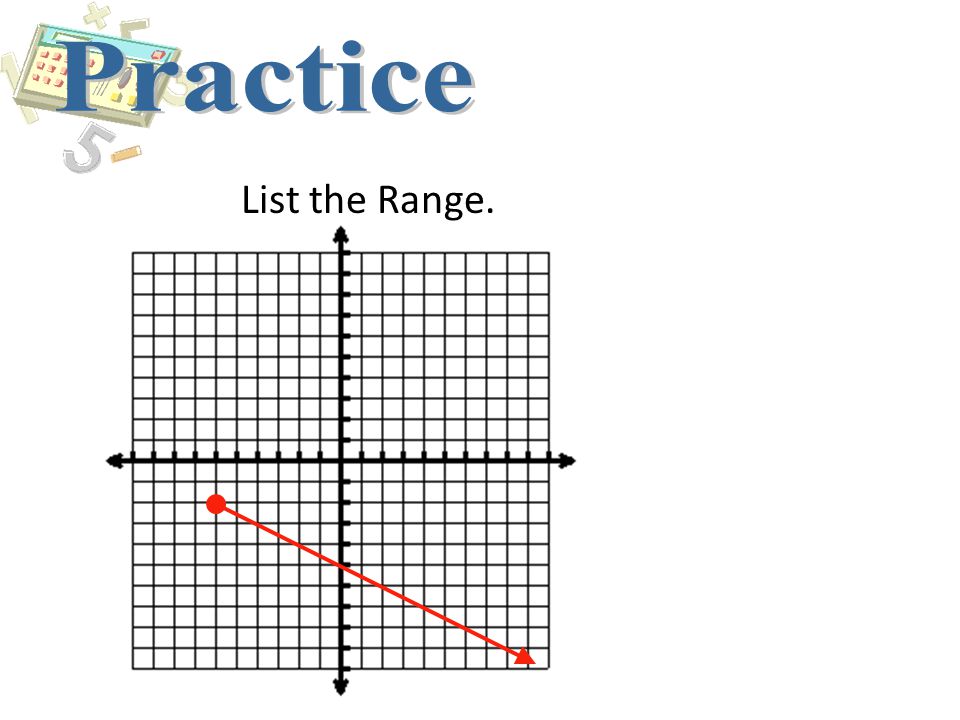
List the Range. R a n g e

24
R a n g e

26
R a n g e

28
(2,4) (-1,-5) (4,0) y = f(x) What is the range?
 (-1,-5) (4,0) y = f(x) What is the range")
29
Ex. 2Find the range of

30
How do we determine the domain of a function (by looking at it’s graph)? What is a max value? What is a y-intercept? How do you find it? What is a zero? How do you find it? How about the range? What is a min value?

31
Parent Function: Interval of increase: Interval of decrease: End Behavior: x-intercepts/zeros: Domain: Range: Max or min: y-intercept:

32
A Second Look at Parent Graphs…

33
Linear Domain: Range: Max: Min: Zeros: y-intercept:

34
Quadratic Domain: Range: Max: Min: Zeros: y-intercept:

35
Cubic Domain: Range: Max: Min: Zeros: y-intercept:

36
Absolute Value Domain: Range: Max: Min: Zeros: y-intercept:

37
Square Root Domain: Range: Max: Min: Zeros: y-intercept:

38
Rational Domain: Range: Max: Min: Zeros: y-intercept:

39
Complete the “Function Families Proper Notation” sheet.

Similar presentations


: y-intercept: Domain: Axis of Symmetry: Zero(s): Range: What are the Characteristics of Quadratic Functions?? MM2A3c. Investigate and explain.>")
 Find the rate of change from 2 to 4 years. = 4 in / year Time (years) 123456 Height (in.) 273537434549 2) Find the domain and range of the data. D =>")

 = (x-4) 2 -1 2. f(x) = -2(x-3)(x+4) 3. f(x) = x 2 -2x -15 Answers:>")
