Download presentation
Presentation is loading. Please wait.

1
NASP IMDS Stand Density THE BIG THREE: Absolute stand density Quadratic Mean Diameter Basal Area

2
Graphical Guides

3
Size-Density Relationship The predictable relationship between mean size of trees and their associated density in crowded (i.e., stem exclusion) populations Density Age
 populations Density Age")
4
Boundary Line Examples (AKA: “-3/2 Power Law”) Log-log Scale
 Log-log Scale")
5
Growth Trajectories Wiley 1976

6
Stand Density Index Stand Density Index (SDI) – Woodard paper Reineke (1933) Species-specific upper limit Density when the stand has a standardized QMD Calculated as:
 – Woodard paper Reineke (1933) Species-specific upper limit Density when the stand has a standardized QMD Calculated as:")
7
Stand Density Index Values Suggested Maximum SDI by species and source. English units are number of 10-inch trees per acre. Metric units are number of 25.4cm trees per hectare. Long, J. N. 1985. A pratical approach to density management. Forest Chronicle 61:23-37. Reineke, L. H. 1933. Perfecting a stand density index for even-aged forests. Journal of Agricultural Research 46(7):627-638. Schnur, G. L. 1937. Yield, stand, and volume tables for even-aged upland oak forests. USDA Technical Bulletin No. 560, 87p.
: Schnur, G. L Yield, stand, and volume tables for even-aged upland oak forests. USDA Technical Bulletin No. 560, 87p..")
8
Stocking Charts & Guides Size vs. Density Log-Log scale SDI on the “third axis” SDI max = 1000 Taylor Woods Level-of-Growing-Stock Study Flagstaff, AZ

9
Relative Density Index Relative Density Index (RDI) Basically the percent of maximum SDI Communication across species (species have maximums) Intuitive feel Magic thresholds for stand dynamics 0.15 - 0.30 for crown closure 0.40 for scheduling of growing space thinnings 0.55 for entering “the zone of imminent competition” 0.80 for certain mortality agents
 Basically the percent of maximum SDI Communication across species (species have maximums) Intuitive feel Magic thresholds for stand dynamics for crown closure 0.40 for scheduling of growing space thinnings 0.55 for entering the zone of imminent competition 0.80 for certain mortality agents")
10
Density Guides

11
Density Management Diagrams Packaging the concepts together Simple management tool Old GSL “boat” diagrams Additional information on the diagrams

12
INTERPRETING CHANGES 150 (800 TPA, 5.1”) 653 TPA 4” 340 TPA 6”
 653 TPA TPA 6")
13
Density Guides

15
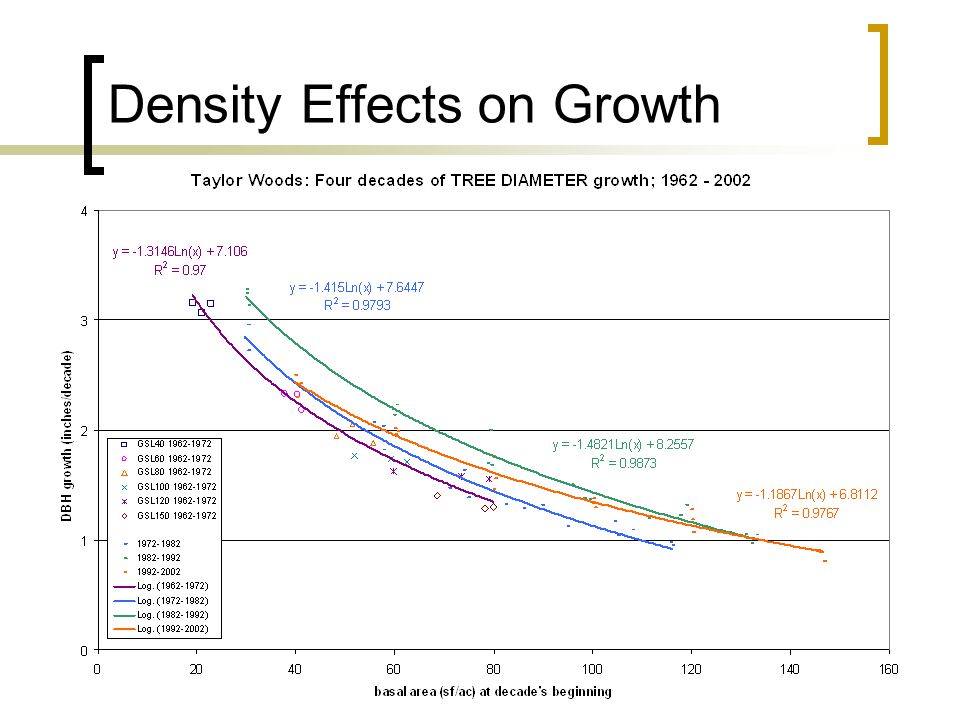
Density Effects on Growth

18
PER ACRE

19
Density Effects on Growth PER ACRE

20
DENSITY EFFECTS ON GROWTH Tree vigor and mortality rates Plasticity of the trees – think about this at “Hoskins” LOGS study (chapter 7) Live Crown Ratio and “canopy depth” Crown Radius (branch length/size) and crown closure Height:Diameter and “stability” (e.g., in wind and snow) Wood utilization products; size and quality Understory richness, diversity and abundance Net Primary Productivity distribution Ecosystem “stuff”
 Live Crown Ratio and canopy depth Crown Radius (branch length/size) and crown closure Height:Diameter and stability (e.g., in wind and snow) Wood utilization products; size and quality Understory richness, diversity and abundance Net Primary Productivity distribution Ecosystem stuff")
21
OTHER DENSITY MEASURES CURTIS’ “RELATIVE DENSITY” RD = BA √QMD RELATIVE or “AVERAGE SPACING”: (can be relative to heights, as well) TREE-AREA RATIO: area occupied by tree crowns per unit land area; TA can be estimated from D or D 2 CROWN COMPETITION FACTOR; TA relative to open grown trees
 TREE-AREA RATIO: area occupied by tree crowns per unit land area; TA can be estimated from D or D 2 CROWN COMPETITION FACTOR; TA relative to open grown trees")
22
Spacing impacts Example calculations - Douglas-fir (SDI max = 600) QMDTPABASDIRDICRD Description 6509.8220.044 low-density young plantation 620039.3880.1516 crown closure 640078.51760.2932 well-stocked 105027.3500.089 low density, but great tree growth 10200109.12000.3334 well-stocked 10400218.24000.6769 moved into "the zone" 155061.4960.1616 crown closure 15200245.43830.6463 moved into "the zone" 154004917671.28127 impossible, would have self thinned 2450157.12040.3432 well-stocked 242006288151.36128 impossible, would have self thinned 24400125716302.72257 completely crazy idea
 QMDTPABASDIRDICRD Description low-density young plantation crown closure well-stocked low density, but great tree growth well-stocked moved into the zone crown closure moved into the zone impossible, would have self thinned well-stocked impossible, would have self thinned completely crazy idea")
23
UNEVEN-AGED structures? SDI calculated by diameter class from a stand table BUT don’t stretch too far…why? TPA BAPA SDI 2 50 1 4 6 10 2 4 0 0 0 14 60 64 103 18 80 141 205 22 20 53 71 220 261 388

Similar presentations


 Sanitation and Salvage Fertilization.>")


