Download presentation
Presentation is loading. Please wait.

1
MATH221 – Statistics Group Study – How Much do People Spend on Their Monthly Commute to Work? Rose Masone Christina Rudezynski Kate Nichols Whitney Lieberman

2
Introduction Our project was to survey a sample of people to find out how much they spend commuting to work. We surveyed friends, neighbors, work associates and family via email, conversation, and phone. We thought it was important since the price of gas kept going up and up to get as much information as possible from as many people as possible.

3
We all asked the same question: Hi Everyone! “I need your help, I have a project for my Statistics class and I need to get as many answers to calculate as I can. I just need to know approximately how much you spend monthly in gas, tolls, train, bus, parking etc. for your commute to work. If you can also ask your significant other and e-mail me back I would really appreciate it! Thanks!!!” We really didn’t encounter any problems – we worked well together, everyone did their part. Communication was easy – a few minutes in class, follow up via email.

4
Rose Masone compiled all the data and figured out the mean, median, and mode and did the Introduction. Christina Rudezynski did the standard deviation. Kate Nichols did all the graphs and the initial email request. Whitney Lieberman did the Conclusion and compiled all the work into PowerPoint. We all collected the data and did research to find other data from other studies.

5
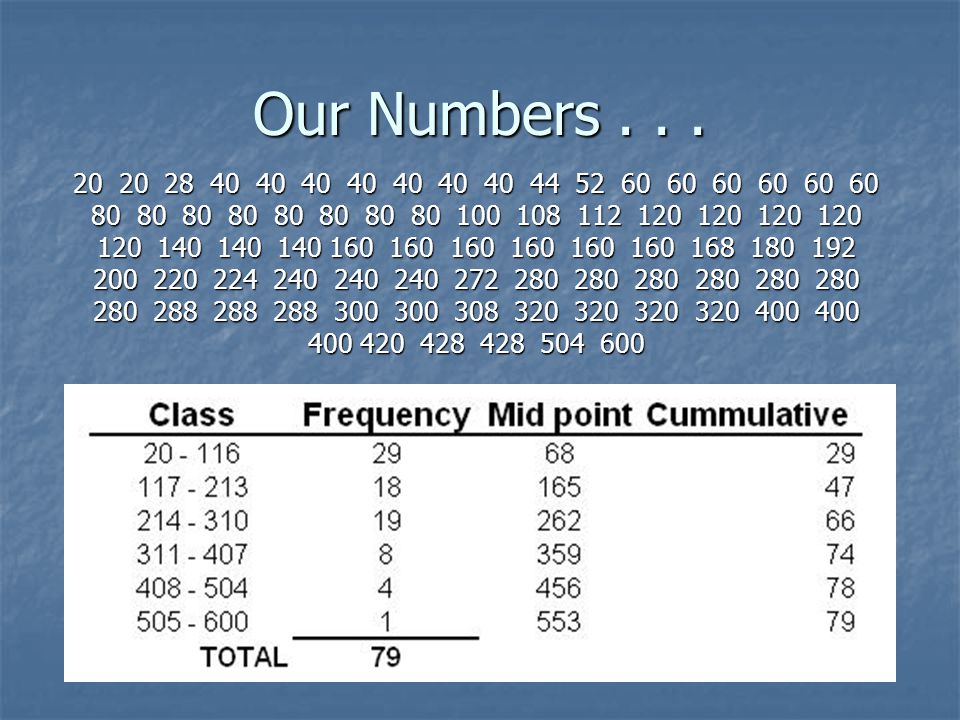
Our Numbers... 20 20 28 40 40 40 40 40 40 40 44 52 60 60 60 60 60 60 80 80 80 80 80 80 80 80 100 108 112 120 120 120 120 120 140 140 140 160 160 160 160 160 160 168 180 192 200 220 224 240 240 240 272 280 280 280 280 280 280 280 288 288 288 300 300 308 320 320 320 320 400 400 400 420 428 428 504 600
6
Mean, Median, Mode

7
Standard Deviation

8
Histogram

9
Ogive

10
Polygon

11
According to Urban Mobility Group – Seattle’s Creative Commuting resource (just to give you an idea of other commuter’s monthly spending costs) – and put it into perspective for you... The commuters there spend on average $270 dollars a month on their commute. Take a look at what the average yearly total comes to... (and this is just for parking) Unfortunately we were unable to obtain any other data on a study like this. www.urbanmobilitygroup.com
 Unfortunately we were unable to obtain any other data on a study like this.")
12
Conclusion In conclusion, although we had a severe lack of information on similar studies done on the monthly commuting costs of workers, my group and I were able to find out for ourselves (with the help of our friends, families and coworkers) what the statistics of a sample group of commuters monthly costs are, and their mean, median, mode and standard deviation as well as seeing them laid out in different types of graphs. In our opinion with the average monthly cost being around 200 dollars, monthly commuting costs don’t seem all that bad – or at least not as bad as we though they were. Although there are a few commuters out there who (as we may refer to) “spend an arm and a leg” on commuting to work, they are not the average and certainly not the majority! My group and I thoroughly enjoyed ourselves in compiling this information and working out the calculations to come up with the answers. We found it to be easy, as not only were we on top of things from day one and all chipped in to do the work, but had an immense output of support in gathering the data from the people we surveyed.
 spend an arm and a leg on commuting to work, they are not the average and certainly not the majority. My group and I thoroughly enjoyed ourselves in compiling this information and working out the calculations to come up with the answers. We found it to be easy, as not only were we on top of things from day one and all chipped in to do the work, but had an immense output of support in gathering the data from the people we surveyed..")
Similar presentations


 By. Mingyu. the people I include.. Some of 6B girls and boys Some of 6c girls and boys Some of 6D girls and boys Some of 6A.>")


