Download presentation
Presentation is loading. Please wait.

1
Bayesian Networks

2
Introduction A problem domain is modeled by a list of variables X 1, …, X n Knowledge about the problem domain is represented by a joint probability P(X 1, …, X n )
")
3
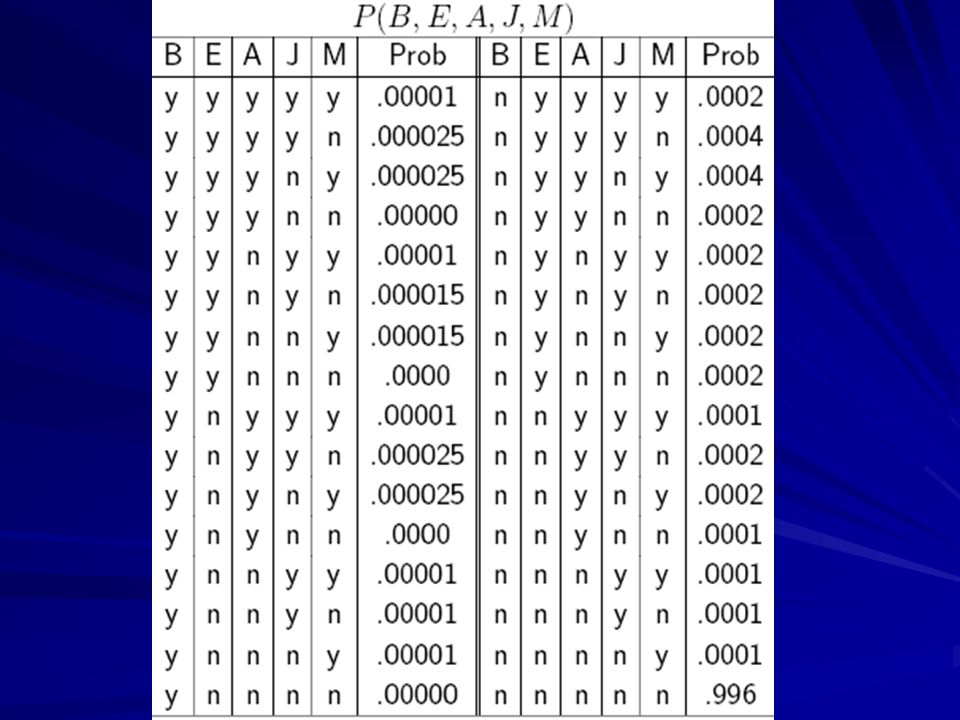
Introduction Example: Alarm The story: In LA burglary and earthquake are not uncommon. They both can cause alarm. In case of alarm, two neighbors John and Mary may call Problem: Estimate the probability of a burglary based who has or has not called Variables: Burglary (B), Earthquake (E), Alarm (A), JohnCalls (J), MaryCalls (M) Knowledge required to solve the problem: P(B, E, A, J, M)
, Earthquake (E), Alarm (A), JohnCalls (J), MaryCalls (M) Knowledge required to solve the problem: P(B, E, A, J, M).")
5
Introduction What is the probability of burglary given that Mary called, P(B = y | M = y)? Compute marginal probability: P(B, M) = E, A, J P(B, E, A, J, M) Use the definition of conditional probability Answer:
 = E, A, J P(B, E, A, J, M) Use the definition of conditional probability Answer:.")
6
Introduction Difficulty: Complexity in model construction and inference In Alarm example: –31 numbers needed –Computing P(B = y | M = y) takes 29 additions In general –P(X 1, … X n ) needs at least 2 n – 1numbers to specify the joint probability –Exponential storage and inference
 takes 29 additions In general –P(X 1, … X n ) needs at least 2 n – 1numbers to specify the joint probability –Exponential storage and inference")
7
Conditional Independence Overcome the problem of exponential size by exploiting conditional independence The chain rule of probabilities:

8
Conditional Independence Conditional independence in the problem domain: Domain usually allows to identify a subset pa(X i ) µ {X 1, …, X i – 1 } such that given pa(X i ), X i is independent of all variables in {X 1, …, X i - 1 } \ pa{X i }, i.e. P(X i | X 1, …, X i – 1 ) = P(X i | pa(X i )) Then Conditional independence in the problem domain: Domain usually allows to identify a subset pa(X i ) µ {X 1, …, X i – 1 } such that given pa(X i ), X i is independent of all variables in {X 1, …, X i - 1 } \ pa{X i }, i.e. P(X i | X 1, …, X i – 1 ) = P(X i | pa(X i )) Then
 = P(X i | pa(X i )) Then Conditional independence in the problem domain: Domain usually allows to identify a subset pa(X i ) µ {X 1, …, X i – 1 } such that given pa(X i ), X i is independent of all variables in {X 1, …, X i - 1 } \ pa{X i }, i.e. P(X i | X 1, …, X i – 1 ) = P(X i | pa(X i )) Then.")
9
Conditional Independence As a result, the joint probability P(X 1, …, X n ) can be represented as the conditional probabilities P(X i | pa(X i )) Example continued: P(B, E, A, J, M) =P(B)P(E|B)P(A|B,E)P(J|A,B,E)P(M|B,E,A,J) =P(B)P(E)P(A|B,E)P(J|A)P(M|A) pa(B) = {}, pa(E) = {}, pa(A) = {B, E}, pa{J} = {A}, pa{M} = {A} Conditional probability table specifies: P(B), P(E), P(A | B, E), P(M | A), P(J | A)
 can be represented as the conditional probabilities P(X i | pa(X i )) Example continued: P(B, E, A, J, M) =P(B)P(E|B)P(A|B,E)P(J|A,B,E)P(M|B,E,A,J) =P(B)P(E)P(A|B,E)P(J|A)P(M|A) pa(B) = {}, pa(E) = {}, pa(A) = {B, E}, pa{J} = {A}, pa{M} = {A} Conditional probability table specifies: P(B), P(E), P(A | B, E), P(M | A), P(J | A)")
10
Conditional Independence As a result: Model size reduced Model construction easier Inference easier

11
Graphical Representation To graphically represent the conditional independence relationships, construct a directed graph by drawing an arc from X j to X i iff X j pa(X i ) X j pa(X i ) pa(B) = {}, pa(E) = {}, pa(A) = {B, E}, pa{J} = {A}, pa{M} = {A} A BE JM
 X j pa(X i ) pa(B) = {}, pa(E) = {}, pa(A) = {B, E}, pa{J} = {A}, pa{M} = {A} A BE JM")
12
Graphical Representation We also attach the conditional probability table P(X i | pa(X i )) to node X i The result: Bayesian network A BE JM P(B)P(E) P(J | A) P(M | A) P(A | B, E)
) to node X i The result: Bayesian network A BE JM P(B)P(E) P(J | A) P(M | A) P(A | B, E)")
13
Formal Definition A Bayesian network is: An acyclic directed graph (DAG), where Each node represents a random variable And is associated with the conditional probability of the node given its parents
, where Each node represents a random variable And is associated with the conditional probability of the node given its parents")
14
Intuition A BN can be understood as a DAG where arcs represent direct probability dependence Absence of arc indicates probability independence: a variable is conditionally independent of all its nondescendants given its parents From the graph: B ? E, J ? B | A, J ? E | A A BE JM

15
Construction Procedure for constructing BN: Choose a set of variables describing the application domain Choose an ordering of variables Start with empty network and add variables to the network one by one according to the ordering

16
Construction To add i-th variable X i : –Determine pa(X i ) of variables already in the network (X 1, …, X i – 1 ) such that P(X i | X 1, …, X i – 1 ) = P(X i | pa(X i )) (domain knowledge is needed there) –Draw an arc from each variable in pa(X i ) to X i
 of variables already in the network (X 1, …, X i – 1 ) such that P(X i | X 1, …, X i – 1 ) = P(X i | pa(X i )) (domain knowledge is needed there) –Draw an arc from each variable in pa(X i ) to X i")
17
Example Order: B, E, A, J, M –pa(B)=pa(E)={}, pa(A)={B,E}, pa(J)={A}, pa{M}={A} Order: M, J, A, B, E –pa{M}={}, pa{J}={M}, pa{A}={M,J}, pa{B}={A}, pa{E}={A,B} Order: M, J, E, B, A –Fully connected graph A BE JM A B E J M A B E J M
=pa(E)={}, pa(A)={B,E}, pa(J)={A}, pa{M}={A} Order: M, J, A, B, E –pa{M}={}, pa{J}={M}, pa{A}={M,J}, pa{B}={A}, pa{E}={A,B} Order: M, J, E, B, A –Fully connected graph A BE JM A B E J M A B E J M")
18
Construction Which variable order? Naturalness of probability assessment M, J, E, B, A is bad because of P(B | J, M, E) is not natural Minimize number of arcs M, J, E, B, A is bad (too many arcs), the first is good Use casual relationship: cause come before their effects M, J, E, B, A is bad because M and J are effects of A but come before A A BE JM A B E J M VS
 is not natural Minimize number of arcs M, J, E, B, A is bad (too many arcs), the first is good Use casual relationship: cause come before their effects M, J, E, B, A is bad because M and J are effects of A but come before A A BE JM A B E J M VS.")
19
Casual Bayesian Networks A causal Bayesian network, or simply causal networks, is a Bayesian network whose arcs are interpreted as indicating cause-effect relationships Build a causal network: – –Choose a set of variables that describes the domain – –Draw an arc to a variable from each of its direct causes (Domain knowledge required)
")
20
Example Visit Africa Tuberculosis X-Ray Smoking Lung Cancer Bronchitis Dyspnea Tuberculosis or Lung Cancer

21
Casual BN Causality is not a well understood concept. – –No widely accepted denition. – –No consensus on whether it is a property of the world or a concept in our minds Sometimes causal relations are obvious: – –Alarm causes people to leave building. – –Lung Cancer causes mass on chest X-ray. At other times, they are not that clear. Doctors believe smoking causes lung cancer but the tobacco industry has a different story: SC Surgeon General (1964) * CS Tobacco Industry
 * CS Tobacco Industry.")
22
Inference Posterior queries to BN –We have observed the values of some variables –What are the posterior probability distributions of other variables? Example: Both John and Mary reported alarm –What is the probability of burglary P(B|J=y,M=y)?
 .")
23
Inference General form of query P(Q | E = e) = ? Q is a list of query variables E is a list of evidence variables e denotes observed variables

24
Inference Types Diagnostic inference: P(B | M = y) Predictive/Casual Inference: P(M | B = y) Intercasual inference (between causes of a common effect) P(B | A = y, E = y) Mixed inference (combining two or more above) P(A | J = y, E = y) (diagnostic and casual) All the types are handled in the same way
 Predictive/Casual Inference: P(M | B = y) Intercasual inference (between causes of a common effect) P(B | A = y, E = y) Mixed inference (combining two or more above) P(A | J = y, E = y) (diagnostic and casual) All the types are handled in the same way")
25
Naïve Inference Naïve algorithm for solving P(Q|E = e) in BN Get probability distribution P(X) over all variables X by multiplying conditional probabilities BN structure is not used, for many variables the algorithm is not practical Generally exact inference is NP-hard
 in BN Get probability distribution P(X) over all variables X by multiplying conditional probabilities BN structure is not used, for many variables the algorithm is not practical Generally exact inference is NP-hard")
26
Basic Example Conditional Probabilities: P(A),P(B|A),P(C|B),P(D|C) Query: P(D) = ? P(D) = A, B, C P(A, B, C, D) = A, B, C P(A)P(B|A)P(C|B)P(D|C) (1) = C P(D|C) B P(C|B) A P(A)P(B|A) (2) Complexity: –Use (1): 2 3 + 2 2 + 2 –Use (2): 2 + 2 + 2 ABCD
 = A, B, C P(A, B, C, D) = A, B, C P(A)P(B|A)P(C|B)P(D|C) (1) = C P(D|C) B P(C|B) A P(A)P(B|A) (2) Complexity: –Use (1): –Use (2): ABCD.")
27
Inference Though generally exact inference is NP- hard, in some cases the problem is tractable, e.g. if BN has a (poly)-tree structure efficient algorithm exists (a poly tree is a directed acyclic graph in which no two nodes have more than one path between them) Another practical approach: Stochastic Simulation
-tree structure efficient algorithm exists (a poly tree is a directed acyclic graph in which no two nodes have more than one path between them) Another practical approach: Stochastic Simulation.")
28
A general sampling algorithm For i = 1 to n 1.Find parents of X i (X p(i, 1), …, X p(i, n) ) 2.Recall the values that those parents where randomly given 3.Look up the table for P(X i | X p(i, 1) = x p(i, 1), …, X p(i, n) = x p(i, n) ) 4.Randomly set x i according to this probability
, …, X p(i, n) ) 2.Recall the values that those parents where randomly given 3.Look up the table for P(X i | X p(i, 1) = x p(i, 1), …, X p(i, n) = x p(i, n) ) 4.Randomly set x i according to this probability")
29
Stochastic Simulation We want to know P(Q = q| E = e) Do a lot of random samplings and count –N c : Num. samples in which E = e –N s : Num. samples in which Q = q and E = e –N: number of random samples If N is big enough –N c / N is a good estimate of P(E = e) –N s / N is a good estimate of P(Q = q, E = e) –N s / N c is then a good estimate of P(Q = q | E = e)
 –N s / N is a good estimate of P(Q = q, E = e) –N s / N c is then a good estimate of P(Q = q | E = e).")
30
Parameter Learning Example: –given a BN structure –A dataset –Estimate conditional probabilities P(X i | pa(X i )) X1X1 X3X3 X5X5 X4X4 X2X2 X1X1X1X1 X2X2X2X2 X3X3X3X3 X4X4X4X4 X5X5X5X5 00110 10010 0?00? …………… ? means missing values

31
Parameter Learning We consider cases with full data Use maximum likelihood (ML) algorithm and bayesian estimation Mode of learning: –Sequential learning –Batch learning Bayesian estimation is suitable both for sequential and batch learning ML is suitable only for batch learning
 algorithm and bayesian estimation Mode of learning: –Sequential learning –Batch learning Bayesian estimation is suitable both for sequential and batch learning ML is suitable only for batch learning")
32
ML in BN with Complete Data n variables X 1, …, X n Number of states of X i : r i = | X i | Number of configurations of parents of X i : q i = | pa(X i ) | Parameters to be estimated: ijk =P(X i = j | pa(X i ) = k), i = 1, …, n; j = 1, …, r i ; k = 1, …, q i
 | Parameters to be estimated: ijk =P(X i = j | pa(X i ) = k), i = 1, …, n; j = 1, …, r i ; k = 1, …, q i")
33
ML in BN with Complete Data Example: consider a BN. Assume all variables are binary taking values 1, 2. ijk =P(X i = j | pa(X i ) = k) X1X1 X3X3 X2X2 Number of parents configuration
 = k) X1X1 X3X3 X2X2 Number of parents configuration.")
34
ML in BN with Complete Data A complete case: D l is a vector of values, one for each variable (all data is known). Example: D l = (X 1 = 1, X 2 = 2, X 3 = 2) Given: A set of complete cases: D = {D 1, …, D m } Find: the ML estimate of the parameters
 Given: A set of complete cases: D = {D 1, …, D m } Find: the ML estimate of the parameters .")
35
ML in BN with Complete Data Loglikelihood: l( | D) = log L( | D) = log P(D | ) = log l P(D l | ) = l log P(D l | ) The term log P(D l | ): –D 4 = (1, 2, 2) log P(D 4 | ) = log P(X 1 = 1, X 2 = 2, X 3 = 2 | ) = log P(X 1 =1 | ) P(X 2 =2 | ) P(X 3 =2 | X 1 =1, X 2 =2, ) = log 111 + log 221 + log 322 = log P(X 1 =1 | ) P(X 2 =2 | ) P(X 3 =2 | X 1 =1, X 2 =2, ) = log 111 + log 221 + log 322 Recall: ={ 111, 121, 211, 221, 311, 312, 313, 314, 321, 322, 323, 324 X1X1 X3X3 X2X2
 = log L( | D) = log P(D | ) = log l P(D l | ) = l log P(D l | ) The term log P(D l | ): –D 4 = (1, 2, 2) log P(D 4 | ) = log P(X 1 = 1, X 2 = 2, X 3 = 2 | ) = log P(X 1 =1 | ) P(X 2 =2 | ) P(X 3 =2 | X 1 =1, X 2 =2, ) = log log log 322 = log P(X 1 =1 | ) P(X 2 =2 | ) P(X 3 =2 | X 1 =1, X 2 =2, ) = log log log 322 Recall: ={ 111, 121, 211, 221, 311, 312, 313, 314, 321, 322, 323, 324 X1X1 X3X3 X2X2")
36
ML in BN with Complete Data Define the characteristic function of D l : When l = 4, D 4 = {1, 2, 2} (1,1,1:D 4 )= (2,2,1:D 4 )= (3,2,2:D 4 )=1, (i, j, k: D 4 ) = 0 for all other i, j, k So, log P(D 4 | ) = ijk (i, j, k: D 4 ) log ijk In general, log P(D l | ) = ijk (i, j, k: D l ) log ijk X1X1 X3X3 X2X2
= (2,2,1:D 4 )= (3,2,2:D 4 )=1, (i, j, k: D 4 ) = 0 for all other i, j, k So, log P(D 4 | ) = ijk (i, j, k: D 4 ) log ijk In general, log P(D l | ) = ijk (i, j, k: D l ) log ijk X1X1 X3X3 X2X2")
37
ML in BN with Complete Data Define: m ijk = l (i, j, k: D l ) the number of data cases when X i = j and pa(X i ) = k Then l( | D) = l log P(D l | ) = l i, j, k (i, j, k : D l ) log ijk = i, j, k l (i, j, k : D l ) log ijk = i, j, k m ijk log ijk = i,k j m ijk log ijk
 the number of data cases when X i = j and pa(X i ) = k Then l( | D) = l log P(D l | ) = l i, j, k (i, j, k : D l ) log ijk = i, j, k l (i, j, k : D l ) log ijk = i, j, k m ijk log ijk = i,k j m ijk log ijk")
38
ML in BN with Complete Data We want to find: argmax l( | D) = argmax i,k j m ijk log ijk ijk Assume that ijk = P(X i = j | pa(X i ) = k) is not related to i’j’k’ provided that i i’ OR k k’ Consequently we can maximize separately each term in the summation i, k […] argmax j m ijk log ijk ijk
![ML in BN with Complete Data We want to find: argmax l( | D) = argmax i,k j m ijk log ijk ijk Assume that ijk = P(X i = j | pa(X i ) = k) is not related to i’j’k’ provided that i i’ OR k k’ Consequently we can maximize separately each term in the summation i, k […] argmax j m ijk log ijk ijk](http://images.slideplayer.com/15/4511491/slides/slide_38.jpg "ML in BN with Complete Data We want to find: argmax l( | D) = argmax i,k j m ijk log ijk ijk Assume that ijk = P(X i = j | pa(X i ) = k) is not related to i’j’k’ provided that i i’ OR k k’ Consequently we can maximize separately each term in the summation i, k […] argmax j m ijk log ijk ijk")
39
ML in BN with Complete Data As a result we have: In words, the ML estimate for ijk = P( X i = j | pa(X i ) = k) is number of cases where X i =j and pa(X i ) = k number of cases where pa(X i ) = k
 = k) is number of cases where X i =j and pa(X i ) = k number of cases where pa(X i ) = k")
40
More to do with BN Learning parameters with some values missing Learning the structure of BN from training data Many more…

41
References Pearl, Judea, Probabilistic Reasoning in Intelligent Systems: Networks of Plausible Inference, Morgan Kaufmann, San Mateo, CA, 1988. Heckerman, David, "A Tutorial on Learning with Bayesian Networks," Technical Report MSR-TR-95-06, Microsoft Research, 1995. www.ai.mit.edu/~murphyk/Software http://www.cs.ubc.ca/~murphyk/Bayes/bnintro.html R. G. Cowell, A. P. Dawid, S. L. Lauritzen and D. J. Spiegelhalter. "Probabilistic Networks and Expert Systems". Springer-Verlag. 1999. http://www.ets.org/research/conferences/almond2004.html#software

Similar presentations


 March, 16, 2009.>")


 – Section 2.11>")

 Capturing uncertain knowledge Probabilistic.>")


 = ?>")

