Download presentation
Presentation is loading. Please wait.

1
Patterns of Age Mixing among American Men and Women Julie R. Kraut-Becher University of Pennsylvania Sevgi O. Aral Centers for Disease Control and Prevention

2
Background Relationship between age mixing and: Relationship between age mixing and: –Early sex initiation –Inconsistent condom use –Unplanned pregnancy –Risk of HIV and other STIs Existing studies Existing studies –Women –1990s and earlier Gaps in literature Gaps in literature –Little is known about trends –Whether they exist among men

3
Objectives Assess extent and correlates of age mixing among men and women Assess extent and correlates of age mixing among men and women Examine trends in age mixing patterns among women Examine trends in age mixing patterns among women

4
Methods National Survey of Family Growth (NSFG) National Survey of Family Growth (NSFG) –Nationally-representative samples of reproductive-age men & women –2002 (men and women) –1995 (women) NFSG Samples NFSG Samples –N = 4,928 males (2002) Study N = 4,109 males –N = 7,643 Females (2002) Study N = 6,186 females –N = 10,847 Females (1995) Study N = 9,272 females Age difference between partners Age difference between partners
 National Survey of Family Growth (NSFG) –Nationally-representative samples of reproductive-age men & women –2002 (men and women) –1995 (women) NFSG Samples NFSG Samples –N = 4,928 males (2002) Study N = 4,109 males –N = 7,643 Females (2002) Study N = 6,186 females –N = 10,847 Females (1995) Study N = 9,272 females Age difference between partners Age difference between partners")
5
Methods Assess extent of age mixing Assess extent of age mixing Describe patterns of age mixing Describe patterns of age mixing –Sociodemographic and socioeconomic characteristics –STI history Nationally representative sample Nationally representative sample –Sample weights

6
2002 Males (N = 4,109) Female partner age %ageEducation%age >= 3 years older >= 3 years older13.9 < High School < High School17.6 0-2 years older or younger 0-2 years older or younger53.1 High School Diploma or GED High School Diploma or GED33.3 3-5 years younger 3-5 years younger19.5 Some College, No Degree Some College, No Degree20.4 >= 6 years younger >= 6 years younger13.6 College Degree College Degree21.8 Age Grad Degree or Professional Grad Degree or Professional7.0 15-17 15-173.4Income 18-19 18-195.4 0 - 99% of poverty 0 - 99% of poverty13.6 20-24 20-2416.2 100 - 499% of poverty 100 - 499% of poverty69.2 25-29 25-2916.6 >= 500% of poverty >= 500% of poverty17.2 30-34 30-3418.4 # of Sex Partners <= 12 Months 35-39 35-3919.4 09.4 40-44 40-4420.5 172.7 Race/ethnicity 2 – 3 2 – 313.1 Non-Hispanic Black Non-Hispanic Black12.3 >= 4 >= 44.8 Non-Hispanic White Non-Hispanic White64.8 STI Treat/Meds <= 12 Months Hispanic Hispanic17.2 Yes Yes1.6 Other Other5.7 No No98.4
 Female partner age %ageEducation%age >= 3 years older >= 3 years older13.9 < High School < High School years older or younger 0-2 years older or younger53.1 High School Diploma or GED High School Diploma or GED years younger 3-5 years younger19.5 Some College, No Degree Some College, No Degree20.4 >= 6 years younger >= 6 years younger13.6 College Degree College Degree21.8 Age Grad Degree or Professional Grad Degree or Professional Income % of poverty % of poverty % of poverty % of poverty >= 500% of poverty >= 500% of poverty # of Sex Partners <= 12 Months Race/ethnicity 2 – 3 2 – Non-Hispanic Black Non-Hispanic Black12.3 >= 4 >= 44.8 Non-Hispanic White Non-Hispanic White64.8 STI Treat/Meds <= 12 Months Hispanic Hispanic17.2 Yes Yes1.6 Other Other5.7 No No98.4")
7
2002 Females (N = 6,186) Male partner age %ageEducation%age >= 3 years younger >= 3 years younger11.7 < High School < High School13.1 0-2 years older or younger 0-2 years older or younger51.7 High School Diploma or GED High School Diploma or GED30.6 3-5 years older 3-5 years older15.4 Some College, No Degree Some College, No Degree23.1 >= 6 years older >= 6 years older21.2 College Degree College Degree26.8 Age Grad Degree or Professional Grad Degree or Professional6.4 15-17 15-170.2Income 18-19 18-195.3 0 - 99% of poverty 0 - 99% of poverty17.7 20-24 20-2416.2 100 - 499% of poverty 100 - 499% of poverty69.6 25-29 25-2916.9 >= 500% of poverty >= 500% of poverty12.7 30-34 30-3419.4 # of Sex Partners <= 12 Months 35-39 35-3920.5 07.7 40-44 40-4421.6 181.0 Race/ethnicity 2 – 3 2 – 39.4 Non-Hispanic Black Non-Hispanic Black13.4 >= 4 >= 41.9 Non-Hispanic White Non-Hispanic White67.0 STI Treat/Meds <= 12 Months Hispanic Hispanic14.5 Yes Yes2.2 Other Other5.1 No No97.8
 Male partner age %ageEducation%age >= 3 years younger >= 3 years younger11.7 < High School < High School years older or younger 0-2 years older or younger51.7 High School Diploma or GED High School Diploma or GED years older 3-5 years older15.4 Some College, No Degree Some College, No Degree23.1 >= 6 years older >= 6 years older21.2 College Degree College Degree26.8 Age Grad Degree or Professional Grad Degree or Professional Income % of poverty % of poverty % of poverty % of poverty >= 500% of poverty >= 500% of poverty # of Sex Partners <= 12 Months Race/ethnicity 2 – 3 2 – 39.4 Non-Hispanic Black Non-Hispanic Black13.4 >= 4 >= 41.9 Non-Hispanic White Non-Hispanic White67.0 STI Treat/Meds <= 12 Months Hispanic Hispanic14.5 Yes Yes2.2 Other Other5.1 No No97.8")
8
1995 Females (N = 9,272) Male partner age %ageEducation%age >= 3 years younger >= 3 years younger8.6 < High School < High School15.9 0-2 years older or younger 0-2 years older or younger51.9 High School High School37.8 3-5 years older 3-5 years older21.3 > High School > High School46.3 >= 6 years older >= 6 years older18.2Income Age 0 - 99% of poverty 0 - 99% of poverty28.5 15-17 15-17 3.9 3.9 100 - 499% of poverty 100 - 499% of poverty30.1 18-19 18-19 4.7 4.7 >= 500% of poverty >= 500% of poverty41.4 20-24 20-2414.9 STI Diagnosis 25-29 25-2917.7 Ever Ever11.4 30-34 30-3420.0 Never Never88.6 35-39 35-3920.7 STI Test/Treat <= 12 Months 40-44 40-4418.1 Yes Yes 8.5 8.5 Race/ethnicity No No91.5 Black Black13.1 White White71.5 Other Other15.4
 Male partner age %ageEducation%age >= 3 years younger >= 3 years younger8.6 < High School < High School years older or younger 0-2 years older or younger51.9 High School High School years older 3-5 years older21.3 > High School > High School46.3 >= 6 years older >= 6 years older18.2Income Age % of poverty % of poverty % of poverty % of poverty >= 500% of poverty >= 500% of poverty STI Diagnosis Ever Ever Never Never STI Test/Treat <= 12 Months Yes Yes Race/ethnicity No No91.5 Black Black13.1 White White71.5 Other Other15.4")
17
Limitations Descriptive Descriptive STI reports are self-reported STI reports are self-reported Composition of questionnaires differ Composition of questionnaires differ –Between 1995 and 2002 (Women) –Between the male and female surveys in 2002
 –Between the male and female surveys in 2002")
18
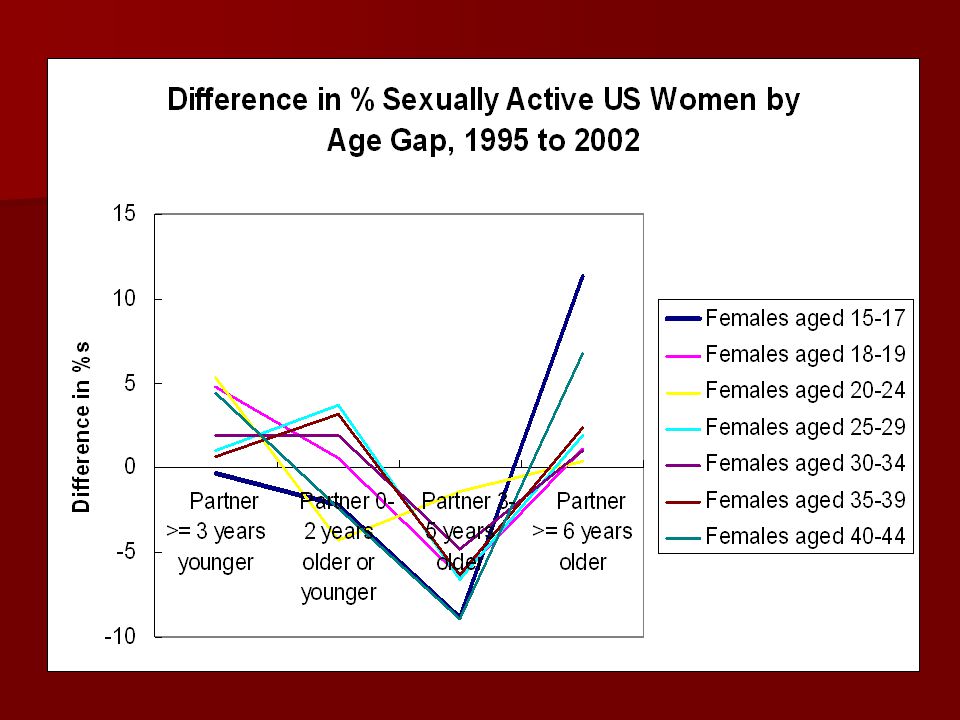
Conclusions Summary Summary –Majority of men and women have partners close in age –For those who do not: Men more likely to have younger (by 3 -5 years) female partners Women more likely to have older (by 6 or more years) partners Trends: Women (1995 – 2002) Trends: Women (1995 – 2002) –Women are having older partners Shift from having partners 3-5 years older to having partners >= 6 years older Especially adolescent females
 female partners Women more likely to have older (by 6 or more years) partners Trends: Women (1995 – 2002) Trends: Women (1995 – 2002) –Women are having older partners Shift from having partners 3-5 years older to having partners >= 6 years older Especially adolescent females")
19
Contact Information Please send any comments or suggestions to: Please send any comments or suggestions to:julie6@mail.med.upenn.edu

Similar presentations


>")
>")


 and Men Who Have Sex with Men and Women (MSMW), Georgia, 2012.>")
 Tamara Halle, Nicole Forry, Elizabeth Hair & Kate Perper.>")


