Download presentation
Presentation is loading. Please wait.

1
High-Type Bituminous Pavements
Dr. TALEB M. AL-ROUSAN

2
High-Type Bituminous Pavements
HMA Widely used in urban & rural areas. If properly designed & constructed, HMA pavements can carry very high volumes. Majority have economic life of 20 years. Prepared in hot mix plants. Thickness vary.

3
Fundamental Properties of Design
Stability: Property of compacted mixture that enables it to withstand the stresses imposed on it by moving wheel loads with sustaining substantial permanent deformation. Durability: Property of compacted mixture to withstand the detrimental effects of air, water, & temperature changes.

4
Density of HMA Both stability & durability are related to the density of the mix. Density is expressed in terms of voids in the mixture. Voids: Amount of space in the compacted mixture that is not filled with aggregates or bituminous materials (i.e. filled with air). Dense mixture…….low voids Loose mixture…….high voids Extent of voids is determined by % of AC in the mix.
. Dense mixture…….low voids. Loose mixture…….high voids. Extent of voids is determined by % of AC in the mix.")
5
Goal of Mix Design Determine the best or optimum asphalt content that will provide the required stability & durability as well as additional desirable properties such as impermeability, workability, & resistance to bleeding.

6
Stability & Density Density & stability increase as AC% increase up to a point where they will start to decrease because aggregates will be forced apart by excess of bituminous materials. It is not practical to say that the best AC would be the one that would just fill the voids in the compacted mixture. Raise in Temperature……AC expand…..AC overfill the voids……Bleeding…… loss in stability. Traffic……Raise density……Reduce voids……Excess AC…….. Bleeding……..Loss in stability. Compromise is needed when selecting optimum AC%.

7
Requirements of HMA Sufficient asphalt to ensure a durable pavement
Sufficient stability under traffic loads Sufficient air voids in the compacted mix Upper limit to prevent excessive environmental damage (permeation of harmful air & moisture). Lower limit to allow room for initial densification due to traffic, and slight amount of asphalt expansion due to temperature increase. Sufficient workability to permit efficient placement of the mix without segregation & without sacrificing stability & performance. For surface mixes, proper aggregate texture & hardness to provide sufficient skid resistance in unfavorable weather conditions.
. Lower limit to allow room for initial densification due to traffic, and slight amount of asphalt expansion due to temperature increase. Sufficient workability to permit efficient placement of the mix without segregation & without sacrificing stability & performance. For surface mixes, proper aggregate texture & hardness to provide sufficient skid resistance in unfavorable weather conditions.")
8
Classification of Hot-Mix Paving
According to Asphalt Institute: Asphalt paving mixtures are designed & produced using wide range of aggregate types & sizes. Asphalt concrete = HMA= Intimate mixture of coarse & fine aggregates, mineral filler, and asphalt cement. Mixes are classified based on aggregate gradation used in the mix (i.e. Uniform graded, Open graded, Gap graded, Coarse graded, fine graded.

9
Classification of Hot-Mix Paving Cont.
Other grades Sheet asphalt: AC + Fine Agg. + Mineral filler (Surface mixtures) Sand asphalt: AC + Sand (with/without mineral filler) Mixes are designated also according to use in layered system: Surface mixes: Upper layer Base mixes: Layer above subbase or subgrade Leveling mixes: Intermediate (to eliminate irregularities in existing surfaces prior to new layer).
 Sand asphalt: AC + Sand (with/without mineral filler) Mixes are designated also according to use in layered system: Surface mixes: Upper layer. Base mixes: Layer above subbase or subgrade. Leveling mixes: Intermediate (to eliminate irregularities in existing surfaces prior to new layer).")
10
Materials for Asphalt Concrete Paving Mixes
Coarse Aggregates Retain #8 (Asphalt Institute), or #10. Function in stability by interlocking & frictional resistance. Crushed stone, crushed gravel, crushed slag. Should be hard, durable, and clean. Fine Aggregates Pass #8 retained # 200 Crushed materials and sand. Void filling of coarse aggregates.
, or #10. Function in stability by interlocking & frictional resistance. Crushed stone, crushed gravel, crushed slag. Should be hard, durable, and clean. Fine Aggregates. Pass #8 retained # 200. Crushed materials and sand. Void filling of coarse aggregates.")
11
Materials for Asphalt Concrete Paving Mixes
Mineral Filler Pass # 200 Function in voids filling Limestone dust, Portland cement, Slag, Dolomite dust. Required to be dry & free from lumps. Hydrophobic in nature Bituminous Materials Semi solid asphalt cement (AC) More viscous grade (AC-20, AC-40) recommended for high traffic & hot climates. AC-2.5, AC-5 used in medium or low traffic in cold regions. Various Specifications are available for aggregate gradations and composition for base, binder, and surface course (see Table 19.1 in Text).
 More viscous grade (AC-20, AC-40) recommended for high traffic & hot climates. AC-2.5, AC-5 used in medium or low traffic in cold regions. Various Specifications are available for aggregate gradations and composition for base, binder, and surface course (see Table 19.1 in Text).")
12
Job Mix Formula Composition of the mix must be established
Job Mix Formula (JMF) = Design of the mixture. See Table 19.2 in Text for JMF tolerance. JMF is determined in two steps: Selection & combination of aggregates to meet limits of specifications. Determination of optimum asphalt content.
 = Design of the mixture. See Table 19.2 in Text for JMF tolerance. JMF is determined in two steps: Selection & combination of aggregates to meet limits of specifications. Determination of optimum asphalt content.")
13
Selection & Combination of Aggregates
In normal procedure…..coarse & fine aggregates in the vicinity of the project site are sampled & examined…..If suitable can be used…… Economical alternative….. If not…….Suitable aggregate source should be found. Combine aggregates (Determine proportions of the separate aggregates to give a combination that meet spec.) Proportions must be far from extreme to provide room for JMF tolerance. Process: Trial & Error with critical sieve selection for start with values. Spread sheet (Excel) See Tables 19.4 & 19.5 in Text for example.
 Proportions must be far from extreme to provide room for JMF tolerance. Process: Trial & Error with critical sieve selection for start with values. Spread sheet (Excel) See Tables 19.4 & 19.5 in Text for example.")
14
Determination of Optimum Asphalt Content
Lab procedure: Prepare trial mixtures using selected aggregate proportions with various percentages of AC within limits of mix spec. Each trial mix is prepared to secure high density. Density, stability, and other properties are then determined Three mix design methods: Marshall Hveem SuperPave Methods differ in: compaction procedure and strength tests.

15
MARSHALL MIX DESIGN

16
Marshall Mix Design Developed by Bruce Marshall for the Mississippi Highway Department in the late 30’s US Army Corps of Engineers (WES) began to study it in 1943 for WWII (airfields) Evaluated compaction effort No. of blows, foot design, etc. Decided on 10 lb.. Hammer, 50 blows/side, 18” drop 4% voids after traffic Initial criteria were established and upgraded for increased tire pressures and loads Procedure is valid for max aggregate size of 1.0 inch when using a 4.o inch diameter mold. Sizes bigger than 1.0 inch require the use of modified Marshall procedure.
 began to study it in 1943 for WWII (airfields) Evaluated compaction effort. No. of blows, foot design, etc. Decided on 10 lb.. Hammer, 50 blows/side, 18 drop. 4% voids after traffic. Initial criteria were established and upgraded for increased tire pressures and loads. Procedure is valid for max aggregate size of 1.0 inch when using a 4.o inch diameter mold. Sizes bigger than 1.0 inch require the use of modified Marshall procedure.")
17
Marshall Mix Design Procedure
Step 1: Aggregate Evaluation Determine acceptability of aggregate for use in HMA (L.A. Abrasion, Soundness, Sand Equivalent, Flat & Elongated, % Crushed faces, …). If aggregate accepted, perform the following aggregate tests: Gradation, S.G.,& absorption. Perform blending calculations (deviate from max. density line to increase VMA). Prepare specimen weigh-out table by multiplying % aggregate retained between sieves times aggregate weight (1150g), then determine cumulative weights.
. If aggregate accepted, perform the following aggregate tests: Gradation, S.G.,& absorption. Perform blending calculations (deviate from max. density line to increase VMA). Prepare specimen weigh-out table by multiplying % aggregate retained between sieves times aggregate weight (1150g), then determine cumulative weights.")
18
Marshall Mix Design Procedure Cont.
Step 2: Asphalt cement evaluation Determine appropriate asphalt cement grade for type & geographic location. Verify that spec. properties are acceptable. Determine AC viscosity & S.G. Plot viscosity data on Temperature - Viscosity plot. Determine mixing & compaction temperature ranges from plot. Mixing viscosity range ( CSt) Compaction viscosity range ( Cst).
 Compaction viscosity range ( Cst).")
19
Mixing/Compaction Temps
Viscosity, Pa s 10 5 1 .5 .3 Compaction Range .2 To establish mixing and compaction temperatures it is necessary to develop a temperature viscosity chart. This can be done by determining the viscosity at two different temperatures - generally 135 and 165 C. These two viscosities are then plotted on the graph above and a straight line is drawn between the two points. The desired viscosity range for mixing is between 0.15 and 0.19 Pa-s and 0.25 and 0.31 Pa-s for compaction. Appropriate mixing and compaction temperatures are selected as the temperature where these viscosity requirements are met. This information can be obtained from the suppliers. In many DOTs this information is developed during the mix design process. If using modified binders - it is recommended that to contact the supplier to determine the mixing and compaction temperatures. Mixing Range .1 100 110 120 130 140 150 160 170 180 190 200 Temperature, C

20
Marshall Mix Design Procedure Cont.
Step 3: Preparation of Marshal Specimen Dry, then sieve aggregates into sizes (individual sizes), at least 18 samples (1150 g), total of 25 kg & 4 liters of AC. Weigh out 18 specimens in separate containers and heat to mixing temperature. Prepare trial mix to check specimen height (2.5 inch ), adjust quantity of aggregate by Q = (2.5/h1)* 1150. Heat sufficient AC to prepare a total of 18 specimens
, at least 18 samples (1150 g), total of 25 kg & 4 liters of AC. Weigh out 18 specimens in separate containers and heat to mixing temperature. Prepare trial mix to check specimen height (2.5 inch ), adjust quantity of aggregate by Q = (2.5/h1)* Heat sufficient AC to prepare a total of 18 specimens.")
21
Marshall Mix Design Procedure Cont.
Prepare (3) (5) different AC contents. AC should be (0.5%) increments (2 above optimum AC & 2 below optimum AC). Optimum is decided based on experience. Prepare three loose mixture specimens near optimum AC to measure Rice or Maximum theoretical S.G. (TMD = Theoretical Max density). Note: Some agencies require that Rice S.G. conducted at all asphalt contents. Precision is better when mixture is close to optimum. Marshall mold is (4inch diameter X 2.5 inch height).
 (5) different AC contents. AC should be (0.5%) increments (2 above optimum AC & 2 below optimum AC). Optimum is decided based on experience. Prepare three loose mixture specimens near optimum AC to measure Rice or Maximum theoretical S.G. (TMD = Theoretical Max density). Note: Some agencies require that Rice S.G. conducted at all asphalt contents. Precision is better when mixture is close to optimum. Marshall mold is (4inch diameter X 2.5 inch height).")
22
Marshall Mix Design Procedure Cont.
Determine appropriate number of blows/side according to spec. Remove hot aggregate….place on scale….Add proper wt. of AC to obtain desired AC content. Mix AC & aggregates until all aggregates are uniformly coated. Check temperature before compaction, if higher, allow to cool……..if lower, discard & make other mix. Place paper disc into preheated Marshall mold and poor in loose HMA. Fill the mold and attach the mold and base plate to pedestal. Place the preheated hammer into the mold and apply appropriate number of blows to both sides.

23
Place bowl on mixer and mix until aggregate is well-coated
Mixing Place bowl on mixer and mix until aggregate is well-coated The mixture is typically mixed in a mechanical mixer. The mix should be observed to insure that the aggregate and asphalt are thoroughly mixed.

24
Marshall Design Criteria
Light Traffic Medium Traffic Heavy Traffic ESAL < < ESAL< ESAL > 106 Compaction Stability N (lb.) (750) 5338 (1200) (1800) Flow, 0.25 mm (0.1 in) to to to 14 Air Voids, % to to to 5 Voids in Mineral Agg. (VMA) Varies with aggregate size Voids Filled w/Asph to to to 75 (VFA) [some agencies] The criteria for mix design will change depending on the traffic level. As the traffic increases there is a need for a more stable mixture.
 3336 (750) 5338 (1200) 8006 (1800) Flow, 0.25 mm (0.1 in) 8 to 18 8 to 16 8 to 14. Air Voids, % 3 to 5 3 to 5 3 to 5. Voids in Mineral Agg. (VMA) Varies with aggregate size. Voids Filled w/Asph 70 to to to 75. (VFA) [some agencies] The criteria for mix design will change depending on the traffic level. As the traffic increases there is a need for a more stable mixture.")
25
Minimum VMA Requirements
As the aggregate size increases the VMA requirement decreases. The difference between VMA and VTM is the volume of asphalt cement. As the aggregate size increases the aggregate surface area decreases. Thus, the volume of asphalt cement that is required to coat that aggregate decreases.

26
Marshall Mix Design Procedure Cont.
Remove paper filter from top & bottom of specimen and allow to cool then extrude from mold using hydraulic jack. Mark and allow to room temp. overnight before further testing. Determine Bulk S.G. of each compacted specimen. Measure Rice S.G. for the loose mix specimen.

27
Bulk S.G. of Compacted Mix
Determine the weight of the compacted specimen in air (A). Immerse specimen in water (25c) for 3 – 5 minutes and record its weight (C) Surface dry the specimen and determine SSD weight (B). Bulk S.G. = Gmb = [A / (B-C)]
. Immerse specimen in water (25c) for 3 – 5 minutes and record its weight (C) Surface dry the specimen and determine SSD weight (B). Bulk S.G. = Gmb = [A / (B-C)]")
28
Bulk S.G. of Compacted Mix Cont.

29
Rice S.G. of Loose Mix Required for void analysis.
If the mix contain absorptive aggregates, place loose mix in oven for (4hrs) at mixing temp. so that AC is completely absorbed by aggregate prior to testing. Separate particles…..Cool to room temp……place in container….determine dry weight (A). Fill pycnometer with water & take wt. (D). Put the asphalt mix sample in the pycnometer & add water to fill Removed entrapped air by vacuuming until residual pressure manometer reads 30 mmHg or less. Maintain this pressure for 5 to 15 minutes. Agitate container while vacuuming.
 at mixing temp. so that AC is completely absorbed by aggregate prior to testing. Separate particles…..Cool to room temp……place in container….determine dry weight (A). Fill pycnometer with water & take wt. (D). Put the asphalt mix sample in the pycnometer & add water to fill Removed entrapped air by vacuuming until residual pressure manometer reads 30 mmHg or less. Maintain this pressure for 5 to 15 minutes. Agitate container while vacuuming.")
30
Rice S.G. of Loose Mix Fill pycnometer with water….dry outside…..take wt. (E) = Wt of Pycnometer + Aspahlt mix sample + water. Gmm = TMD = [ A / (A + D – E)] If test is conducted on 3 specimens mixed at or near optimum….Average 3 results….then calculate effective S.G. (Gse) of aggregate….. Then calculate Gmm for the remaining mixes with different AC contents. If Rice S.G. is found for each mix with different AC….. Then calculate Gse of aggregates in each case…. Then calculate Average Gse…… then calculate Gmm values using the average for all five mixes.
] If test is conducted on 3 specimens mixed at or near optimum….Average 3 results….then calculate effective S.G. (Gse) of aggregate….. Then calculate Gmm for the remaining mixes with different AC contents. If Rice S.G. is found for each mix with different AC….. Then calculate Gse of aggregates in each case…. Then calculate Average Gse…… then calculate Gmm values using the average for all five mixes.")
31
Rice S. G. of Loose Mix

32
% Weights of Total Mix

33
S.G. of Aggregates Gsb = [(P1 +P2 +P3)/ ((P1/G1) + (P2/G2) + (P3/G3))]
Bulk S.G. of combined aggregates Gsb = [(P1 +P2 +P3)/ ((P1/G1) + (P2/G2) + (P3/G3))] P1,2,3 = % by wt of aggregates 1,2, and 3 G1,2,3 = Bulk S.G. of aggregates 1, 2, and 3 Absorption of combined agg = [(P1 A1/100) + (P2 A2/100) + (P3 A3/100)] Where A1,2,3 = Absorption of aggregates 1,2, and 3
![S.G. of Aggregates Gsb = [(P1 +P2 +P3)/ ((P1/G1) + (P2/G2) + (P3/G3))]](http://slideplayer.com/slide/4504080/14/images/33/S.G.+of+Aggregates+Gsb+%3D+%5B%28P1+%2BP2+%2BP3%29%2F+%28%28P1%2FG1%29+%2B+%28P2%2FG2%29+%2B+%28P3%2FG3%29%29%5D.jpg "Bulk S.G. of combined aggregates. Gsb = [(P1 +P2 +P3)/ ((P1/G1) + (P2/G2) + (P3/G3))] P1,2,3 = % by wt of aggregates 1,2, and 3. G1,2,3 = Bulk S.G. of aggregates 1, 2, and 3. Absorption of combined agg = [(P1 A1/100) + (P2 A2/100) + (P3 A3/100)] Where A1,2,3 = Absorption of aggregates 1,2, and 3.")
34
Effective S.G. of Aggregates
Gse = Ratio of the oven dry wt. in air of a unit volume of a permeable material (excluding voids permeable to asphalt) at a stated temp. to the wt. of an equal volume of gas-free distilled water. Ps = % of aggregates by total wt. of mixture = (Pmm =100) – Pb Pb = % of asphalt by total wt. of mixture Gmm = Max. theoretical S.G Gasp = Gb = S.G. of asphalt
 at a stated temp. to the wt. of an equal volume of gas-free distilled water. Ps = % of aggregates by total wt. of mixture = (Pmm =100) – Pb. Pb = % of asphalt by total wt. of mixture. Gmm = Max. theoretical S.G. Gasp = Gb = S.G. of asphalt.")
35
Gmm = (Pmm =100) / [((100 – Pb) /Gse) + ((Pb /Gb))]
Max. Theoretical S.G Gmm = Ratio of the wt. in air of a unit volume of an uncompacted bituminous paving mixture at a stated temp. to the wt. of an equal volume of water. Gmm = (Pmm =100) / [((100 – Pb) /Gse) + ((Pb /Gb))] = (100) / [((Ps) /Gse) + ((Pb /Gb))] Ps = % of aggregates by total wt. of mixture = (Pmm =100) – Pb Pb = % of asphalt by total wt. of mixture Gse = Effective S.G. of aggregates Gb = S.G. of asphalt
![Gmm = (Pmm =100) / [((100 – Pb) /Gse) + ((Pb /Gb))]](http://slideplayer.com/slide/4504080/14/images/35/Gmm+%3D+%28Pmm+%3D100%29+%2F+%5B%28%28100+%E2%80%93+Pb%29+%2FGse%29+%2B+%28%28Pb+%2FGb%29%29%5D.jpg "Max. Theoretical S.G. Gmm = Ratio of the wt. in air of a unit volume of an uncompacted bituminous paving mixture at a stated temp. to the wt. of an equal volume of water. Gmm = (Pmm =100) / [((100 – Pb) /Gse) + ((Pb /Gb))] = (100) / [((Ps) /Gse) + ((Pb /Gb))] Ps = % of aggregates by total wt. of mixture = (Pmm =100) – Pb. Pb = % of asphalt by total wt. of mixture. Gse = Effective S.G. of aggregates. Gb = S.G. of asphalt.")
36
Density Void Analysis

37
Density & Void Analysis (Volumetrics)
")
38
% Air Voids 3 < %Vair < 8
Voids in Total Mix = Air Voids : The total volume of the small pockets of air between the coated aggregate particles throughout a compacted paving mixture, expressed as % of the bulk volume of the compacted paving mixture Low VTM …. Minimize aging, permeability, and stripping. 3 < %Vair < 8

39
Density of Compacted Mix
Density of water = 1000 kg/ m^3 (62.4 lb/ft^3)
")
40
Voids In Mineral Aggregates (VMA)
The volume of intergranular space between the aggregate particles of a compacted paving mixture that includes the air voids and volume of the asphalt not absorbed into the aggregate. VMA = V effective asphalt + Vair Doesn’t include volume of absorbed asphalt. Low VMA affects durability….lower effective asphalt oxidize faster….. Thin film coatings are easily penetrated by water.

41
Voids Filled with Asphalt (VFA)
The % of the volume of the VMA that is filled with asphalt cement. VFA = [Veb/ ((Veb + Vair) = VMA)]100
 = VMA)]100.")
42
Effective Asphalt (Pbe)
available for coating, binding, or filling voids NOT absorbed by aggregate

43
Density used to control quality during construction
% of max theoretical lab density % of optimum lab density compare with field density nuclear density meter (non-destructive) cores
 cores.")
44
Marshal Stability & Flow
Stability: Maximum load carried by a compacted specimen tested 60c) at a loading rate of (2 in/min). Stability is affected by angle of internal friction of aggregates & viscosity of asphalt. Flow: Vertical deformation of the sample in hundreds of an inch (0.01 inch) or (0.25 mm).
 at a loading rate of (2 in/min). Stability is affected by angle of internal friction of aggregates & viscosity of asphalt. Flow: Vertical deformation of the sample in hundreds of an inch (0.01 inch) or (0.25 mm).")
45
Marshal Stability & Flow Cont.
Heights Used to correct stability measurements Stability and flow Specimen immersed in water 60oC for 30 to 40 minutes. Remove from bath…. Pat with towel….. Then place in Marshal Testing head. Apply 2 inch (50 mm)/min loading rate Max. load = uncorrected stability (N or Lb) Corresponding vertical deformation = flow (0.01 inch or 0.25 mm) When load start to decrease, remove flowmeter. Note: Test should be completed in 60 sec.
/min loading rate. Max. load = uncorrected stability (N or Lb) Corresponding vertical deformation = flow (0.01 inch or 0.25 mm) When load start to decrease, remove flowmeter. Note: Test should be completed in 60 sec.")
46
Marshall Stability and Flow
Marshall stability and flow is determined by conducting the test procedure defined in ASTM D1559, Resistance to Plastic Flow of Bituminous Mixtures Using the Marshall Apparatus. The specimen is placed in the Marshall apparatus and loaded at a rate of 50 mm/minute. From this test two values are obtained: Marshall stability - This value is a measurement of the load under which the specimen totally yields or fails. During the test, when the load is slowly applied, the upper and lower head of the testing apparatus get closer together and the load on the specimen increases, and the reading on the dial gauge decreases. When the maximum load has been reached the loading is discontinued. The maximum value is the Marshall-stability value. The test provides some indication of the resistance of the specimen to internal shear forces. The value is total load in Kg. Marshall flow - measured in one-hundreths of an inch, represents the total deformation of the specimen. The deformation is a decrease in the vertical diameter of the specimen. Mixtures with a high VMA will usually develop an excessive flow value before reaching an asphalt cement content that will produce a satisfactory mix. For aggregates with large proportions of mineral filler, the flow value increases rapidly with each small increase in asphalt content.

47
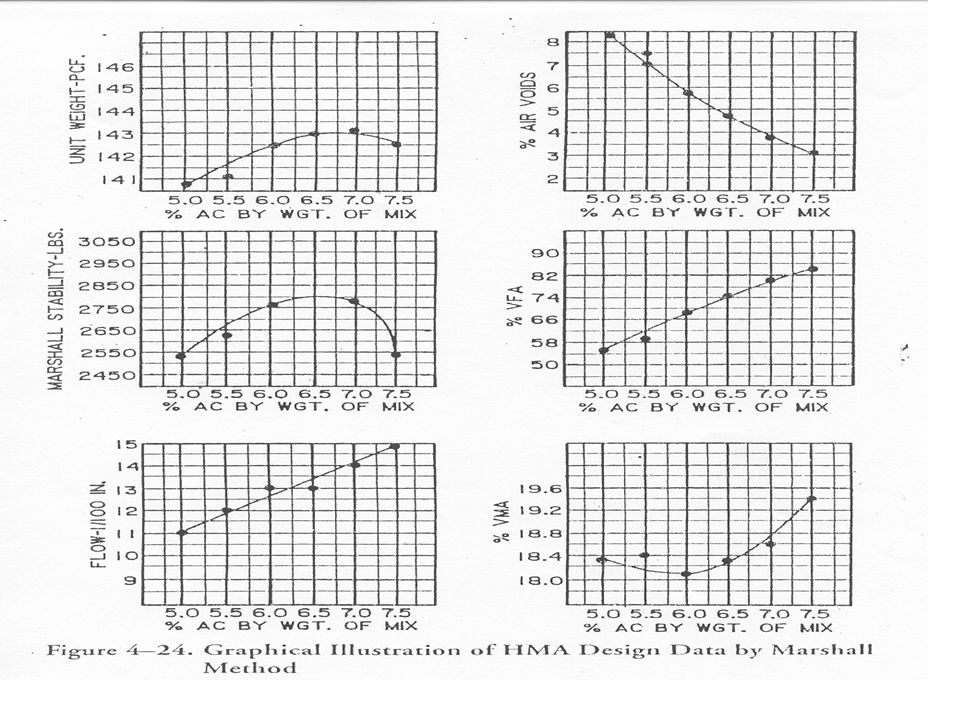
Tabulating & Plotting Test Results
Tabulate the results from testing Correct stability values for specimen height (ASTM D1559). Calculate Avg. of each set of 3 specimens. Prepare the following plots: %AC vs. Unit wt. (Density) %AC vs. Corrected Marshall stability %AC vs. Flow %AC vs. Air voids (VTM) %AC vs. VMA %AC vs. VFA
. Calculate Avg. of each set of 3 specimens. Prepare the following plots: %AC vs. Unit wt. (Density) %AC vs. Corrected Marshall stability. %AC vs. Flow. %AC vs. Air voids (VTM) %AC vs. VMA. %AC vs. VFA.")
48
Test Results & Mix Properties for Marshall mix
Sample # %AC Wt. in Air (Dry) Wt. in water (SSD) Wt. in air (SSD) Volume Bulk Density Theor. Max Density Air Voids VMA VFA Measured Stability Corrected Stability Flow 1 5.0 1167.8 650.7 1169.0 518.3 140.6 2400 11 2 1164.9 647.0 1166.2 519.2 140.0 2630 3 1165.1 651.0 1167.0 516 140.9 2560 Avg 140.5 153.1 8.2 18.3 55.2 2530
 Wt. in water (SSD) Wt. in air (SSD) Volume. Bulk Density. Theor. Max Density. Air Voids. VMA. VFA. Measured Stability. Corrected Stability. Flow Avg")
51
Determination of Optimum AC Content
National Asphalt Pavement Association (NAPA) Procedure Asphalt Institute Procedure
 Procedure. Asphalt Institute Procedure.")
52
(NAPA) Procedure Target optimum asphalt content =
Air Voids, % 4% Asphalt Content, % In the NAPA method the target asphalt content is that asphalt content where the mix meets the mid range of the air void specification. Typically this is 3 to 5% which means that the target is typically 4%. Some DOTs have a higher requirement. Target optimum asphalt content = the asphalt content at 4% air voids

53
Marshall Design Use of Data NAPA Procedure
Stability OK Asphalt Content, % Then the stability is checked. The target stability is checked

54
Marshall Design Use of Data NAPA Procedure
Flow Lower Limit Upper limit OK VMA, % Asphalt Content, % Minimum OK Asphalt Content, % Use target optimum asphalt content to check if these criteria are met If not - adjust slightly to meet all criteria if possible; else change gradation and repeat analysis The Marshall flow and VMA requirements are checked.

55
Marshall Design Use of Data Asphalt Institute Procedure
Stability Unit Wt. Air Voids, % 4% Asphalt Content, % Asphalt Content, % Asphalt Content, % As the asphalt content increases the air voids decrease. The stability increases to a point and then decreases and the unit weight also increases to point and then either levels out or drops. There are two methods for determining the design asphalt content: the Asphalt Institute procedure and the National Asphalt Paving Association procedure. In the Asphalt Institute procedure the asphalt content at which the air voids are 4%, the asphalt content at which the stability is the maximum and the unit weight is the maximum are averaged. Target optimum asphalt content = average

56
Marshall Design Use of Data Asphalt Institute Procedure
VMA, % Asphalt Content, % Minimum OK Flow Asphalt Content, % Lower Limit Upper limit OK The asphalt content is then used to enter the other two charts to determine if the mix meet the minimum requirements for the other properties. Use target optimum asphalt content to check if ALL criteria are met (If not - adjust slightly to meet all criteria if possible; else change gradation and repeat analysis)
")
57
Marshall Design Method
Advantages Attention on voids (volumetrics), strength, durability Inexpensive equipment Easy to use in process control/acceptance Disadvantages Impact method of compaction Does not directly consider shear strength Load perpendicular to compaction axis developed for dense grad, < 1”max size, viscosity or pen graded ac One of the strengths of the Marshall method is its attention to density/voids analysis. This ensures that the important volumetric properties of the mix are at their optimum levels to achieve a durable HMA pavement. Another advantage is that it required equipment that was relatively inexpensive and very portable. This lead to its use for quality control operations. Unfortunately the impact method of compaction does not simulate densification that occurs under traffic in a real pavement. The strength parameter does not adequately measure the shear strength of the HMA.
, strength, durability. Inexpensive equipment. Easy to use in process control/acceptance. Disadvantages. Impact method of compaction. Does not directly consider shear strength. Load perpendicular to compaction axis. developed for dense grad, < 1 max size, viscosity or pen graded ac. One of the strengths of the Marshall method is its attention to density/voids analysis. This ensures that the important volumetric properties of the mix are at their optimum levels to achieve a durable HMA pavement. Another advantage is that it required equipment that was relatively inexpensive and very portable. This lead to its use for quality control operations. Unfortunately the impact method of compaction does not simulate densification that occurs under traffic in a real pavement. The strength parameter does not adequately measure the shear strength of the HMA.")
Similar presentations


>")


 MASONRY WHAT YOU NEED TO KNOW ?? QUALITY CONTROL ASTM SPECIFICATION MANUFACTURING.>")


 The surface course is the layer in contact with traffic loads and normally contains the highest quality materials. It provides characteristics.>")

 ASPHALT CONCRETE MIXTURES>")


