Download presentation
Presentation is loading. Please wait.

2
2

3
3 J. Proteome Res., 2011, 10 (1), pp 153–160 DOI: 10.1021/pr100677g
, pp 153–160 DOI: /pr100677g")
4
4

5
5 Editorial “There has been an unprecedented improvement in the quality and quantity of commercial proteomics data generation technologies, making data generation more accessible to many researchers. However, more and more discoveries will be led by researchers in command of the skills necessary to mine and extensively interpret the volumes of data. Already the ability to generate data vastly outpaces our ability to interpret it, and the lack of expertise in interpreting data is the current gating factor in the advancement of proteomics sciences. Proteomics scientists with training solely in data generation techniques will be shut out of more and more research opportunities. Nuno Bandeira, July 2011 Editorial “There has been an unprecedented improvement in the quality and quantity of commercial proteomics data generation technologies, making data generation more accessible to many researchers. However, more and more discoveries will be led by researchers in command of the skills necessary to mine and extensively interpret the volumes of data. Already the ability to generate data vastly outpaces our ability to interpret it, and the lack of expertise in interpreting data is the current gating factor in the advancement of proteomics sciences. Proteomics scientists with training solely in data generation techniques will be shut out of more and more research opportunities. Nuno Bandeira, July 2011

6
Eduards AM, Nature, Feb 2011

7
7

9
pcarvalho.com9

10
10 Mass / Charge TimeTime

11
A FYLK m/z AFYALK NH 2 COOH (precursor) 2+ (B) (Y)
 2+ (B) (Y)")
12
AF YLK A m/z AFYLK NH 2 COOH A FYLK (precursor) 2+ (B) (Y)
 2+ (B) (Y)")
13
AFY LK L m/z AFYK NH 2 COOH A FYLK AF YLK (precursor) 2+ (B) (Y)
 2+ (B) (Y)")
14
m/z AFYLK NH 2 COOH K AFYL A FYLK AF YLK AFY LK (precursor) 2+ (B) (Y)
 2+ (B) (Y)")
15
15

17
17 M/Z MS/MS Intensity Q G D F V L E T S K H A G I I L V L G T S V G V V K E D A S P E

18
18 Na S et al., MCP, 2008

19
19

20
20 ProLuCID Xtandem OMSSA Andromeda SEQUEST Mascot …

21
Interpreting MS/MS Proteomics Results Brian C. Searle Proteome Software Inc. Portland, Oregon USA Brian.Searle@ProteomeSoftware.com NPC Progress Meeting (February 2nd, 2006) Illustrated by Toni Boudreault
 Illustrated by Toni Boudreault.")
22
M/z Intensity RITPEA H2OH2O B-type, A-type, Y-type Ions All these peaks are seen together simultaneously and we don’t even know …

23
M/z Intensity What type of ion they are, making the mass differences approach even more difficult. Finally, as with all analytical techniques,

24
M/z Intensity There’s noise, producing a final spectrum that looks like …

25
M/z Intensity ….This, on a good day. And so it’s actually fairly difficult to …

26
26

27
Known Ion Types B-type ions A-type ions Y-type ions We knew a couple of things about peptide fragmentation. Not only do we know to expect B, A, and Y ions, but…

28
Known Ion Types B-type ions A-type ions Y-type ions B- or Y-type +2H ions B- or Y-type -NH 3 ions B- or Y-type -H 2 O ions 100% 20% 100% 50% 20% … likelihood of seeing each type of ion, where generally B and Y ions are most prominent.

29
If we know the amino acid sequence of a peptide, we can guess what the spectra should look like! So it’s actually pretty easy to guess what a spectrum should look like if we know what the peptide sequence is.

30
ELVISLIVESK Model Spectrum *Courtesy of Dr. Richard Johnson http://www.hairyfatguy.com/ So as an example, consider the peptide ELVIS LIVES K that was synthesized by Rich Johnson in Seattle

31
Model Spectrum We can create a hypothetical spectrum based on our rules

32
B/Y type ions (100%) A type ions B/Y -NH 3 /-H 2 O (20%) B/Y +2H type ions (50%) Where B and Y ions are estimated at 100%, plus 2 ions are estimated at 50%, and other stragglers are at 20%.
 A type ions B/Y -NH 3 /-H 2 O (20%) B/Y +2H type ions (50%) Where B and Y ions are estimated at 100%, plus 2 ions are estimated at 50%, and other stragglers are at 20%.")
33
Model Spectrum So if we consider the spectrum that was derived from the ELVIS LIVES K peptide…

34
Model Spectrum We can find where the overlap is between the hypothetical and the actual spectra…

35
Model Spectrum And say conclusively based on the evidence that the spectrum does belong to the ELVIS LIVES K peptide.

36
1977 Shotgun sequencing invented, bacteriophage fX174 sequenced. 1989 Yeast Genome project announced 1990 Human Genome project announced 1992 First chromosome (Yeast) sequenced 1995 H. influenza sequenced 1996 Yeast Genome sequenced 2000 Human Genome draft Sequencing Explosion … Eng, J. K.; McCormack, A. L.; Yates, J. R. III J. Am. Soc. Mass Spectrom. 1994, 5, 976-989. In 1994 Jimmy Eng and John Yates published a technique to exploit genome sequencing And the idea was … for use in tandem mass spectrometry.
 sequenced 1995 H. influenza sequenced 1996 Yeast Genome sequenced 2000 Human Genome draft Sequencing Explosion … Eng, J. K.; McCormack, A. L.; Yates, J. R. III J. Am. Soc. Mass Spectrom. 1994, 5, In 1994 Jimmy Eng and John Yates published a technique to exploit genome sequencing And the idea was … for use in tandem mass spectrometry..")
37
SEQUEST.… instead of searching all possible peptide sequences, search only those in genome databases. Now, in the post- genomic world this seems like a pretty trivial idea, but back then there was a lot of assumption placed on the idea that we’d actually have a complete Human genome in a reasonable amount of time.

38
SEQUEST Model Spectrum For a scoring function they decided to use Cross-Correlation, Like so. which basically sums the peaks that overlap between hypothetical and the actual spectra

39
SEQUEST Model Spectrum And then they shifted the spectra back and ….

40
SEQUEST Model Spectrum They used this number, also called the Auto-Correlation, as their background. … Forth so that the peaks shouldn’t align.

41
SEQUEST XCorr Gentzel M. et al Proteomics 3 (2003) 1597-1610 Offset (AMU) Correlation Score Cross Correlation (direct comparison) Auto Correlation (background) This is another representation of the Cross Correlation and the Auto Correlation.
 Offset (AMU) Correlation Score Cross Correlation (direct comparison) Auto Correlation (background) This is another representation of the Cross Correlation and the Auto Correlation..")
42
SEQUEST XCorr Cross Correlation (direct comparison) Auto Correlation (background) XCorr = Gentzel M. et al Proteomics 3 (2003) 1597-1610 Offset (AMU) Correlation Score The XCorr score is the Cross Correlation divided by the average of the auto correlation over a 150 AMU range. The XCorr is high if the direct comparison is significantly greater than the background, which is obviously good for peptide identification.
 Offset (AMU) Correlation Score The XCorr score is the Cross Correlation divided by the average of the auto correlation over a 150 AMU range. The XCorr is high if the direct comparison is significantly greater than the background, which is obviously good for peptide identification..")
43
SEQUEST DeltaCn and so far, there really haven’t been any significant improvements on it. The DeltaCn is another score that scientists often use. It measures how good the XCorr is relative to the next best match. And this XCorr is actually a pretty robust method for estimating how accurate the match is, As you can see, this is actually a pretty crude calculation.

44
44 * Show an MS2 file

45
45 ProLuCID is a fast and sensitive tandem mass spectra-based protein identification program recently developed in the Yates laboratory at The Scripps Research Institute.

46
Show ProLuCID Runner Carvalho PC et al; unpublished 46

47
Search Engine (e.g. ProLuCID, SEQUEST, etc) Workflow MS PSM Database
 Workflow MS PSM Database")
48
48

49
49

50
50 In the beginning… spectrumscoresproteinpeptide sort by match score SEQUEST XCorr > 2.5 dCn > 0.1 Mascot Score > 45 X!Tandem Score < 0.01 Spectra were sorted according to some score and then a threshold value was set. Different programs have different scoring schemes, so SEQUEST, Mascot, and X!Tandem use different thresholds. Different thresholds may also be needed for different charge states, sample complexity, and database size. Spectra were sorted according to some score and then a threshold value was set. Different programs have different scoring schemes, so SEQUEST, Mascot, and X!Tandem use different thresholds. Different thresholds may also be needed for different charge states, sample complexity, and database size.

51
51 There has to be a better way The threshold model has these problems, which PeptideProphet, DTASelect and others try to solve: Poor sensitivity/specificity trade-off, unless you consider multiple scores simultaneously. No way to choose an error rate (p=0.05). Need to have different thresholds for: – different instruments (QTOF, TOF-TOF, IonTrap) – ionization sources (electrospray vs MALDI) – sample complexities (2D gel spot vs MudPIT) – different databases (SwissProt vs NR) Impossible to compare results from different search algorithms, multiple instruments, and so on.
. Need to have different thresholds for: – different instruments (QTOF, TOF-TOF, IonTrap) – ionization sources (electrospray vs MALDI) – sample complexities (2D gel spot vs MudPIT) – different databases (SwissProt vs NR) Impossible to compare results from different search algorithms, multiple instruments, and so on..")
52
52 Creating a discriminant score spectrumscoresproteinpeptide sort by match score PeptideProphet starts with a discriminant score. If an application uses several scores, (SEQUEST uses Xcorr, Cn, and Sp scores; Mascot uses ion scores plus identity and homology thresholds), these are first converted to a single discriminant score.
, these are first converted to a single discriminant score..")
53
pcarvalho.com53 Scaffold:: Proteome Software

54
54 correctly identifies everything, with no error Keller et al, Anal Chem 2002 This graph shows the trade-offs between the errors (false identifications) and the sensitivity (the percentage of possible peptides identified). The ideal is zero error and everything identified (sensitivity = 100%). PeptideProphet corresponds to the curved line. Squares 1–5 are thresholds chosen by other authors. This graph shows the trade-offs between the errors (false identifications) and the sensitivity (the percentage of possible peptides identified). The ideal is zero error and everything identified (sensitivity = 100%). PeptideProphet corresponds to the curved line. Squares 1–5 are thresholds chosen by other authors.
. PeptideProphet corresponds to the curved line. Squares 1–5 are thresholds chosen by other authors. This graph shows the trade-offs between the errors (false identifications) and the sensitivity (the percentage of possible peptides identified). The ideal is zero error and everything identified (sensitivity = 100%). PeptideProphet corresponds to the curved line. Squares 1–5 are thresholds chosen by other authors..")
55
55 “correct” “incorrect” Discriminant score (D) Number of spectra in each bin This histogram shows the distributions of correct and incorrect matches. PeptideProphet assumes that these distributions are standard statistical distributions. Using curve-fitting, PeptideProphet draws the correct and incorrect distributions. This histogram shows the distributions of correct and incorrect matches. PeptideProphet assumes that these distributions are standard statistical distributions. Using curve-fitting, PeptideProphet draws the correct and incorrect distributions. Mixture of distributions

56
56 Sequências alvo -------------------------- Decoys rotulados } { Estratégia decoy para FDR Resultado busca Elias and Gygi, Nature Methods, 2007

57
pcarvalho.com57 SVM - example

58
58 Summary: “The use of iProphet in the TPP increases the number of correctly identified peptides at a constant false discovery rate (FDR) as compared to both PeptideProphet and another state-of-the art tool Percolator.”
 as compared to both PeptideProphet and another state-of-the art tool Percolator.")
59
59 Maximizing proteins under a given FDR

60
60

61
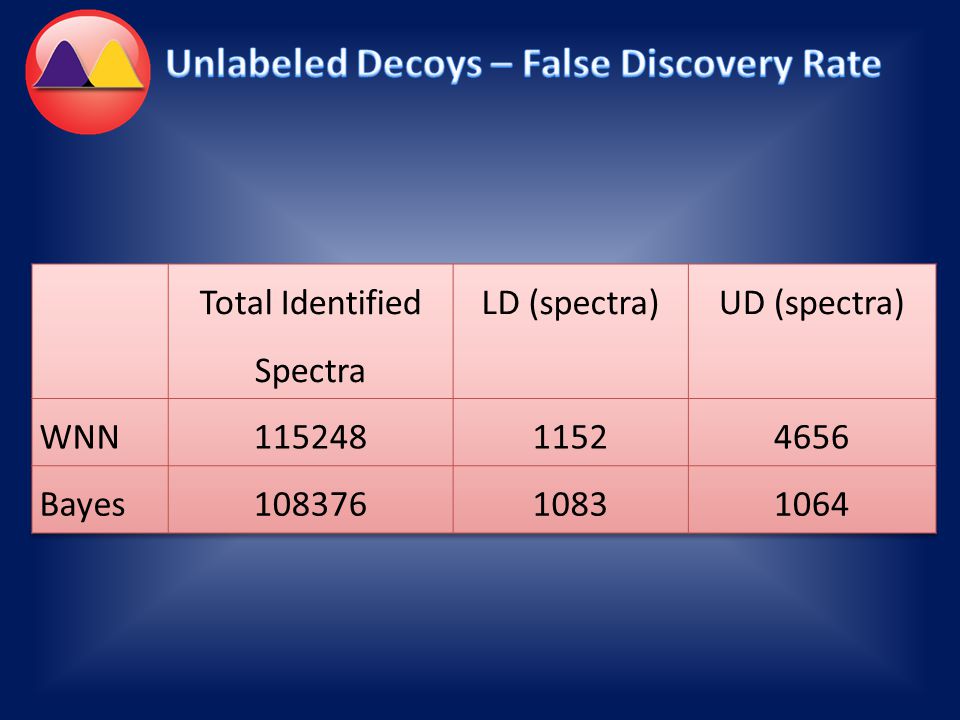
61 Target Sequences -------------------------- Labeled Decoys } { New FDR strategy Resultado search ------------------------- Unlabeled Decoyd U- Decoy

63
SpectraPeptidesProteins (FDR)UL FDR SEPro104,65417,8401283 (0.9%)1% Scaffold88,97015,4061,160 (2.3%)2% Table I. Scaffold A refers to a 99% confidence level for proteins, 95% for peptides. Scaffold B refers to 95 and 80%, respectively for proteins and peptides.

64
64

65
65

66
66

67
67

68
68

69
69

70
70

71
71

72
Thermo

73
Picture from Strassberger et al, JOP, 2010 * Search for examples in xcalibur Scan 12048 How to deal with different charge states???? Subject to random sampling; what are its immplications?

74
74 Differential Analysis Marginal Cases (found in only 1 condition) Differential (found in both)
 Differential (found in both)")
75
75 Venn Diagrams of the proteins identified by shotgun proteomics from a cell lysate in biological states B1 and B2. Panels A, B, and C consider only proteins that appeared in one or more, two or more, or in all three replicates, respectively.

76
76 Venn Diagrams of the proteins identified by shotgun proteomics from a cell lysate in biological states B1 (A) and B2 (B). R1, R2, and R3 refer to the replicates from 59 each state.

77
77 What proteins can be considered as statistically different for marginal cases?

78
Venn Diagram of the proteins identified by shotgun proteomics from a cell lysate in biological states B1 and B2. Proteins that could not be statistically claimed to be differentially expressed in one of the two states according to the proposed Bayesian approach (those forwhich p-value 0.05) were automatically filtered out during the generation of the Venn Diagram. Carvalho PC et al; Bioinformatics 2011
 were automatically filtered out during the generation of the Venn Diagram. Carvalho PC et al; Bioinformatics")
79
79 Differential Analysis Marginal Cases (found in only 1 condition) Differential (found in both)
 Differential (found in both)")
80
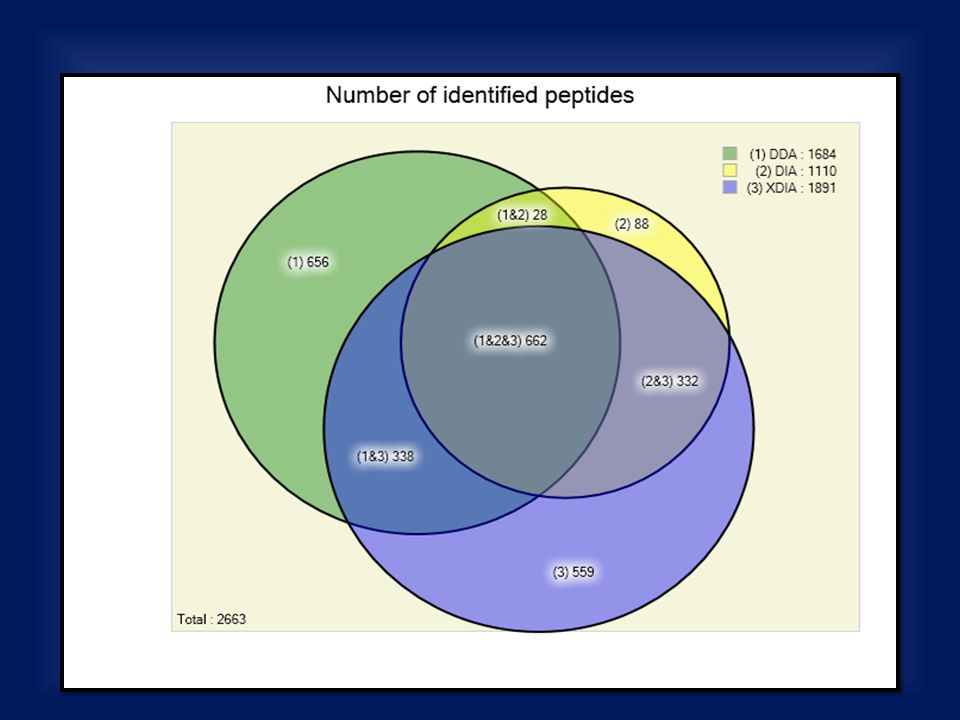
80 } } Estrategia Tradicional - Data Dependent Analysis (DDA) Nova estrategia – Extended Data Independent Analysis (XDIA)
 Nova estrategia – Extended Data Independent Analysis (XDIA)")
81
81

82
82

84
84

85
DDAXDIA

86
AAA, BBBB Time Peptide Mass:

88
88

89
89

90
Pinpoint differentially expressed proteinsVenn Diagrams Gene Ontology AnalysisFind trends in time-course experiments Carvalho PC et al., Current Protocols in Bioinformatics, 2010

91
91

92
Finding Statistically Differentially Expressed Proteins / Data Analysis PatternLab for proteomics (Trends, Venn Diagrams, Differential Statistics, Gene Ontology Analysis, etc..) Protein Quantitation Search Engine Processor / SEProQ Protein Identification / Quality control ProLuCID => Search Engine Processor Search Engine Preprocessing YADA XDIA ProcessorCPM Experimental: Data acquisition using the mass spectrometer DDAXDIA
 Protein Quantitation Search Engine Processor / SEProQ Protein Identification / Quality control ProLuCID => Search Engine Processor Search Engine Preprocessing YADA XDIA ProcessorCPM Experimental: Data acquisition using the mass spectrometer DDAXDIA")
Similar presentations
 proteome: complete.>")


>")


 Course Director David Fenyö Contact information>")