Download presentation
Presentation is loading. Please wait.

1
Tools for applications improvement George Bosilca

2
Performance vs. Correctness »MPI is a corner-stone library for most of the HPC applications »Delivering high performance require a fast and reliable MPI library »It require a well designed application »And well tested libraries …

3
GNU coverage tool »Describe a fine grained execution of the application »The applications is split in atomic blocks and information is gathered about each of the blocks. »How often each line of code is executed »Which lines are actually executed »How long each block take

4
GNU coverage tool »Allow to write tests that cover all the possible execution path »Give information about the most expensive parts/blocks of the code »Is this a very useful information ?! »Require a exhaustive knowledge of the application architecture to be able to provide useful information

5
GNU profiling tool »Provide information about: »How many times each function has been executed »How percentage of the total time has been spent inside each function »Dependencies between functions »Call-graph of the execution »Each sample counts as 0.01 seconds. » % cumulative self self total time seconds seconds calls us/call us/call name »100.00 0.01 0.01 2352 4.25 4.25 mca_btl_mvapi_component_progress » 0.00 0.01 0.00 2134 0.00 0.00 ompi_group_free » 0.00 0.01 0.00 1920 0.00 0.00 ompi_errcode_get_mpi_code » 0.00 0.01 0.00 1710 0.00 0.00 right_rotate » 0.00 0.01 0.00 1672 0.00 0.00 mca_mpool_sm_free » 0.00 0.01 0.00 1293 0.00 0.00 mca_coll_sm_allreduce_intra

6
Valgrind »Suite of tools for debugging and profiling Linux programs. »Memcheck: detect erroneous memory accesses »Use of uninitialized memory »Reading/writing memory after it has been free’d »Reading/writing off the end of malloc’d blocks »Reading/writing inappropriate areas on the stack »Memory leaks »Passing of uninitialized and/or unaddressible memory to system calls »Mismatched use of malloc/new/new[] vs. free/delete/delete[]

7
Valgrind

8
»Cachegrind »Cache profiler »Detailed simulation of all levels of cache »Accurately pinpoint the source of cache misses in the code. »Statistics: number of cache misses, memory references and instructions executed for each line of code, function, module and program.

9
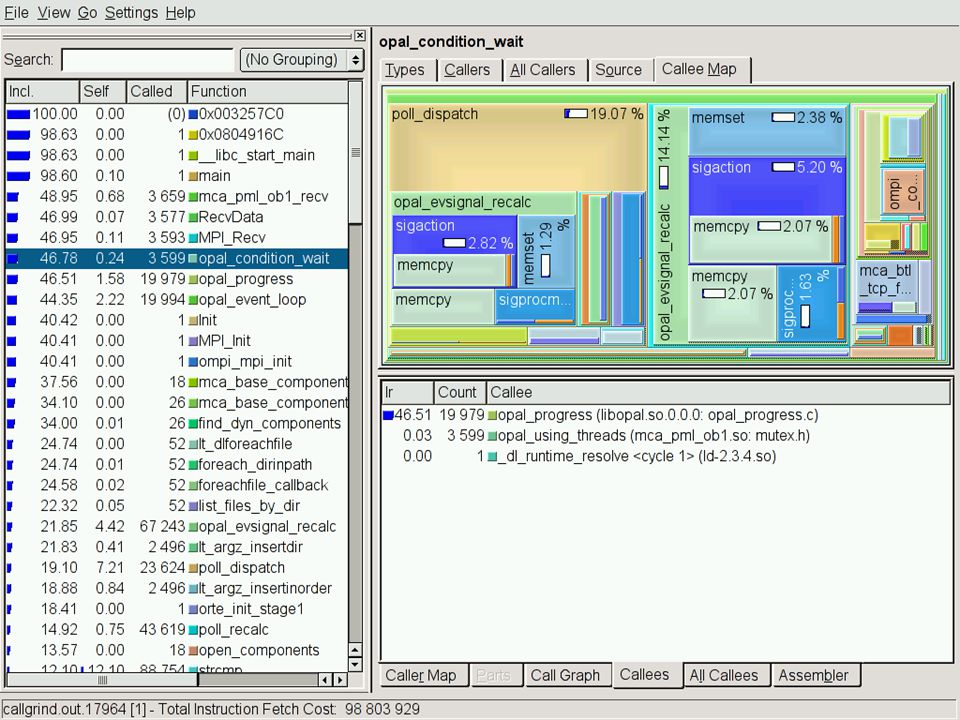
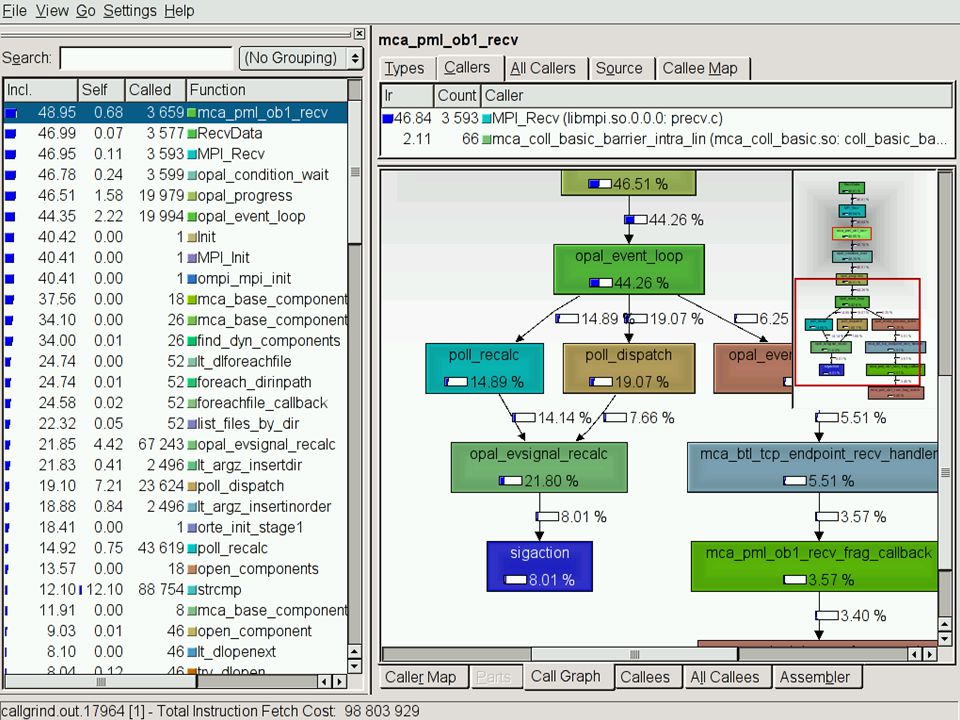
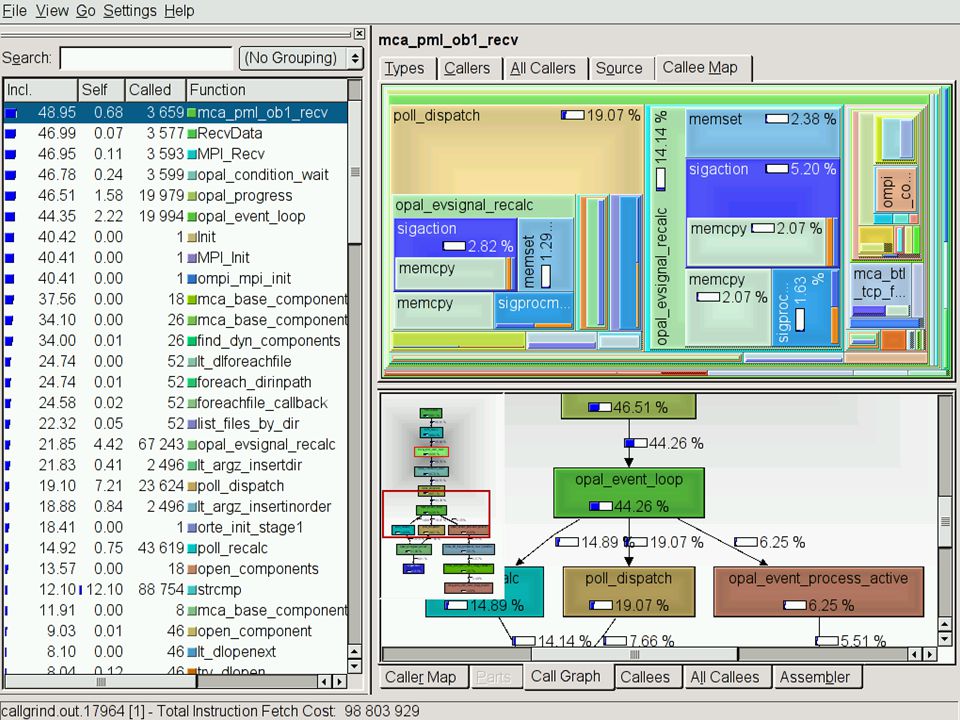
Valgrind »Callgrind »It’s more than just profiling !!! »Automatically instrument at runtime the application and gather information about the call-graphs and the timings »A visual version of gprof

10
Callgrind

17
The power of the 2P »Further improvement of the MPI library require an detailed understanding of the lifetime cycle of the point-to-point operations »There are 2 parts: »All local overheads on the sender and the receiver »And the network overhead/latency »However, we cannot improve the network latency …

18
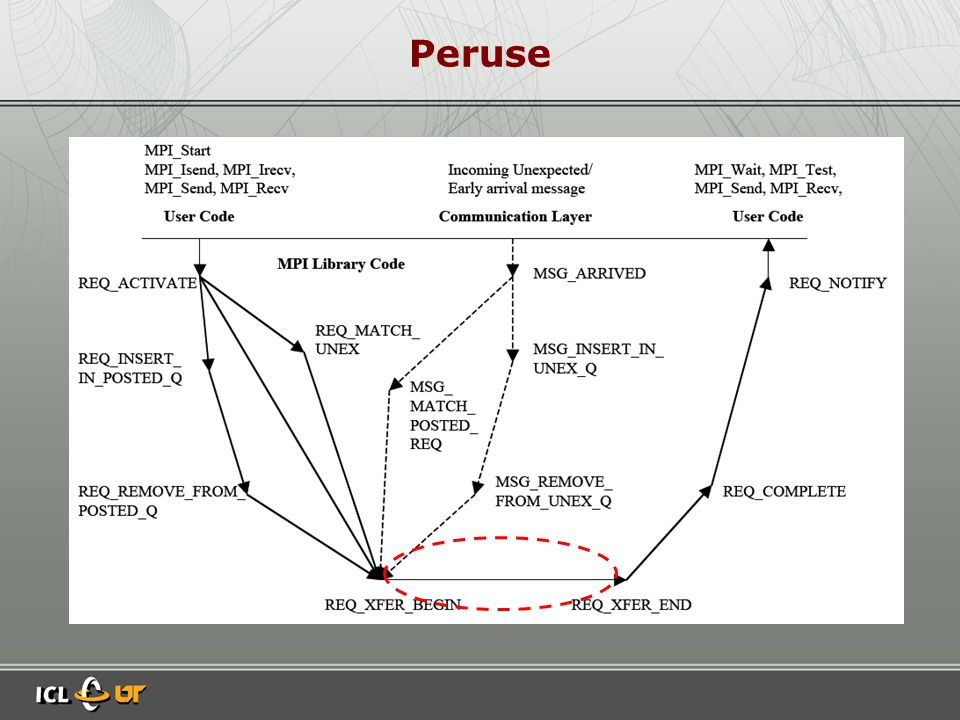
Peruse »A standard to-be ? »An MPI extension for revealing unexposed implementation information… »Similar to PAPI (who expose processor counters) but exposing MPI request events »PERUSE is : A set of events tracing the lifetime of an MPI request
 but exposing MPI request events »PERUSE is : A set of events tracing the lifetime of an MPI request.")
19
Peruse

21
PAPI »Use the processor counters to give information about the execution »Only few of then are interesting for the MPI library »Cache misses »Instruction counters »TLB »Cache disturbances

22
The 2P »Mixing PERUSE and PAPI »At each step in the lifetime of a request we gather: »Cache misses »Instruction counter »Therefore we can compute accurately the cost of each of the steps

23
The 2P »PERUSE will be included in the main Open MPI trunk shortly »The PAPI extension is in a quite advanced state »This is still work in progress …

24
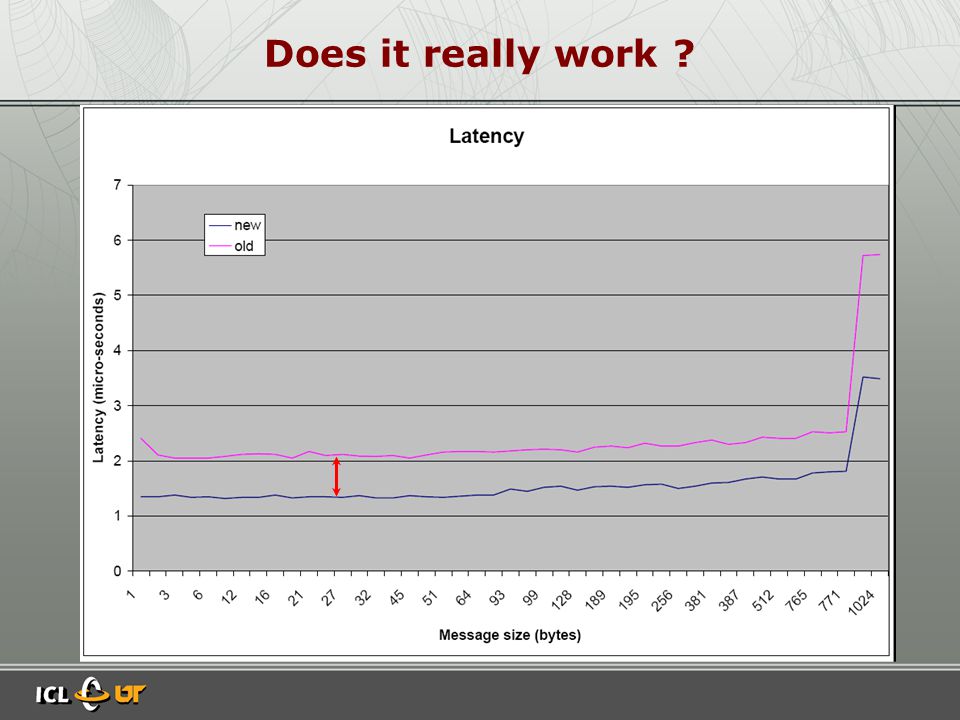
Does it really work ?

26
Conclusion »Performance always start from the first design step »A bad design decision have a persistent impact on the overall performance of the application »Not always easy to achieve especially when several peoples are involved »But there is hope: »Now we have the tools required to work on

27
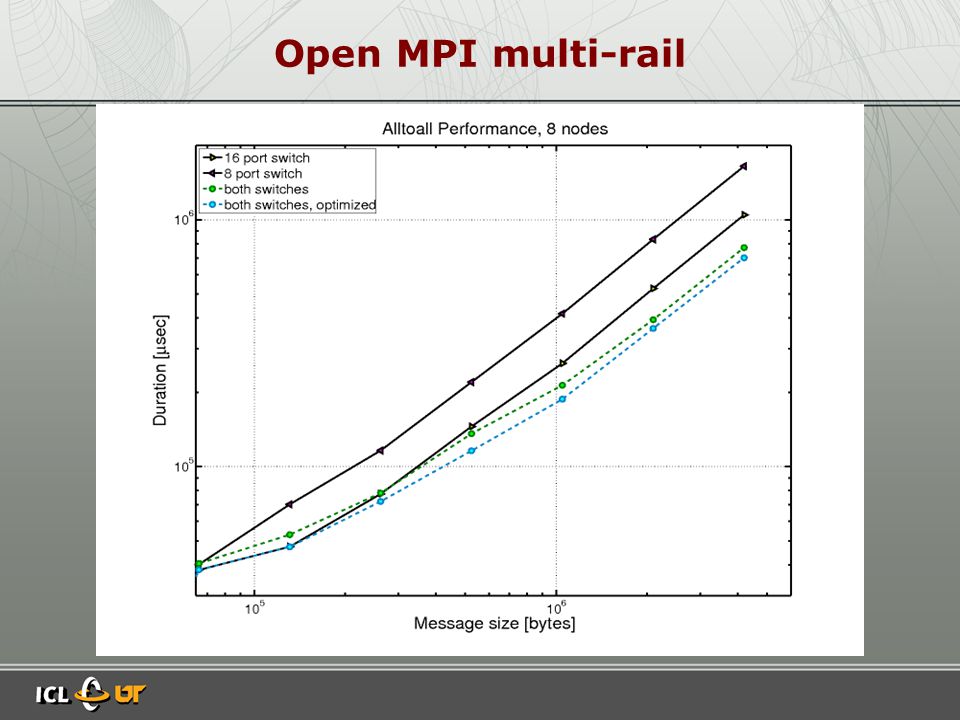
Open MPI multi-rail

29
»Actual algorithm depend only on the priority »Similar to collectives we plan to use a model to predict the »Message size from where multi-rail make sense »Determine the size of each segment based on the latency and the bandwidth of the network.

Similar presentations


 is a form of dynamic program analysis that measures, for example,>")
 Reading Group by Theo 1.>")


>")