Download presentation
Presentation is loading. Please wait.

1
Intergenerational Nutritional Effects & Fetal Growth and Chronic Disease 2007

2
Effect of Women’s own Intrauterine Nutritional Experience her Offspring

3
Two Studies of Effects of Maternal Birthweight on Infant Birthweight

4
Godfrey KM, Barker DJP, Robinson S, Osmond C. Mother's birthweight and diet in pregnancy in relation to the baby's thinness at birth. Br J Obstet Gynaecol 1997;104:663–7

6
Illinois Study Coutinho et al. Am J Epi, 1997 146:804-809 N=15,287 Black and 117,708 white matched pairs of infants and mothers. Mothers were born between 1956-75, infants between 1989-1991

8
Results Father’s birthweight had effect on infant birthweight but not as strong as mothers. In multiple linear regression for infants who weighed more than 2500 g, parental birthweight accounted for 5% of variance among black infants and 4% among white infants. (adjusted for parental age, years of schooling, marital status and adequacy of prenatal care)
.")
9
Results, cont. Each 100 g increase in maternal birthweight was associated with 24-27 g increase in infant birthweight

10
Influence of Maternal Intrauterine & Childhood Nutrition on Outcomes of Pregnancy

11
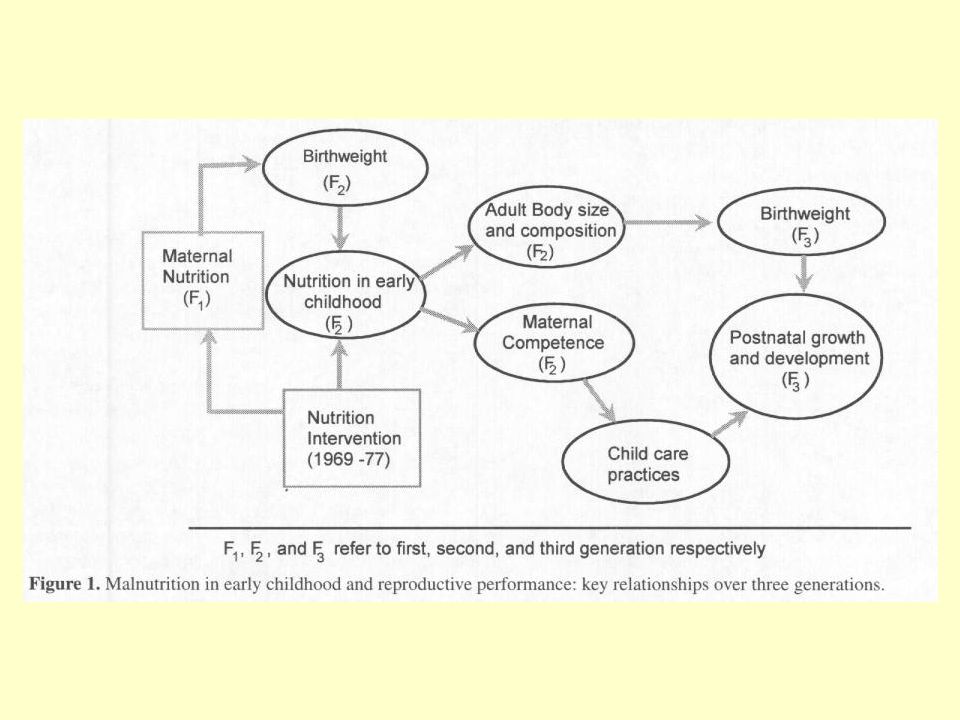
Reproductive performance and nutrition during childhood Nutrition Reviews; Washington; Apr 1996; Martorell, Reynaldo; Ramakrishnan, Usha; Schroeder, Dirk G; Ruel, Marie;

12
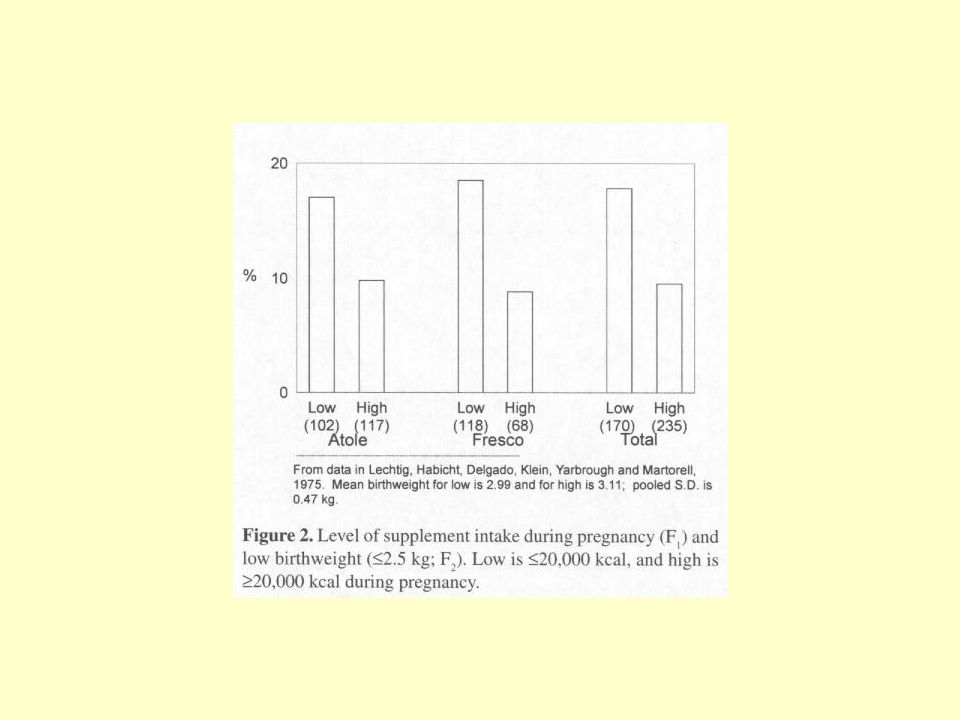
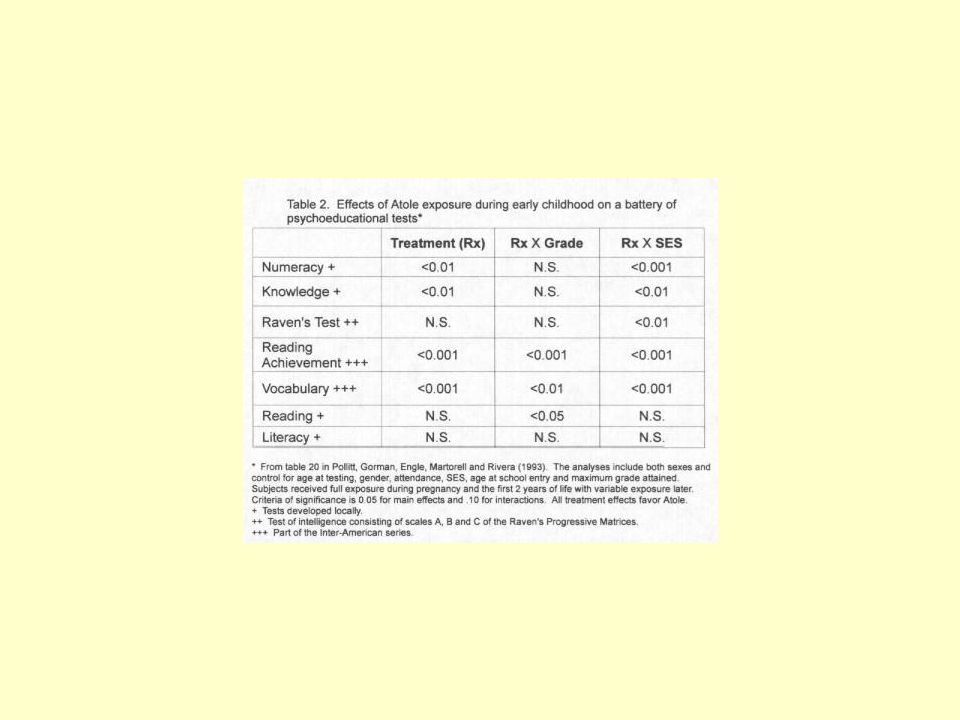
Longitudinal Supplementation Trial (1969-1977) Guatemala, 4 Villages, one pair of villages had about 900 people each and the other about 500 each. 2 each randomized to: Atole (Incaparina, a vegetable protein mix developed by INCAP*, dry skim milk, sugar, and flavoring, 163 kcal/cup, 11/5 g protein) Fresco (flavored drink with sugar, vitamins and minerals, 59 kcal/cup) *Institute of Nutrition of Central America and Panama
 Fresco (flavored drink with sugar, vitamins and minerals, 59 kcal/cup) *Institute of Nutrition of Central America and Panama.")
13
Feeding center was open daily for over 7 years, from 1969 to 1977. Anyone in the village could attend, but careful recording of consumption, including of additional servings as well as of leftovers, was done only for women who were pregnant or breastfeeding and for children 7 years or younger. Supplements were available twice daily, in midmorning and midafternoon, so as not to interfere with meal times.

14
Conceptual framework “Malnutrition in early childhood constrains the future capacity of women to bear healthy newborns and their ability to feed and care for them, and through these mechanisms the growth and development of the next generation.”

20
Follow-Up data - 1990s The prevalence of low birthweight is currently 12% in Atole villages (n = 65) and 28% in Fresco villages (n = 58) among women exposed to the supplements during the intrauterine period and the first 3 years of life. Mean birthweights are 2.90 kg in Atole villages and 2.73 in Fresco villages.

21
Role of intergenerational effects on linear growth U Ramakrishnan; R Martorell; D G Schroeder; R Flores; The Journal of Nutrition; Bethesda; Feb 1999;

22
Methods The sample was restricted to singleton, term (>37 wk of gestation) births that occurred in the four study villages between 1991 and 1996, to women who were born during the original longitudinal study (1969-1977) Complete data were available for 215 mother- child pairs, and 60% of the mothers (n = 140)
 births that occurred in the four study villages between 1991 and 1996, to women who were born during the original longitudinal study ( ) Complete data were available for 215 mother- child pairs, and 60% of the mothers (n = 140)")
23
Results For every 100 g increase in maternal birth weight, her infant's birth weight increased by 29 g after adjusting for the effects of maternal age, gestational age and sex of the infant. This relationship was highly significant (P < 0.001) For every centimeter increase in maternal birth length, her child's birth weight increased by 53 g.
 For every centimeter increase in maternal birth length, her child s birth weight increased by 53 g..")
24
Influence of Maternal Nutrition in Pregnancy

25
Dutch Famine Studies Susser and Stein, Nutrition Reviews, 1994 Dutch famine winter lasted 6 months, from November 1944- when nazis imposed transport embargo on west Holland until- May 7, 1945 when Holland was liberated from the occupation Strong evidence for critical stages of development in several physiological systems

26
Dutch Hunger Winter: Calories

27
Affects of Famine Fertility decreased Maternal weight fell during pregnancy with famine exposure Third trimester famine exposure had strong effect on birthweight Third trimester famine exposure was associated with infant mortality at 30-90 days

28
Birth Cohorts

29
Obesity in Young Men after Famine Exposure in Utero and early Infancy (Ravelli et al NEJM, 1976) N=300, 000 Dutch military inductees at age 19 Famine exposure in first 2 trimesters lead to 80% higher prevalence of overweight (p<0.0005) Famine exposure in last trimester or famine exposure in first 5 months of life associated with 40% lower prevalence of overweight (p<0.005)
 N=300, 000 Dutch military inductees at age 19 Famine exposure in first 2 trimesters lead to 80% higher prevalence of overweight (p<0.0005) Famine exposure in last trimester or famine exposure in first 5 months of life associated with 40% lower prevalence of overweight (p<0.005)")
30
Adult Obesity

31
Interpretation? Cohort B1 –Conceived and gestated at time of moderate caloric restriction –Born into time of famine –Low rates of adult obesity Cohort D1 –Conceived and gestated at a time of famine –Born into food sufficiency –High rates of adult obesity

32
Second Generation Modest association found in this cohort between birthweights of mothers and their offspring.

33
Other Results for Infants Exposed to Famine Excess central nervous system disorders (such as NTD) Famine exposure associated with twofold risk of schizophrenia in 50 year old women.
 Famine exposure associated with twofold risk of schizophrenia in 50 year old women.")
34
Prenatal exposure to famine and brain morphology in schizophrenia Hulshoff Pol HE; Hoek HW; Susser E; Brown AS; Dingemans A; Schnack HG; van Haren NE; Pereira Ramos LM; Gispen-de Wied CC; Kahn RS; American Journal of Psychiatry, Jul 2000;

35
Methods Nine schizophrenic patients and nine healthy comparison subjects exposed during the first trimester of gestation to the Dutch Hunger Winter were evaluated with magnetic resonance brain imaging, as were nine schizophrenic patients and nine healthy subjects who were not prenatally exposed to the famine.

36
RESULTS: Prenatal famine exposure in patients with schizophrenia was associated with decreased intracranial volume. Prenatal Hunger Winter exposure alone was related to an increase in brain abnormalities, predominantly white matter hyperintensities.

37
Further evidence of relation between prenatal famine and major affective disorder. Alan S Brown; Jim van Os; Corine Driessens; Hans W Hoek; et al; The American Journal of Psychiatry; Washington; Feb 2000;

38
Methods Compared the risk of major affective disorder requiring hospitalization in birth cohorts who were and were not exposed, in each trimester of gestation, to famine during the Dutch Hunger Winter of 1944- 1945.

39
Results The risk of developing major affective disorder requiring hospitalization was increased for subjects with exposure to famine in the second trimester and was increased significantly for subjects with exposure in the third trimester, relative to unexposed subjects.

40
Fetal Nutrition and Chronic Diseases of Adulthood Developmental Origins of Health & Disease

41
Fetal Origins Concepts Barker et al Nutrition in early life has permanent effects Undernutrition has different effects at different times of life. Rapidly growing fetuses and neonates are vulnerable to undernutrition Undernutrition results from inadequate maternal intake, transport, or transfer of nutrients.

42
The Barker Hypothesis Adverse intrauterine events permanently “program” postnatal structure/function/homeostasis Fetal Origins of Adult Disease * Better chance of fetal survival * Increased risk of adult disease “Adapted Birth Phenotype” Susan P. Bagby, MD, Professor of Medicine & Physiology/Pharmacology Division of Nephrology & Hypertension OHSU, Portland, OR

43
FETAL ORIGINS OF ADULT CVASC DISEASE MODIFIERS COFACTORS Low Birthweight/IUGR Adverse Intrauterine Events Adult “Metabolic Syndrome” Abd’l Obesity HTN CAD Diabetes TG/ HDL Renal Failure In Utero In Utero Birth BirthChildhoodAdulthood

44
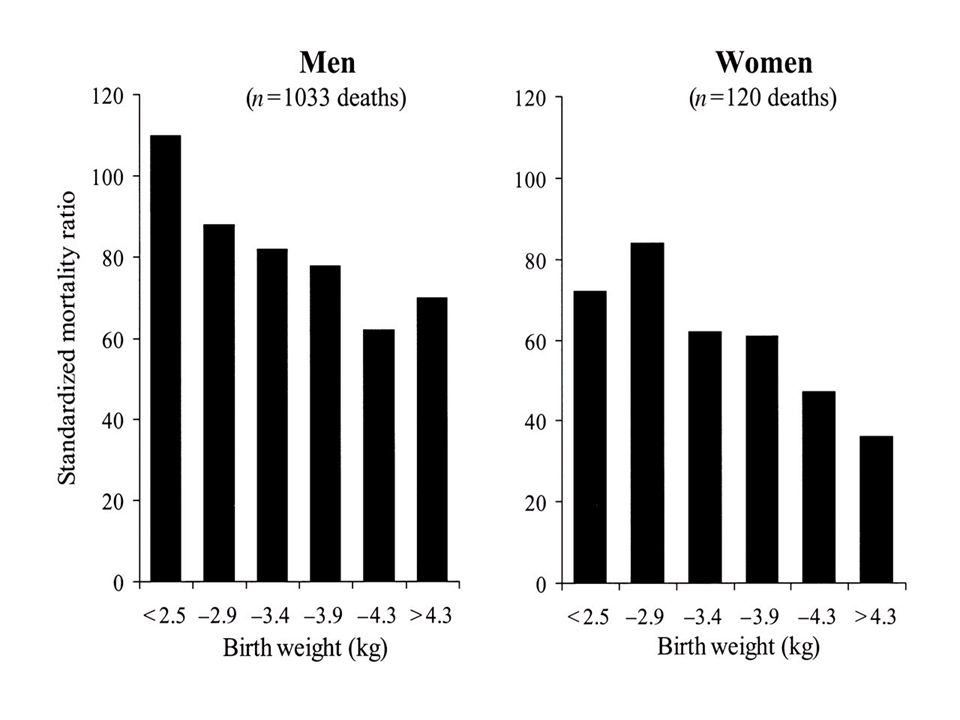
Coronary heart disease death rates, expressed as standardized mortality ratios, in 10,141 men and 5585 women born in Hertfordshire, United Kingdom, from 1911 to 1930, according to birth weight. (Osmond C, Barker DJP, Winter PD, Fall CHD, Simmonds SJ. Early growth and death from cardiovascular disease in women. BMJ 1993;307:1519–24)
.")
46
Age-adjusted Relative Risk of Non- fatal Coronary Heart Disease and Stroke 121,700 American Nurses, self report study BMJ 315:396,1997 5.0 7.5 10.0 0.50 0.75 1.00 1.25 1.50 Birthweight Relative Risk Mean ± 95% CL

47
Catch-up growth in childhood and death from coronary heart disease: longitudinal study (Eriksson et al, BMJ, 1999) Subjects: 3641 men born in Helsinki between 1924-1933 Followed with school data for weight and height Deaths from coronary heart disease from 1971-95 (standardized mortality ratios) were endpoints.
 Subjects: 3641 men born in Helsinki between Followed with school data for weight and height Deaths from coronary heart disease from (standardized mortality ratios) were endpoints.")
48
Catch-up growth in childhood and death from coronary heart disease: longitudinal study (Eriksson et al, BMJ, 1999 Men who had low birth weight or were thin at birth have high death rates from coronary heart disease Death rates are even higher if weight "catches up" in early childhood Death from coronary heart disease may be a consequence of prenatal undernutrition followed by improved postnatal nutrition Programs to reduce obesity among boys may need to focus on those who had low birth weight or who were thin at birth

49
Early Nutrition & Chronic Disease in Adulthood (Waterland& Garza, Am J Clin Nutr, 1999;69:179-97) Epi studies: BMI, CVD, Htn, IGT Animal studies Potential mechanisms of metabolic imprinting
 Epi studies: BMI, CVD, Htn, IGT Animal studies Potential mechanisms of metabolic imprinting")
50
Diabetes in Low-Birth-Weight Men Hales et al. BMJ 303: 1019, 1991 Birth Weight (lbs) % Impaired Gluc Tol or DM 9.5 40 30 20 10 0 370 men Age 64 yrs Odds Ratio/Adj for BMI 8 6 4 2 0 Gestat’l DM
 % Impaired Gluc Tol or DM men Age 64 yrs Odds Ratio/Adj for BMI Gestat’l DM.")
51
Preadult Influences on Cardiovascular Disease and Cancer (Leon & Ben-Shlomo in A Lifecourse approach to chronic disease epidemiology, 1997) 5 large retrospective studies - 4 found inverse relationship between birth weight and adult CVD Confounding issues include SES and BMI The relationship between birth weight and BMI complicates studies of birth weight and chronic disease
 5 large retrospective studies - 4 found inverse relationship between birth weight and adult CVD Confounding issues include SES and BMI The relationship between birth weight and BMI complicates studies of birth weight and chronic disease")
52
Fetal Milieu Affects Obesity Risk Birth Weight (kg) Odds Ratio For Obesity Eriksson J et al Internatl J Obesity 2001 Trouble at Both Ends of the Birth Weight Spectrum
 Odds Ratio For Obesity Eriksson J et al Internatl J Obesity 2001 Trouble at Both Ends of the Birth Weight Spectrum")
53
CVD “The preponderance of data suggest an inverse association between birth weight and adult CVD risk.” (Waterland and Garza)
")
54
Blood Pressure “Retrospective studies in diverse populations have found that birth weight is inversely correlated with adult blood pressure. Although each of the studies has some weaknesses, together they support a biological link between intrauterine growth and adult blood pressure” (Waterland and Garza)
.")
55
Birth Weight (gm) 4500 130 128 126 124 122 Sys BP (mmHg) Birth Weight Predicts Blood Pressure at Age 31 1966 Northern Finland Birth Cohort +/- adjust for current BMI Jarvelin M et al. Hypertension 2004 Variables: Birth Weight Ponderal Index Sex Gestational age Mat’l Ht, Wt Parity Socioeconomic Current BMI n = 5960 offspring

56
Birthweight and Adult HTN in US Women Nurses Health Study I Birthweight Category (lbs) < 5.0 5.0-5.5 5.6-7.0 7.1-8.5 8.6-10.0 HTN Prevalence (%) 40301510 Age 46-71 8.4% Age Age 30-55 30-55 3.1%
 < HTN Prevalence (%) Age % Age Age %")
57
Early Growth Patterns Predict Adult HTN Barker et al. J HTN 20:1951, 2002. Cohort Average (n=8760) }
 }.")
58
Impaired Glucose Tolerance Several large retrospective cohort studies in several countries have found relationship between bw and IGT. 266 men and women at age 50: odds ratio for ITG or type II diabetes were 3.5 for men and 12 for women with birth weights 3.4 (Phillips et al, Diabetologia, 1994)
.")
59
Impaired Glucose Tolerance, cont.. In some populations (ex: Pima Indians) both high and low birth weights are associated with IGT in adults.
 both high and low birth weights are associated with IGT in adults..")
60
Animal Models (Waterland and Garza) “Overall the data from animal models of metabolic imprinting support the observed epidemiological associations.”
 Overall the data from animal models of metabolic imprinting support the observed epidemiological associations.")
61
Effect of Gestational Type 2 Diabetes on Body Weight in Adult Offspring

62
Framework for understanding the maternal regulation of fetal development and programming. Keith M Godfrey and David JP Barker (Fetal nutrition and adult disease Am J Clin Nutr 2000 71: 1344-1352)
.")
64
Asymmetric Growth Restriction Adverse Intrauterine Events * Low Birth Weight for Gestational Age * Low Wt: Height Ratio (thinness) * Relative sparing of heart, brain, adrenal * Disproportionate reduction of kidney, liver, pancreas, skeletal muscle mass * Reduced abdominal girth
 * Relative sparing of heart, brain, adrenal * Disproportionate reduction of kidney, liver, pancreas, skeletal muscle mass * Reduced abdominal girth")
65
Fetal Origins of Adult Disease Asymmetric Growth Restriction From Barker, 1998 “ More powerful predictor than other risk factors ” Thin * Thin Small abdominal * Small abdominal girth ( liver size) girth ( liver size) Low arm cir- * Low arm cir- cumference cumference ( muscle mass) ( muscle mass) * Preserved central fat mass central fat mass
 girth ( liver size) Low arm cir- * Low arm cir- cumference cumference ( muscle mass) ( muscle mass) * Preserved central fat mass central fat mass")
66
? % Growth-Restricted Phenotype in Lower Birth Weight Categories Conceptual Graph

67
Potential Mechanisms of Developmental Programming Kidney Kidney Nephron #HTN Pancreas Pancreas Islet Cell # Insulin secretion Glucose Muscle Muscle muscle mass Basal met rate Exercise capacity Heart myocyte # Risk CHF Liver cells #? lipid metabolism Structural Deficits Reduced Functional Units in Organs

68
Low Birth Wt, Low Nephron Number and HTN Brenner et al. 1988,1994 What Conveys Risk of HTN in Lower Birth-weight Offspring ? “… retardation of renal development as occurs in individuals of low birth weight gives rise to increased postnatal risks for systemic and glomerular hypertension as well as enhanced risk of expression of renal disease.” 2 1 Am J HTN 1988 1:335-47; 2 Am J Kid Dis 1994 23: 171

69
Branching Morphogenesis Nephrogenesis New Nephrons Form in Concentric Layers during Gestation Condensing Mesenchyme Comma Shaped Bodies Outer Nephrogenic Layer Glomeruli

70
Birth Weight Predicts Nephron Number 230,000 nephrons per kg increase in birth weight In Term Births: Ages 1-17 yrs All Ages Hughson et al, Kid Internat (2003) 63, 2113 Also: Merlet-Benichou et al, 1999 Manalich et al, 2000
 63, 2113 Also: Merlet-Benichou et al, 1999 Manalich et al, 2000")
71
FOOD CATCH-UP GROWTH BP Asymmetric Growth Restriction in Utero Maternal Protein Deficiency Impaired Kidney Development # Nephrons (permanent) “The Thrifty Phenotype” BODY MASS # Nephrons
 The Thrifty Phenotype BODY MASS # Nephrons")
72
Rethinking “FOAD” Programming events may act: Periconceptually Prenatally Postnatally: infancy, childhood Cardiovascular outcomes may appear: In childhood, adolescence In midlife In elderly

73
Rapid Infant Growth and Risk of Childhood Adiposity Stettler et al, Ped. 109, 2002. Birthweight Rate of Wt Gain In first 4 mo Prevalence of Overweight at Age 7 Yrs

74
Infant Growth Rate and Coronary Disease BMI Weight Height Cohort 0 2 4 6 8 10 12 Age in Years Standard Deviation (Z) Score 0.05 0 - 0.05 - 0.10 - 0.15 - 0.20 - 0.25 4630 Helsinki boys 357 developed CHD Barker DJ. TRENDS Endo Metab 13; Nov 2002

75
DEVELOPMENTAL ORIGINS OF HEALTH & DISEASE In Utero In Utero Birth BirthChildhoodAdulthood Low Birthweight/IUGR Fetal Undernutrition “Metabolic Syndrome” Abd’l Obesity HTN CAD Diabetes TG/ HDL Renal Failure Accelerated Growth Growth + Infant Undernutrition 0-1 yr Food: Access Palatability Inter-Generational Transmission

76
Early Nutrition & Chronic Disease in Adulthood (Waterland& Garza, Am J Clin Nutr, 1999;69:179-97) Potential mechanisms of metabolic imprinting
 Potential mechanisms of metabolic imprinting")
77
Epigenetics Epigenetics = the study of stable alterations in gene expression that arise during development and cell proliferation Epigenetic phenomena do NOT change the actual, primary genetic sequence Epigenetic phenomena are important because, together with promotor sequences and transcription factors, they modulate when and at what level genes are expressed The protein context of a cell can be understood as an epigenetic phenomena. Examples include: DNA methylation, histone hypo- acetylation, chromatin modifications, X-inactivation, and imprinting. http://cnx.rice.edu/content/m11532/latest/

78
Metabolic Imprinting “…the basic biological phenomena that putatively underlie relations among nutritional experiences of early life and later diseases.”

79
Metabolic Imprinting: Characteristics Susceptibility limited to a critical ontogenic window early in development Persistent effect lasting through adulthood Specific and measurable outcome Dose-response or threshold relation between exposure and outcome

80
Metabolic Imprinting: Potential Mechanisms Organ structure Cell number & function Clonal selection Metabolic differentiation

81
Organ Structure Organogenesis starts early: by 5 weeks rudimentary organs are in place, by 8 weeks organogenesis is nearly complete Driven by inductive signals from adjacent cells and morphogen gradients (ex: retinoic acid/vit. A) Local concentrations of nutrients and metabolites may modulate this process.
 Local concentrations of nutrients and metabolites may modulate this process..")
82
Cell Number Tissues go through limited periods of hyperplastic and hypertrophic growth Rate of growth is dependent on nutrient availability Winnick’s rat studies found severe malnutrition during critical periods limited brain cell number An organ’s metabolic activity is limited by cell number

83
Cell Function: Early nutrition may influence the cascade that establishes cell specific patterns. Ex: hepatocyte polyploidization - in adults hepatocytes often have > normal complement of chromosomes and increased metabolic activity. Lack of polyploidization could limit hepatic metabolic activity.

84
Clonal Selection Each organ is based on a finite number of founder cells which may have slight differences Founder cells that divide the most rapidly may disproportionally make up a tissue Nutrient availability may “select” cells with certain characteristics Ex: cells with more active lipogenic pathways could grow faster if access to fatty acids was limited

85
Metabolic Differentiation Process: cells develop stable patterns of basal and inducible gene expression Cells are characterized by the ability to express a limited number of genes. Mechanisms of control include: –chromatin structure (DNA “packaging”) –transcription factors (maintained through cell divisions) –DNA methylation
 –transcription factors (maintained through cell divisions) –DNA methylation.")
86
Gluckman et al. Biology of the Neonate, 2005

Similar presentations


 José M. Olmas, MD; Professor of Obstetrics and Master in Maternal-Child Health And Eduardo Halac, MD; Professor.>")


