Download presentation
Presentation is loading. Please wait.

1
WASH and Child Growth & Development Washington, DC | May 2-3, 2013 Val Curtis London School Of Hygiene and Tropical Medicine & Alan Dangour, Oliver Cumming, SHARE, DFID Clean, Fed & Nurtured: Joining forces to promote child growth and development

2
WASH basics Water – quantity and quality Sanitation – Faecal waste disposal Hygiene – Hand, Food, Environment

3
0.85m deaths a year 2-3.5bn episodes Source: Liu et al, Lancet 2012

4
Faeces Fluids Fields Flies Fingers Foods New Host

5
Faeces Fluids Fields Flies Fingers Foods New Host

6
Faeces Fluids Fields Flies Fingers Foods New Host

7
Faeces Fluids Fields Flies Fingers Foods New Host

8
Faeces Fluids Fields Flies Fingers Foods New Host

9
Faeces Fluids Fields Flies Fingers Foods New Host

10
Faeces Fluids Fields Flies Fingers Foods New Host

12
Source: Global Water Supply and Sanitation Assessment 2010 Report: WHO and UNICEF, 2012 2.6bn have no safe toilet 0.8bn have no safe drinking water 20%?? HWWS

13
WASH and nutrition Faecal-oral exposure Diarrhoeal Diseases Environmental Enteropathy Nematode infection Poor WASH Poor nutritional status

15
Cochrane Public Health Group Includes – RCTs – non-randomised controlled studies – interrupted time series studies WASH included as one intervention

16
Review protocol All included studies to have controlled design Participants: children < 18 years old Intervention types – Improving access to facilities which ensure the hygienic separation of human excreta from human contact – Promotion of hand washing with soap – Introducing a new/improved water supply and/or improved distribution – Improving the microbiological quality of drinking water

17
Outcomes, search strategy Primary outcomes (z-scores) – Weight-for-height (wasting) – Weight-for-age (underweight) – Height-for-age (stunting) Secondary outcomes – All other child anthropometric measures – Biochemical measures of micronutrient status 6 databases searched; keyword and MeSH terms 3 main Chinese databases searched
 – Weight-for-height (wasting) – Weight-for-age (underweight) – Height-for-age (stunting) Secondary outcomes – All other child anthropometric measures – Biochemical measures of micronutrient status 6 databases searched; keyword and MeSH terms 3 main Chinese databases searched")
18
Search results

19
Included studies 12 studies from 10 countries – Bangladesh (1989; 1993) – Guatemala (1968; 2009) – Pakistan (2012) – Kenya (2011) – Ethiopia (2012) – Nigeria (1990) – Nepal (2011) – Chile (1983) – South Africa (2010) – Cambodia (2011) Duration: 6 mo to 5 years Sample: n=8,500; all <5 years
 – Guatemala (1968; 2009) – Pakistan (2012) – Kenya (2011) – Ethiopia (2012) – Nigeria (1990) – Nepal (2011) – Chile (1983) – South Africa (2010) – Cambodia (2011) Duration: 6 mo to 5 years Sample: n=8,500; all <5 years")
20
Interventions Studies included from 1 to 4 WASH interventions Interventions – Provision of flocculent water disinfectant – Provision of a protected water supply – Installation of boreholes and hand pumps – Solar water disinfection (SODIS) – Sanitation education – Construction of sanitary facilities – Provision of soap – Promotion of hand washing with soap
 – Sanitation education – Construction of sanitary facilities – Provision of soap – Promotion of hand washing with soap")
21
Study designs Multiple designs – Randomised controlled trials (3) – Follow-up of cluster randomised controlled trial (1) – Longitudinal study with control group (3) – Repeat cross-sectional with control group (3) – Controlled before-and-after study (1) – Cross-sectional with intervention and historic control group matched by propensity score matching (1) No study considered high quality according to Cochrane criteria
 – Follow-up of cluster randomised controlled trial (1) – Longitudinal study with control group (3) – Repeat cross-sectional with control group (3) – Controlled before-and-after study (1) – Cross-sectional with intervention and historic control group matched by propensity score matching (1) No study considered high quality according to Cochrane criteria")
22
Results table n=8,500 StudynReported effect (HAZ unless stated) Ahmed 1993298Mean WAZ: P< 0.05 Arnold 2009877MD: 0.04 (-0.19, 0.27) Bowen 2012461MD: -0.08 (-0.29, 0.13) Du Preez 2010329MD: 0.15 (-0.14, 0.44) (not published) Du Preez 2011521MD: 0.12 (-0.15, 0.39) Fenn 20121899MD: 0.22 (0.11, 0.33) Guzman 1968N.D.Mean height: no stat. test Hasan 1989405No statistically different differences Huttly 1990180 – 368Decline in % children with low W/H: P<0.005 Langford 201188MD: -0.13 (-0.54, 0.28) McGuigan 2012753MD: 0.18 (-0.06, 0.42) (not published) Schlesinger 1983199% low weight: P<0.05 for change in control group
 McGuigan MD: 0.18 (-0.06, 0.42) (not published) Schlesinger % low weight: P<0.05 for change in control group.")
23
HAZ (all studies)
")
24
HAZ meta-analysis n=1,603 I 2 = 0%

25
WAZ meta-analysis n=1,616 I 2 = 5%

26
WHZ meta-analysis n=1,605 I 2 = 0%

27
Interpretation Number of children included in studies reasonable Quality of studies is limited Cochrane meta-analysis suggests that WASH improves HAZ by ~0.15 SD Supported by IPD analysis “Suggestive evidence of benefit”

28
Concerns Publication bias Quality of studies Links in the pathway?

29
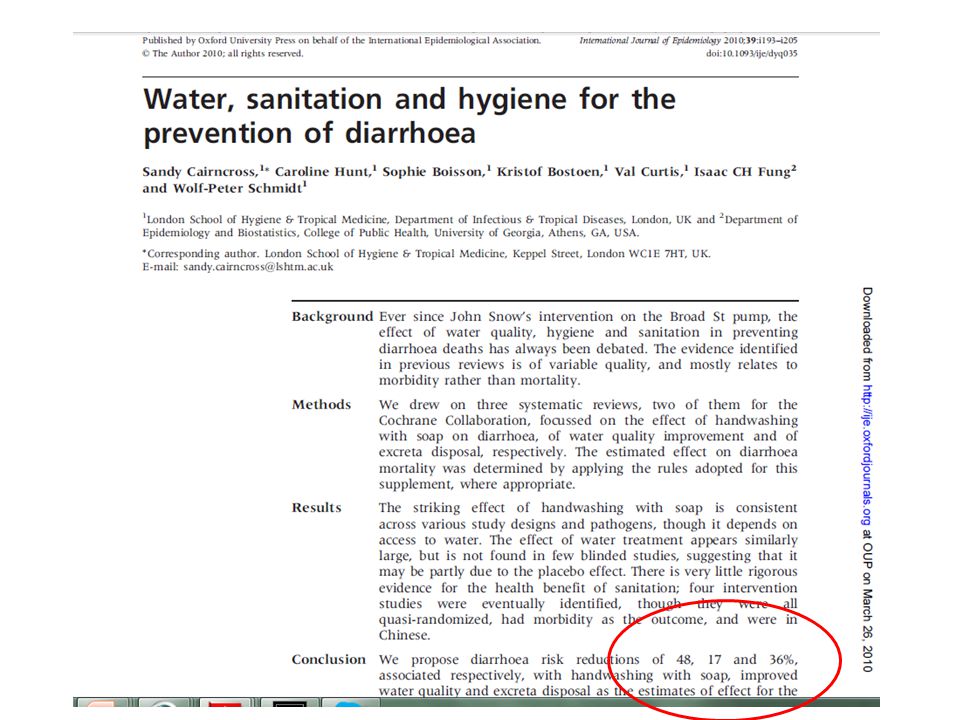
Conclusions of Cochrane review First systematic review of WASH and nutrition 12 studies (of mixed quality) provide data for analysis Suggestive evidence of benefit of WASH on linear growth More evidence on the way And still more needed!
 provide data for analysis Suggestive evidence of benefit of WASH on linear growth More evidence on the way And still more needed!")
30
WASH and nutrition Faecal-oral exposure Diarrhoeal Diseases Environmental Enteropathy Nematode infection Poor WASH Poor nutritional status

31
Diarrhoea and stunting Diarrhoea associated with poor nutritional status but causal link hard to demonstrate Poor nutritional status associated with greater risk of diarrhoea (Briend, 1990; Checkley et al, 2002) Recent analysis of 9 studies with daily diarrhoea morbidity data and longitudinal anthropometry (Checkley et al, 2008): – Odds of stunting at age 24 mo increased with each diarrhoeal episode before 24 mo (P<0.001) – Odds of stunting at age 24 mo increased by 1.13 (95% C.I. 1.07, 1.19) for every five episodes – Consistent with hypothesis that higher cumulative burden of diarrhoea increases risk of stunting
 for every five episodes – Consistent with hypothesis that higher cumulative burden of diarrhoea increases risk of stunting.")
32
WASH and nutrition Faecal-oral exposure Diarrhoeal Diseases Environmental Enteropathy Nematode infection Poor WASH Poor nutrition Time, costs, workload Other Diseases

33
WASH and ECD Faecal-oral exposure Diarrhoeal Diseases Environmental Enteropathy Nematode infection Poor WASH Poor ECD Time, costs, workload Other Diseases

34
Diarrhoea/Giardia and ECD High diarrheal disease burdens before 2 years of age linked with delayed school entry and poorer performance on intelligence tests – Patrick et al 2005. – Lorntz et al 2006 Multiple infections with Giardia associated with a 4-point (0.27 SD) deficit on a standardized intelligence test at 9 years of age. – Berkman et al 2002
 deficit on a standardized intelligence test at 9 years of age. – Berkman et al")
35
Bowen et al 2012... “At 5 to 7 years of age, children randomized to home-based handwashing promotion during their first 30 months of life attained global developmental quotients more than 6 points (0.4 SD) greater than control children. The effect size was similar across all 5 domains (adaptive, personalsocial, communication, cognitive, and motor)...and is comparable to gains after participation in the US publicly funded Head Start preschool program for poor children (SD, 0.33-0.46 compared with parental care) and early intervention programs for premature infants (SD, 0.46) Such an effect size is regarded as clinically meaningful and some estimate that a societal shift of this magnitude would yield trillions of dollars in increased productivity.”
 greater than control children. The effect size was similar across all 5 domains (adaptive, personalsocial, communication, cognitive, and motor)...and is comparable to gains after participation in the US publicly funded Head Start preschool program for poor children (SD, compared with parental care) and early intervention programs for premature infants (SD, 0.46) Such an effect size is regarded as clinically meaningful and some estimate that a societal shift of this magnitude would yield trillions of dollars in increased productivity. .")
36
Conclusions Systematic reviews are blunt instruments but the best we have All studies need publishing Ever more evidence to collect? Should that hold us back? Is this about competition?

37
NUTRITION and Child Growth & Development Washington, DC | May 2-3, 2013 Kay Dewey UC-Davis and Alive & Thrive Clean, Fed & Nurtured: Joining forces to promote child growth and development

38
Nutrition Basics IYCF = infant and young child feeding, to 2 years WHO-recommended feeding practices for: – Breastfeeding (early initiation; exclusive BF; continued BF) – Complementary feeding (e.g. amount, consistency, frequency, diversity & types of foods), including: Safe preparation & storage of complementary foods (relevant to WASH) Responsive feeding practices (relevant to ECD) Established indicators: – Feeding practices (8 core WHO/UNICEF indicators) – Anthropometric measures (e.g., weight for age, height for age, weight for height, arm circumference) Reduction in stunting (very short height for age) is a key goal
, including: Safe preparation & storage of complementary foods (relevant to WASH) Responsive feeding practices (relevant to ECD) Established indicators: – Feeding practices (8 core WHO/UNICEF indicators) – Anthropometric measures (e.g., weight for age, height for age, weight for height, arm circumference) Reduction in stunting (very short height for age) is a key goal.")
39
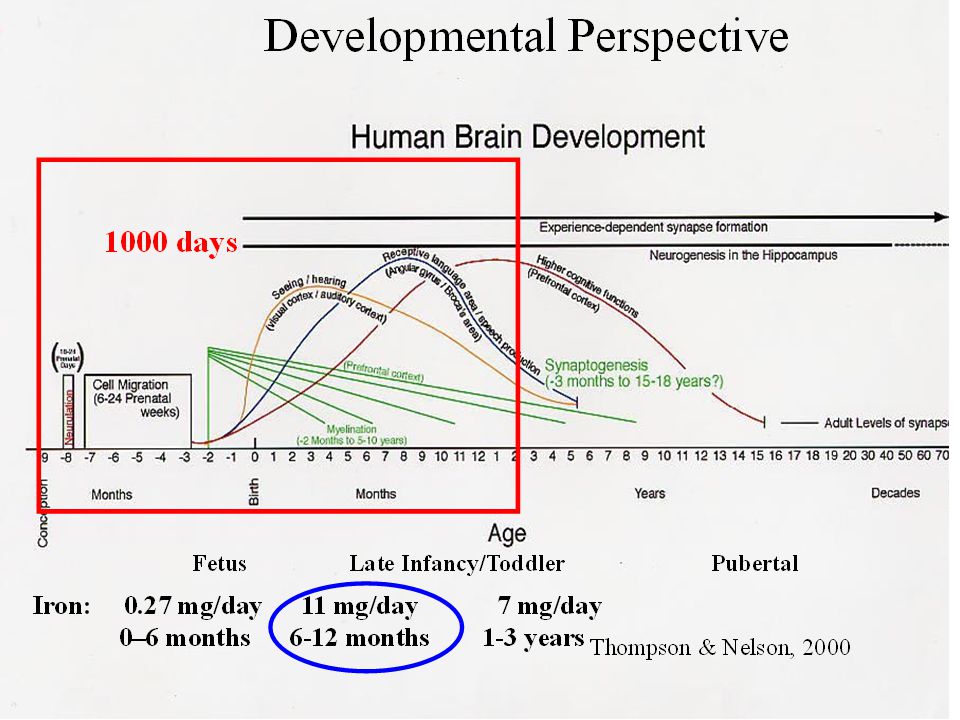
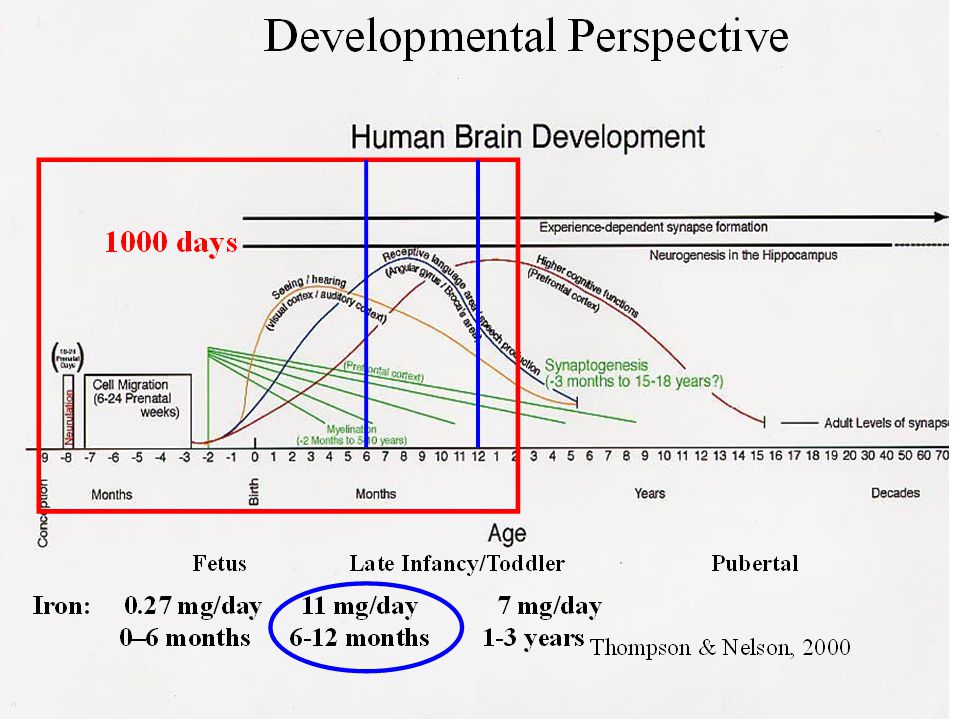
Key window for nutrition interventions Preconception through pregnancy 0-6 mo: Exclusive breastfeeding 6-24 mo: Complementary feeding Guiding principles for complementary feeding (2003; 2005)
")
40
Outline Impact of nutrition interventions on linear growth (child’s height) Impact of nutrition on child development The need for combined interventions
 Impact of nutrition on child development The need for combined interventions")
41
Impact of nutrition on child growth

42
Prenatal nutrition interventions Iron & folic acid supplements Multiple micronutrient supplements Balanced protein-energy supplements Fortified foods for pregnant women Potential for major impact on stunting, but evidence is mixed

43
Prenatal nutrition interventions A.Multiple micronutrient supplements (usually compared with iron & folic acid) Meta-analysis in 2009 (Fall et al.): Small but significant increase in birth weight (+22 g) but not birth length (+0.06 cm) – Measurement issues? 11-17% reduction in low birth weight Impact only evident in mothers with higher BMI Meta-analysis in 2012 (Ramakrishnan et al.): Increase in mean birth weight (+53 g); data on birth length not presented 14% reduction in low birth weight
: Increase in mean birth weight (+53 g); data on birth length not presented 14% reduction in low birth weight.")
44
Prenatal nutrition interventions B. Balanced protein-energy supplementation Meta-analysis in 2003 (Kramer & Kakuma): Increase in mean birth weight (+38 g) but not birth length (+0.1 cm) 32% reduction in small-for-gestational-age births Larger effect on birth weight in hungry season and in undernourished women Meta-analysis in 2012 (Imdad & Bhutta): Increase in mean birth weight (+73 g); did not report birth length 32% reduction in LBW and 34% reduction in SGA births Larger effect on birth weight in undernourished women
: Increase in mean birth weight (+38 g) but not birth length (+0.1 cm) 32% reduction in small-for-gestational-age births Larger effect on birth weight in hungry season and in undernourished women Meta-analysis in 2012 (Imdad & Bhutta): Increase in mean birth weight (+73 g); did not report birth length 32% reduction in LBW and 34% reduction in SGA births Larger effect on birth weight in undernourished women.")
45
Prenatal nutrition interventions C. Fortified foods for pregnant women Lipid-based nutrient supplement (LNS) (Huybregts et al. Am J Clin Nutr 2009), Burkina Faso LNS: 373 kcal/d & similar micronutrients as MMN tablets LNS group (compared to MMN): – Birth weight +31 g (p=0.2) – Birth length +0.46 cm (p=0.001) effect greater in mothers with BMI < 18.5 (+1.2 cm) Same research group previously showed that MMN (vs. control) increased birth length by 0.36 cm; thus predicted impact of LNS vs. control would be 0.46 + 0.36 = 0.82 cm (effect size 0.33)
 (Huybregts et al. Am J Clin Nutr 2009), Burkina Faso LNS: 373 kcal/d & similar micronutrients as MMN tablets LNS group (compared to MMN): – Birth weight +31 g (p=0.2) – Birth length cm (p=0.001) effect greater in mothers with BMI < 18.5 (+1.2 cm) Same research group previously showed that MMN (vs. control) increased birth length by 0.36 cm; thus predicted impact of LNS vs. control would be = 0.82 cm (effect size 0.33).")
46
Exclusive breastfeeding 0-6 mo Large impact on infant survival Little evidence of impact on stunting – Effect may be more likely in populations with high rates of infection during the first 6 mo postpartum, where promotion of exclusive breastfeeding may reduce infection and thus be more likely to promote linear growth than in populations where such infections are less common – Insufficient evidence to evaluate this question at present 46

47
Complementary feeding 6-24 mo Several strategies: – Educational approaches – Increasing energy density of complementary foods – Provision of complementary food – Fortification Potential for major impact on stunting but evidence is mixed 47 6-24 mo: Complementary feeding Guiding principles for complementary feeding (2003; 2005)
")
48
Complementary Feeding - 1 Educational approaches – mixed results – Most showed little or no impact – Peru study illustrated substantial potential to improve linear growth (Effect size=0.5): emphasized consumption of nutrient-rich animal- source foods & was conducted in a population where animal-source foods were available & affordable – Two recent studies (Shi et al.; Vazir et al.) show modest impact (Effect size ~0.2): both emphasized key messages including dietary diversity and animal-source foods
: emphasized consumption of nutrient-rich animal- source foods & was conducted in a population where animal-source foods were available & affordable – Two recent studies (Shi et al.; Vazir et al.) show modest impact (Effect size ~0.2): both emphasized key messages including dietary diversity and animal-source foods")
49
Complementary Feeding - 2 Interventions to increase energy density – mixed results – Of 5 studies, 2 had positive impact but 3 had no impact on energy intake or growth – May be effective when traditional complementary food has low energy density & infant unable to compensate by increasing volume of food consumed or feeding frequency

50
Complementary Feeding - 3 Provision of complementary food – mixed results – Average effect size ~0.2-0.3, but wide range May depend on food security of target population May depend on nutrient quality of food provided – Two studies directly compared food + education vs. education only (both in S Asia): somewhat greater impact when food included
: somewhat greater impact when food included.")
51
Complementary Feeding - 4 Fortification (or improved bioavailability) alone has little effect on linear growth – Exception: fortified vs. unfortified milk powder in India Combination of macro- and micro-nutrients in may have a larger impact Nutrient quality of fortified products is likely to be important – Amount and bioavailability of nutrients needed for growth – Inclusion of milk – Essential fatty acids

52
Summary of impact of nutrition interventions on stunting Nutrition interventions (alone) have had a modest impact on linear growth – Need to be realistic about expected impact of nutrition interventions However, impact on % with very low height (stunting) may be larger than effect on mean height
 have had a modest impact on linear growth – Need to be realistic about expected impact of nutrition interventions However, impact on % with very low height (stunting) may be larger than effect on mean height")
53
Impact of nutrition on child development

54
Potential mechanisms for the effect of nutrient deficiency on children’s cognitive, motor, and socio-emotional development From: Prado & Dewey, A&T Technical Brief

55
Nutrition and Brain Development in Early Life (Prado & Dewey, A&T Technical Brief) 1) Adequate nutrition during pregnancy and the first two years is necessary for normal brain development, laying the foundation for future cognitive and social ability, school success, and productivity. 2) Priority should be given to the prevention of: Severe acute malnutrition Intrauterine growth retardation Stunting Iron-deficiency anemia Iodine deficiency
 Priority should be given to the prevention of: Severe acute malnutrition Intrauterine growth retardation Stunting Iron-deficiency anemia Iodine deficiency.")
56
Nutrition and Brain Development in Early Life (Prado & Dewey, A&T Technical Brief) 3) There is growing evidence for beneficial effects on ECD of: Breastfeeding promotion Pre- and post-natal multiple micronutrient supplementation Pre- and post-natal supplementation with essential fatty acids Fortified food supplements provided during pregnancy and to the child from 6 to 24 mo 4) An integrated approach is likely to be most effective for promoting optimal child development, i.e., interventions that combine improved nutrition with other strategies such as enhancing the home environment and the quality of caregiver- child interaction.
 3) There is growing evidence for beneficial effects on ECD of: Breastfeeding promotion Pre- and post-natal multiple micronutrient supplementation Pre- and post-natal supplementation with essential fatty acids Fortified food supplements provided during pregnancy and to the child from 6 to 24 mo 4) An integrated approach is likely to be most effective for promoting optimal child development, i.e., interventions that combine improved nutrition with other strategies such as enhancing the home environment and the quality of caregiver- child interaction.")
57
The need for combined interventions Nutrition, infection control & care Prenatal + postnatal (and possibly pre-conception) Macronutrients + micronutrients: Adequate supply of macronutrients may be needed to ensure growth response to micronutrients
 Macronutrients + micronutrients: Adequate supply of macronutrients may be needed to ensure growth response to micronutrients")
58
How nutrition can reduce the negative impact of infections on child growth 1. Strengthening the immune system, thereby reducing the severity and duration of infections 2. Providing extra amounts of nutrients to compensate for poor absorption during infection, losses during diarrhoea, reallocation due to immune system activation or reduced appetite during infection 3. Providing nutrients for catch-up growth following infection, particularly those needed to build lean body tissue such as protein, potassium, magnesium, phosphorus, zinc and sodium 4. Preventing poor appetite caused by micronutrient deficiencies, thereby facilitating catch-up growth 5. Favoring the growth of beneficial bacteria in the gut that enhance gut function and immune defenses

59
Trials with combined nutrition + infection control are underway WASH Benefits (water, sanitation and hygiene interventions: singly, combined or in combination with nutrition intervention) SHINE (independent and combined effects of improved water, sanitation and hygiene and improved infant feeding) Both target mainly the postnatal period
 SHINE (independent and combined effects of improved water, sanitation and hygiene and improved infant feeding) Both target mainly the postnatal period")
60
Little evidence on impact of combined pre- and postnatal nutrition interventions Key trials conducted in 1970s INCAP trial in Guatemala – Fortified food (atole) with high milk content Bogota study in Colombia – Child’s food ration included milk Intervention trial with fortified food supplements provided both pre- and postnatally not attempted since
 with high milk content Bogota study in Colombia – Child’s food ration included milk Intervention trial with fortified food supplements provided both pre- and postnatally not attempted since")
61
Trials with combined pre- and postnatal nutrition are underway iLiNS Project: iLiNS-DYAD trials in Malawi and Ghana – Efficacy of maternal LNS given during pregnancy & first 6 mo postpartum + child LNS given 6-18 mo The Early Nutrition and Immune Development (ENID) Trial in the Gambia – Efficacy of prenatal and infancy nutritional supplementation, focused on infant immune development Rang-Din Nutrition Study in Bangladesh – Program efficacy study with 4 arms – one arm includes maternal LNS given during pregnancy & first 6 mo postpartum + child LNS given 6-24 mo
 Trial in the Gambia – Efficacy of prenatal and infancy nutritional supplementation, focused on infant immune development Rang-Din Nutrition Study in Bangladesh – Program efficacy study with 4 arms – one arm includes maternal LNS given during pregnancy & first 6 mo postpartum + child LNS given 6-24 mo")
62
Next steps? Evaluate impact of combined prenatal and postnatal nutrition, ECD enrichment and prevention/control of infection throughout the 1000 days – Efficacy – Effectiveness Understand role of pre-conception nutrition (trials underway) Understand role of maternal mental health
 Understand role of maternal mental health.")
63
Early Child Development Washington, DC | May 2-3, 2013 Maureen Black, Ph.D. University of Maryland School of Medicine Clean, Fed & Nurtured: Joining forces to promote child growth and development

64
Objectives Define Early Child Development Threats to Early Child Development – Toxic Stress – Undernutrition Development of Disparities & Lifespan Perspective Early Child Development Interventions – Early Learning Opportunities & Responsive Caregiving Integrated Interventions

65
Early Child Development Basics Early Child Development – Orderly progression of skills, based on maturation & adaptation to specific culture/settings – Direct and Indirect relationships – Confusion: ECD refers to the intervention and the outcome

66
Social-Ecological Theory of Child Development Distal threats and opportunities reach the child through Proximal interactions between child & family Bidirectional interactions Bronfenbrenner & Ceci, 1994

67
Family Support School and Community Services Child Development: Multiple Contributing Factors Health Nutrition Learning Opportunities Sensitive/ Responsive Caregiving Social Protection Protection from Stress/ Harm Nutrition is necessary for child development, but not sufficient!

68
Threats to Early Development Poverty and Undernutrition Toxic stress Children can handle, even benefit, from mild stress Toxic stress Institutionalization, maltreatment, neglect, trauma, undernutrition Lack of caregiver responsivity Shonkoff, Pediatrics, 2012

69
How Toxic Stress Undermines Child Development Non-reversible changes to children’s physiology – Dysregulation of neuroendocrine system Hypothalamic Pituitary Adrenal (HPA) Axis Elevated cortisol production – Disrupt inflammatory signaling Increased susceptibility to illness Johnson et al., Pediatrics, 2013; 131:319-327
 Axis Elevated cortisol production – Disrupt inflammatory signaling Increased susceptibility to illness Johnson et al., Pediatrics, 2013; 131:")
70
Parent Nurturance/Responsivity Johnson et al., Pediatrics, 2013; 131:319-327 Buffering effects of nurturant parenting

71
Hippocampal volume by preschool depression severity & maternal support Luby, PNAS, 2012;109(8):2854-9 Maternal support in early childhood predicts larger hippocampal volumes at school age. Positive, responsive relationships can alleviate negative effects of stress (brain structure/function).
..")
75
Development of disparities & lifespan perspective

77
2007 & 2011 Lancet Series on Child Development Over 200 million children < age 5 y in low & middle income countries do not reach developmental potential – Nutrition: Chronic undernutrition, micronutrient deficiencies – Lack of early learning opportunities – Extended to social & environmental risks Efficacy of early interventions – Early childhood policies & programs to reduce inequalities – Cost of not investing in child dev programs – Need for policies/procedures to scale up www.globalchilddevelopment.org

78
Target of Interventions Prenatal – Prevent Toxic stress/LBW/Prematurity Infancy – Breastfeeding, complementary feeding – Responsive Parenting – Opportunities for early learning – Routines to promote regulation – Family support Kramer et al., 2008; 2007 & 2011 Lancet series on Child Development

79
Early Child Development Intervention Early learning opportunities – Play – Explore – Interactions: give & take/serve & return Responsive Caregiving – Recognize & interpret child’s cues – Prompt – Developmentally appropriate – Enriching – Basis for responsive feeding Black & Aboud, 2012

80
Child opens mouth & accepts Caregiver offers another bite Child looks away, mouth shut Caregiver offers a bite of food … … … … … … …... Time … … … … RESPONSIVE FEEDING BEHAVIORS PROMOTES HEALTHY EATING & GROWTH PATTERNS Ummm, maybe she is telling me she wants to feed herself.

81
Child opens mouth & accepts Caregiver offers another bite Child looks away, mouth shut Child picks up food & eats Caregiver waits, smiles, finger food Caregiver offers a bite of food … … … … … … …... Time … … … … PROMOTES HEALTHY EATING & GROWTH PATTERNS RESPONSIVE FEEDING BEHAVIORS

82
Child opens mouth & accepts Caregiver offers another bite Child looks away, mouth shut Caregiver offers a bite of food … … … … … … …... Time … … … … NON-RESPONSIVE FEEDING BEHAVIORS HINDERS HEALTHY EATING & GROWTH PATTERNS Oh no, I am late. She has to finish eating.

83
Child opens mouth & accepts Caregiver offers another bite Child looks away, mouth shut Child Cries & spits out food Caregiver holds child & force feeds Caregiver offers a bite of food … … … … … … …... Time … … … … HINDERS HEALTHY EATING & GROWTH PATTERNS NON-RESPONSIVE FEEDING BEHAVIORS

84
Responsive/Unresponsive Feeding RESPONSIVE Provides healthy food on a regular schedule in a setting conducive to eating Caregiver reads infant cues of hunger/satiety Responds to infant quickly – Direct & Nurturant – Builds regulatory skills UNRESPONSIVE Controlling, indulgent, or uninvolved Ignores/overrides infant cues Associated with ⁻ Difficult temperament ⁻ Maternal mental health symptoms ⁻ Poor growth (under or overweight)
")
85
Parenting interventions (0-3 yrs) Home visits, guidance and support from health providers, and group parent training Impacts are larger when: – parents and children participate together – interventions involve modeling and practice of behavior – most disadvantaged children targeted Lancet series on child development, 2007, 2011
 Home visits, guidance and support from health providers, and group parent training Impacts are larger when: – parents and children participate together – interventions involve modeling and practice of behavior – most disadvantaged children targeted Lancet series on child development, 2007, 2011")
86
Preschool interventions (3-5 yrs) Preschools improve children's cognitive & social- emotional development: school readiness Impact is greatest with high quality programs – Teacher-student ratio – Developmental curriculum – Student exploration – Teacher responsivity Lancet series on child development, 2007, 2011
 Preschools improve children s cognitive & social- emotional development: school readiness Impact is greatest with high quality programs – Teacher-student ratio – Developmental curriculum – Student exploration – Teacher responsivity Lancet series on child development, 2007, 2011")
87
Characteristics of Successful Programs Integrated across sectors Focus on disadvantaged children Parents as partners with teachers to support children’s development Opportunities for children to initiate learning & play Blend traditional child care, cultural beliefs & evidence- based practices (curriculum, materials) Systematic in-service training, supervision, monitoring, and evaluation Lancet series on child development, 2007, 2011
 Systematic in-service training, supervision, monitoring, and evaluation Lancet series on child development, 2007, 2011")
88
How do Integrated Programs Work? Child Devel Intervention Child Development Direct effect of child development intervention Lancet series on child development, 2007, 2011 Social- Emotional Sensori- Motor Cognitive/ Language

89
How do Integrated Programs Work? Nutrition Intervention Child Development Social- Emotional Sensori- Motor Cognitive/ Language Direct effect of nutrition intervention

90
How do Integrated Programs Work? Nutrition Child Devel Intervention Child Development Social- Emotional Sensori- Motor Cognitive/ Language Additive effect of child development & nutrition intervention

91
Nutritional Supplementation and ECD Intervention in Jamaica Grantham McGregor et al., 1991

92
DQ/IQ Stunted and Non-stunted Children in Jamaica: Effects of ECD Intervention Walker et al., 2005 A = 9-24 mos, B = 33-48 mos, C = 7-8 yrs, D = 11-12 yes, E = 17-18 yrs.

93
How do Integrated Programs Work? Nutrition Child Devel Intervention Child Development Social- Emotional Sensori- Motor Cognitive/ Language Synergistic effect: Impact of 2 interventions greater than their sum. One intervention enhances the impact of the other intervention. Tested with an interaction term.

94
Example of Synergistic Intervention The effect of zinc supplementation onhand-eye coord. enhanced by participation in a stimulation intervention. Meeks Gardner et al., AJCN, 2005

95
Integrated Interventions Considerations Sectors differ (education & nutrition) Child development beyond 1000 days Overwhelm health care/nutrition system Overwhelm caregivers Outcome?? Rationale Same sites First 1000 days Overlapping goals Economy of scale Home/clinic visit – integrated messages Theory-based conceptualization

97
Integrated Interventions Questions Timing & severity of deprivations: Both nutrition and child development Timing, intensity, & duration of interventions 1000 days? Beyond? Training and Supervision: Ensure integration? Outcomes and analytic models Policies and integration across sectors Sustainability and Scale

98
Lifespan Benefits of Early Child Development Programs Ensure adequate nutrition, esp. first 1000 days School readiness (parenting & preschool programs) Academic success Healthy psychological development Avoid early pregnancy Reduce violence & illegal behavior Positive earning potential Adult health & civic contribution Strong & healthy children – 2 nd gen Break the Cycle of Poverty and Disparities Promote Human Capital
 Academic success Healthy psychological development Avoid early pregnancy Reduce violence & illegal behavior Positive earning potential Adult health & civic contribution Strong & healthy children – 2 nd gen Break the Cycle of Poverty and Disparities Promote Human Capital.")
99
I need opportunities to play and learn with a sensitive, responsive caregiver. Remember, I am your future! One more thing -

100
Thank You!

102
Clean, fed and nurtured? Diarrhoeal Diseases Environmental Enteropathy Nematode infection WASH Child development Time, costs, workload, opportunities Other Diseases

104
Dinner: Bistro Bistro 1727 Connecticut Ave NW, Washington, DC 20009

Similar presentations


 Childhood poverty is a major problem in the US –Over 22% of children in the US live in poverty as compared to 9% in.>")


 Office of Overseas Programming & Training Support (OPATS) Integrating WASH and Nutrition Water, Sanitation, and.>")


