Download presentation
Presentation is loading. Please wait.

1
Stock Valuation RWJ-Chapter 8

2
Valuation of Bonds and Stocks
First Principles: Value of financial securities = PV of expected future cash flows To value bonds and stocks we need to: Estimate future cash flows: Size (how much) and Timing (when) Discount future cash flows at an appropriate rate: The rate should be appropriate to the risk presented by the security.
 and. Timing (when) Discount future cash flows at an appropriate rate: The rate should be appropriate to the risk presented by the security.")
3
Discounted Cash Flow Techniques
Advantages: Since DCF valuation is based on an asset’s fundamentals, it should be less exposed to market moods and perceptions. If you are buying business, rather than stocks, DCF is the right way to think about you are getting when you buy an asset. (Warren Buffet) DCF forces you to think about the underlying characteristics of the firm, and understand its business. Disadvantages: It requires far more explicit inputs and information than other valuation approaches These inputs and information are not only noisy, but also can be manipulated by the analyst to provide the conclusion he/she wants There is no guarantee that anything will emerge as under or over valued.
 DCF forces you to think about the underlying characteristics of the firm, and understand its business. Disadvantages: It requires far more explicit inputs and information than other valuation approaches. These inputs and information are not only noisy, but also can be manipulated by the analyst to provide the conclusion he/she wants. There is no guarantee that anything will emerge as under or over valued.")
4
Discounted Cash Flow Techniques: Dividend Discount Model (DDM)
Under the dividend discount model, the future cash flows for stocks are: Under the DDM, the future cash flows for stocks are Dividends and Selling Price These cash flows are highly uncertain. To find the value of common stocks, we make assumptions about high dividends evolve in the future Two set assumptions: Dividend grow at constant rate (constant dividend growth model) Non-constant dividend growth D0 D1 D2 D3 D4 D5 Dn+ Selling Price
 Non-constant dividend growth. D0. D1. D2. D3. D4. D5. Dn+ Selling Price.")
5
DDM- Constant Dividends Growth Model
Assume that dividends grow at a constant rate (g), per period forever. Given this assumption the price of common stock equals: Do=Dividend that the firm just paid D1=Dividend next period 𝑃 𝑒 = 𝐷 0 (1+𝑔) 𝑟 𝑒 −𝑔 = 𝐷 1 𝑟 𝑒 −𝑔 Required rate of return on equity (CAPM) Dividend Growth Rate
, per period forever. Given this assumption the price of common stock equals: Do=Dividend that the firm just paid. D1=Dividend next period. 𝑃 𝑒 = 𝐷 0 (1+𝑔) 𝑟 𝑒 −𝑔 = 𝐷 1 𝑟 𝑒 −𝑔. Required rate of return on equity. (CAPM) Dividend Growth Rate.")
6
Example-Zero Growth Hampshire Products will pay a dividend of $4 per share a year from now. Analysts expect the dividends to stay the same forever. The required rate of return on the stock is 15%.What is the value of the stock? Since future cash flows are constant, the value of a zero growth stock is the present value of a perpetuity:

7
Constant Growth Assume that dividends will grow at a constant rate, g, forever. i.e. Since future cash flows grow at a constant rate forever, the value of a constant growth stock is the present value of a growing perpetuity: . . .

8
Example- Constant Growth
Assume that Hampshire Products’ dividends are expected to grow at 10% per year forever. What is the value of the stock? Since future cash flows grow at a constant rate forever, the value of a constant growth stock is the present value of a growing perpetuity:

9
Differential Growth Assume that dividends will grow at different rates in the foreseeable future and then will grow at a constant rate thereafter. To value a Differential Growth Stock, we need to: Estimate future dividends in the foreseeable future. Estimate the future stock price when the stock becomes a Constant Growth Stock (case 2). Compute the total present value of the estimated future dividends and future stock price at the appropriate discount rate.
. Compute the total present value of the estimated future dividends and future stock price at the appropriate discount rate.")
10
Example- A Differential Growth
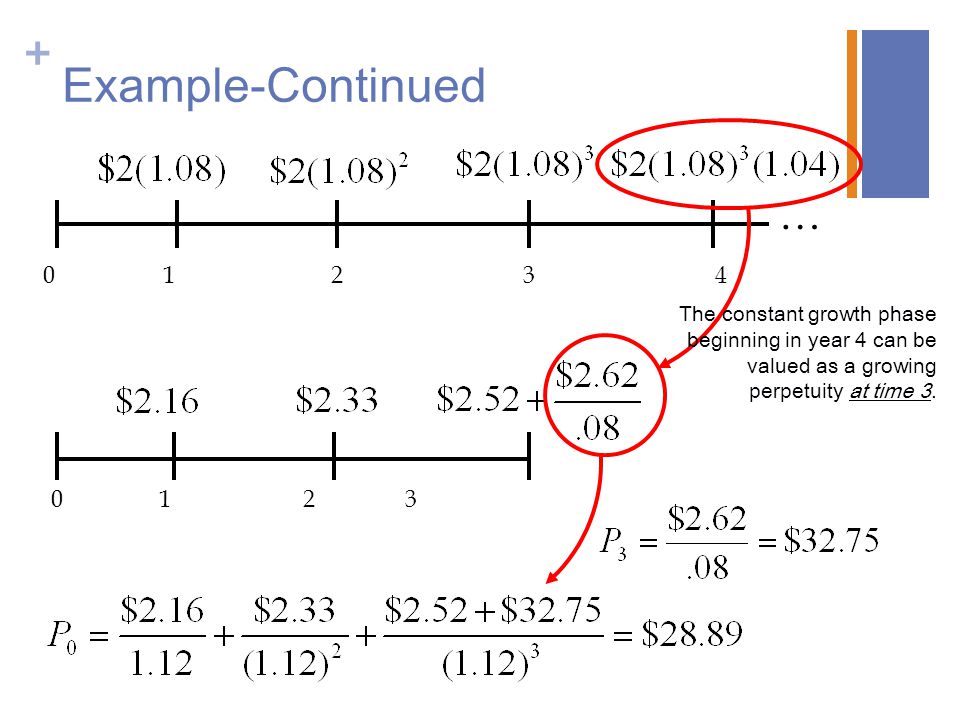
A common stock just paid a dividend of $2. The dividend is expected to grow at 8% for 3 years, then it will grow at 4% in perpetuity. What is the stock worth? The discount rate is 12%.

11
Example-Continued … The constant growth phase beginning in year 4 can be valued as a growing perpetuity at time 3.
12
Question: What is the problem in dividend discount model?
If the dividend discount model is correct, why aren’t no dividend stocks selling at zero? Consider a simple return…. What are the components?

13
Component of Return 𝑅𝑒𝑡𝑢𝑟𝑛= 𝐸𝑛𝑑𝑖𝑛𝑔 𝑃𝑟𝑖𝑐𝑒 𝑜𝑓 𝑎 𝑆ℎ𝑎𝑟𝑒−𝐵𝑒𝑔𝑖𝑛𝑛𝑖𝑛𝑔 𝑃𝑟𝑖𝑐𝑒+𝐶𝑎𝑠ℎ 𝐷𝑖𝑣𝑖𝑑𝑒𝑛𝑑 𝐵𝑒𝑔𝑖𝑛𝑛𝑖𝑛𝑔 𝑃𝑟𝑖𝑐𝑒 OR 𝑅𝑒𝑡𝑢𝑟𝑛= 𝐸𝑛𝑑𝑖𝑛𝑔 𝑃𝑟𝑖𝑐𝑒 𝑜𝑓 𝑎 𝑆ℎ𝑎𝑟𝑒−𝐵𝑒𝑔𝑖𝑛𝑛𝑖𝑛𝑔 𝑃𝑟𝑖𝑐𝑒 𝐵𝑒𝑔𝑖𝑛𝑛𝑖𝑛𝑔 𝑃𝑟𝑖𝑐𝑒 + 𝐶𝑎𝑠ℎ 𝐷𝑖𝑣𝑖𝑑𝑒𝑛𝑑 𝐵𝑒𝑔𝑖𝑛𝑛𝑖𝑛𝑔 𝑃𝑟𝑖𝑐𝑒 Capital Gain Dividend Yield

14
Let’s link what we learn from financial statement analysis and stock valuation
Remember from the financial statement analysis: We have two ways to find cash flows 𝑂𝐹𝐶𝐹=𝐸𝐵𝐼𝑇 1−𝑇𝑎𝑥 +𝐷𝑒𝑝𝑟𝑒𝑐𝑖𝑎𝑡𝑖𝑜𝑛−𝐶𝑎𝑝𝑖𝑡𝑎𝑙 𝐸𝑥𝑝𝑒𝑛𝑑𝑖𝑡𝑢𝑟𝑒 −∆𝑊𝑜𝑟𝑘𝑖𝑛𝑔 𝐶𝑎𝑝𝑖𝑡𝑎𝑙−∆𝑂𝑡ℎ𝑒𝑟 𝐴𝑠𝑠𝑒𝑡𝑠 Current Assets –Current Liabilities OR; 𝐹𝐶𝐹=𝑁𝑒𝑡 𝐼𝑛𝑐𝑜𝑚𝑒+𝐷𝑒𝑝𝑟𝑒𝑐𝑖𝑎𝑡𝑖𝑜𝑛−𝐶𝑎𝑝𝑖𝑡𝑎𝑙 𝐸𝑥𝑝𝑒𝑛𝑑𝑖𝑡𝑢𝑟𝑒 +𝑁𝑒𝑤 𝐷𝑒𝑏𝑡 𝐼𝑠𝑠𝑢𝑒−𝑃𝑟𝑖𝑛𝑐𝑖𝑝𝑎𝑙 𝐷𝑒𝑏𝑡 𝑃𝑎𝑦𝑚𝑒𝑛𝑡𝑠 −∆𝑊𝑜𝑟𝑘𝑖𝑛𝑔 𝐶𝑎𝑝𝑖𝑡𝑎𝑙−∆𝑂𝑡ℎ𝑒𝑟 𝐴𝑠𝑠𝑒𝑡𝑠 Current Assets –Current Liabilities

15
Example Year 0 Year 1 Year 2 Year 3 Year 4 Investments 16,000
The Best Manufacturing Company is considering a new investment. Financial projections for the investment tabulated at the bottom. The corporate tax rate is 34%. Assume all sales revenue is received in cash, all operating costs and income taxes are paid in cash, and all cash flows occur at the end of the year. All net working capital is recovered at the end of the project. Find Incremental Cash Flows Suppose discount rate is 12%. What is the Value of this project? Year 0 Year 1 Year 2 Year 3 Year 4 Investments 16,000 Sales Revenue 8,500 9,000 9,500 7000 Operating Costs 1,900 2,000 2,200 1,700 Depreciation 4,000 Working Capital Spending 200 250 300

16
Example-Valuation of Nike
What is FCF in 2013? How to apply the DCF approach on Nike, Inc.?

17
Relative Valuation Techniques: Multiples
In contrast to various discounted cash flows techniques that attempt to estimate a specific value based on its estimated growth rates and its discount rate, the relative valuation techniques implicitly contend that it is possible to determine the value of an economic entity by comparing its stock price to relevant variable that affect a stock’s value, such as earnings, cash flow, book value and sales

18
Relative Valuation Techniques- Earnings Multiplier Model
Price to earnings ratio measure how many dollars investors are willing to pay for a dollar of expected earnings: 𝐸𝑀= 𝑃 𝑡 𝐸𝑃𝑆 𝑡+1 Assume the firm is mature and maintains a constant dividend growth, then we can use the dividend discounted model (DDM) to find the stock price 𝑃 𝐸𝑃𝑆 = 𝐷 1 (𝑘−𝑔) 𝐸𝑃𝑆 1 = 𝐷 1 𝐸𝑃𝑆 1 (𝑘−𝑔) = 𝐷𝑖𝑣𝑖𝑑𝑒𝑛𝑑 𝑃𝑎𝑦𝑜𝑢𝑡 𝑅𝑎𝑡𝑖𝑜 (𝑘−𝑔)
 to find the stock price. 𝑃 𝐸𝑃𝑆 = 𝐷 1 (𝑘−𝑔) 𝐸𝑃𝑆 1 = 𝐷 1 𝐸𝑃𝑆 1 (𝑘−𝑔) = 𝐷𝑖𝑣𝑖𝑑𝑒𝑛𝑑 𝑃𝑎𝑦𝑜𝑢𝑡 𝑅𝑎𝑡𝑖𝑜 (𝑘−𝑔)")
19
Example If stock has an expected dividend payout ratio of 50%, a required rate of return of 12%, and expected growth rate for dividends of 8%, what is the stock’s P/E ratio?

20
Relative Valuation Techniques: The Price to Cash Flow Ratio
Price to cash flow ratio is introduced due to the concern that some firms may manipulate and generate misleading P/E ratio. Comparing to earnings, cash flow values are generally less prone to manipulation. 𝑃𝐶𝐹 𝑅𝑎𝑡𝑖𝑜= 𝑃 𝑡 𝐶𝐹 𝑡+1

21
Relative Valuation Techniques: Price to Book Value Ratio
Fama and French (1992) find a significant inverse relation between price to book ratios and excess returns of stocks. Based on their findings, the price to book ratio gained popularity and credibility as a relative valuation technique for all types of firms 𝑃𝐵 𝑟𝑎𝑡𝑖𝑜= 𝑃 𝑡 𝐵𝑉 𝑡+1 (1) =Total Assets/ # Shares (2) =Share holders’ Equity/ # Shares
 find a significant inverse relation between price to book ratios and excess returns of stocks. Based on their findings, the price to book ratio gained popularity and credibility as a relative valuation technique for all types of firms. 𝑃𝐵 𝑟𝑎𝑡𝑖𝑜= 𝑃 𝑡 𝐵𝑉 𝑡+1. (1) =Total Assets/ # Shares. (2) =Share holders’ Equity/ # Shares.")
22
Relative Valuation Techniques: Price to Sales Ratio
The advocates of the price/sales ratio believe the ratio is useful for two reasons: (1)strong and consistent sales growth is a requirement for a growth company (2) Sales information is subject to less manipulation than any other data item. 𝑃𝑆 𝑅𝑎𝑡𝑖𝑜= 𝑃 𝑡 𝑆 𝑡+1 Be careful: Profitability ratios vary dramatically across industries
strong and consistent sales growth is a requirement for a growth company. (2) Sales information is subject to less manipulation than any other data item. 𝑃𝑆 𝑅𝑎𝑡𝑖𝑜= 𝑃 𝑡 𝑆 𝑡+1. Be careful: Profitability ratios vary dramatically across industries.")
23
Applying the relative valuation techniques: Example
Let’s suppose Wal-Mart’s current stock price is $47.50/share. Expected Earnings for Wal-Mart is $2.62/share. What is the earnings multiplier for Wal-Mart? How could we know if earnings multiplier is too high or too low?

24
Applying Earnings Multipliers
(1) Historical Multipliers: If historically, the price for Wal-Mart 7x to 12x earnings, an analyst would have to justify the price being so high relative to Wal-Mart’s current or expected earnings. It may be that the price cannot justified and therefore the stock is overvalued (2) Industry Comparison: In addition to average P/E ratio for the stock’s industry can be used as a comparison. If the “discount merchandise” industry as a whole has a current P/E of 10x earnings, again, there would be concern as to whether Wal-Mart’s P/E of 18 is justified It might be that industry leader is more valuable than its peers, and may be that it is priced higher (3) Market Comparison: Finally, the historical relationship between P/E and Wall-Mart’s P/E can be analyzed If Wal-Mart has always had a higher P/E than the overall market, and if this is the currently the case, then the analyst needs to decide whether this is still the case and will continue into foreseeable future
 Historical Multipliers: If historically, the price for Wal-Mart 7x to 12x earnings, an analyst would have to justify the price being so high relative to Wal-Mart’s current or expected earnings. It may be that the price cannot justified and therefore the stock is overvalued. (2) Industry Comparison: In addition to average P/E ratio for the stock’s industry can be used as a comparison. If the discount merchandise industry as a whole has a current P/E of 10x earnings, again, there would be concern as to whether Wal-Mart’s P/E of 18 is justified. It might be that industry leader is more valuable than its peers, and may be that it is priced higher. (3) Market Comparison: Finally, the historical relationship between P/E and Wall-Mart’s P/E can be analyzed. If Wal-Mart has always had a higher P/E than the overall market, and if this is the currently the case, then the analyst needs to decide whether this is still the case and will continue into foreseeable future.")
Similar presentations


>")


>")


