Download presentation
Presentation is loading. Please wait.

1
How to Visualize in OpendTect Layers and Transparency, Volume Rendering & Iso surfaces
Geert de Bruin

2
Introduction OpendTect is a powerful tool for attribute analysis and advanced object detection Visualizing the results is almost as important as the results themselves, therefore OpendTect has several advanced visualization options This presentation helps you to get best out of OpendTect: layers, transparency, color-bars, volume rendering and iso surfaces

3
Overview Working with attribute layers and transparency
Visualizing data in 3D: Volume rendering Iso-surfaces (prototype)
")
4
Working with attribute layers
Layer 2: Attribute In OpendTect one element (inline, crossline, time-slice, horizon, random-line) can have multiple attribute displays or layers The attribute on layer 2 is masking the seismic data on layer 1. Therefore we make the second layer (partially) transparent Layer 1: Seismic data Uniform transparency Part transparent / part opaque
 can have multiple attribute displays or layers. The attribute on layer 2 is masking the seismic data on layer 1. Therefore we make the second layer (partially) transparent. Layer 1: Seismic data. Uniform transparency. Part transparent / part opaque.")
5
Part transparent / part opaque
The concept is to make a certain value-domain completely transparent (low attribute values), while keeping the other values opaque (high attribute values).
, while keeping the other values opaque (high attribute values).")
6
Workflow in OpendTect Display seismic data
Right click on the element and select “add attribute”

7
Workflow in OpendTect Display seismic data
Right click on the element and select “add attribute” Display an attribute on the new layer Select the layer and choose the color-bar “chimney” Tip: Shift + Arrow Up/Down To changes the order

8
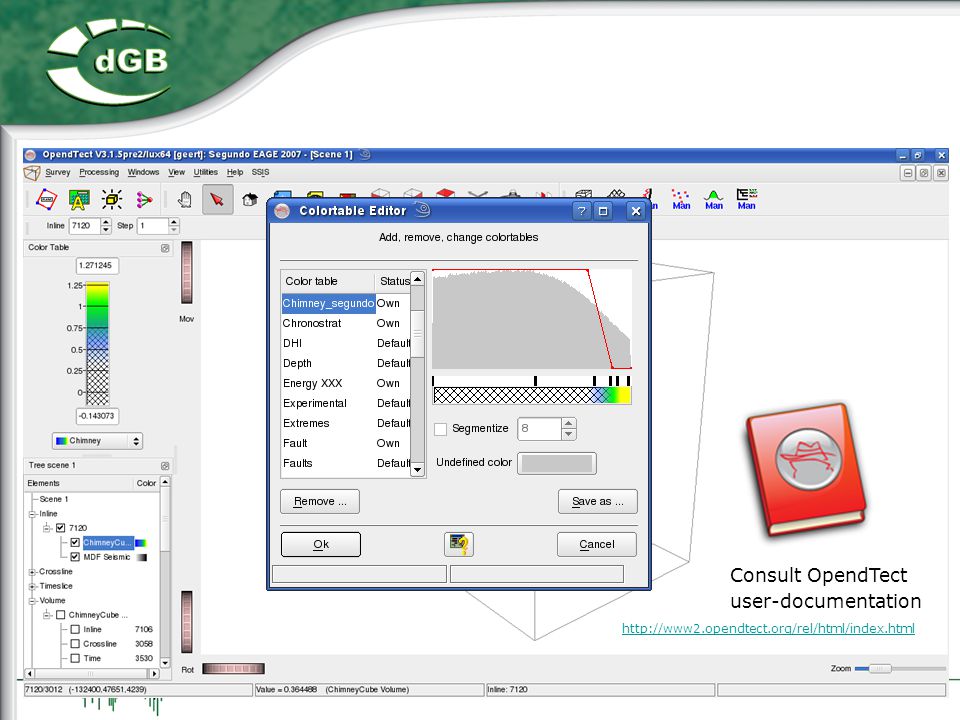
Workflow in OpendTect Right click on the color-bar to flip or edit it

9
Consult OpendTect user-documentation
10
Uniform transparency Uniform transparency is equally simple to perform

11
Uniform transparency Layer 1 Seismic Data

12
Uniform transparency Layer 2 Acoustic impedance Layer 1 Seismic Data

13
Uniform transparency

14
Uniform transparency

15
Overview Working with attribute layers and transparency
Visualizing data in 3D: Volume rendering Iso-surfaces (prototype)
")
16
Visualizing data in 3D: Volume rendering
Display an attribute in a volume viewer. Make a certain value-domain completely transparent (low attribute values), while keeping the other values opaque (high attribute values).
, while keeping the other values opaque (high attribute values).")
17
Volume rendering Add a volume and position it

18
Add a volume and position it
Load the attribute Deselect “inline crossline and time” & select “volren”

19
Add a volume and position it
Load the attribute Deselect “inline crossline and time” & select “volren” Choose a color-bar with transparency (Chimney)
")
20
Overview Working with attribute layers and transparency
Visualizing data in 3D: Volume rendering Iso-surfaces (prototype)
")
21
Add a volume and load the attribute data
Right click in the volume item in the tree and select Add> Iso surface Iso surface

22
The color of the isosurface corresponds to the color in the color bar at the value of the isosurface (ignoring transparency)
")
23
Changing the iso value will thus result in a different color and shape

24
Iso surface: ChimneyCube

Similar presentations


