Download presentation
Presentation is loading. Please wait.

1
Vertical Alignment CE 5720 Spring 2011 Originally Created by Chris McCahill

2
Components of The Alignment Horizontal Alignment Vertical Alignment Cross-section

5
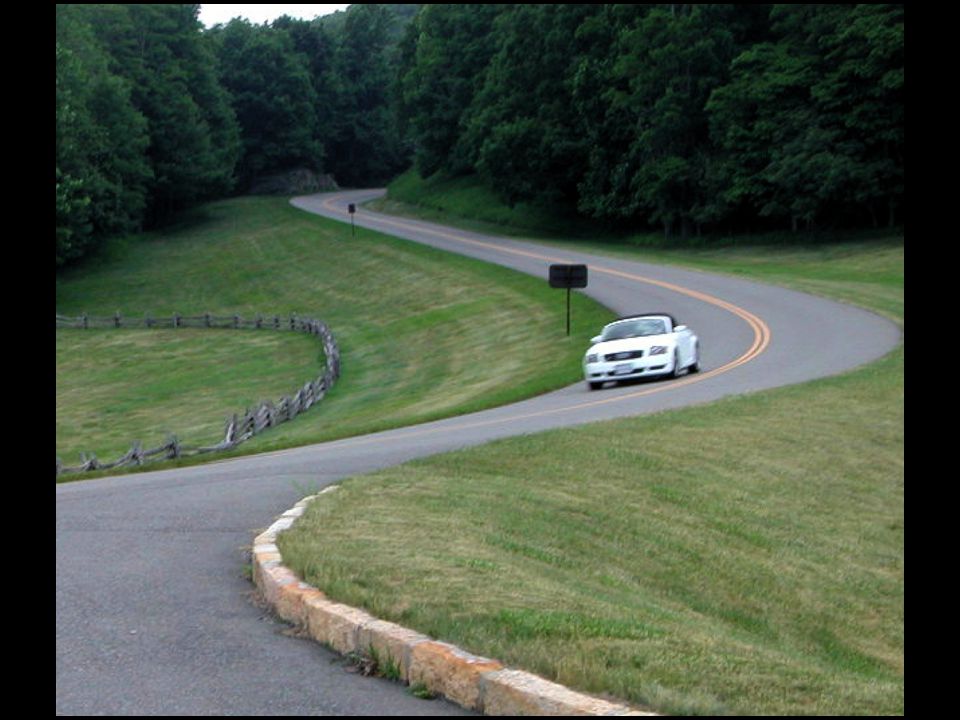
Vertical Alignment & Topography Texas DOT

6
Today’s Class Maximum/minimum grade Properties of vertical curves (parabolic) Technical design of vertical curves
 Technical design of vertical curves")
7
Crest Curve Sag Curve G1G1 G2G2 G3G3 Vertical Alignment Tangents and Curves Like the horizontal alignment, the vertical alignment is made up of tangent and curves In this case the curve is a parabolic curve rather than a circular or spiral curve

8
Maximum Grade Harlech, Gwynedd, UK (G = 34%) www.geograph.org.uk
")
9
Maximum Grade www.nebraskaweatherphotos.org

10
Maximum Grade Dee747 at picasaweb.google.com

11
Maximum and Minimum Grade One important design consideration is the determination of the maximum and minimum grade that can be allowed on the tangent section The minimum grade used is typically 0.5% The maximum grade is generally a function of the Design Speed Terrain (Level, Rolling, Mountainous) On high speed facilities such as freeways the maximum grade is generally kept to 5% where the terrain allows (3% is desirable since anything larger starts to affect the operations of trucks) At 30 mph design speed the acceptable maximum is in the range of 7 to 12 %
 On high speed facilities such as freeways the maximum grade is generally kept to 5% where the terrain allows (3% is desirable since anything larger starts to affect the operations of trucks) At 30 mph design speed the acceptable maximum is in the range of 7 to 12 %")
12
Properties of Vertical Curves BVC EVC L G2G2 G1G1 Change in grade: A = G 2 - G 1 where G is expressed as % (positive /, negative \) For a crest curve, A is negative For a sag curve, A is positive L/2 PI
 For a crest curve, A is negative For a sag curve, A is positive L/2 PI")
13
Properties of Vertical Curves BVC EVC L G2G2 G1G1 Rate of change of curvature: K = L / |A| Which is a gentler curve - small K or large K? L/2 PI

14
Properties of Vertical Curves BVC EVC L G2G2 G1G1 L/2 Rate of change of grade: r = (g 2 - g 1 ) / L where, g is expressed as a ratio (positive /, negative \) L is expressed in feet or meters Note – K and r are both measuring the same characteristic of the curve but in different ways PI
 / L where, g is expressed as a ratio (positive /, negative \) L is expressed in feet or meters Note – K and r are both measuring the same characteristic of the curve but in different ways PI")
15
Properties of Vertical Curves BVC EVC PI L G2G2 G1G1 Equation for determining the elevation at any point on the curve y = y 0 + g 1 x + 1/2 rx 2 where, y 0 = elevation at the BVC g = grade expressed as a ratio x = horizontal distance from BVC r = rate of change of grade expressed as ratio Elevation = y

16
Properties of Vertical Curves Distance BVC to the turning point (high/low point on curve) x t = -(g 1 /r) This can be derived as follows y = y 0 + g 1 x + 1/2 rx 2 dy/dx = g 1 + rx At the turning point, dy/dx = 0 0 = g 1 + rx t Therefore, x t = -(g 1 /r)
 x t = -(g 1 /r) This can be derived as follows y = y 0 + g 1 x + 1/2 rx 2 dy/dx = g 1 + rx At the turning point, dy/dx = 0 0 = g 1 + rx t Therefore, x t = -(g 1 /r)")
17
Properties of Vertical Curves BVC EVC PI G2G2 G1G1 Example: G 1 = -1% G 2 = +2% Elevation of PI = 125.00 m Station of EVC = 25+00 Station of PI = 24+00 Length of curve? L/2 = Sta. EVC – Sta. PI L/2 = 2500 m - 2400 m = 100 m L = 200 m

18
Properties of Vertical Curves BVC EVC PI G2G2 G1G1 Example: G 1 = -1% G 2 = +2% Elevation of PI = 125.00 m Station of EVC = 25+00 Station of PI = 24+00 r - value? r = (g 2 - g 1 )/L r = (0.02 - [-0.01])/200 m r = 0.00015 / meter
/L r = ( [-0.01])/200 m r = / meter.")
19
Properties of Vertical Curves BVC EVC PI G2G2 G1G1 Example: G 1 = -1% G 2 = +2% Elevation of PI = 125.00 m Station of EVC = 25+00 Station of PI = 24+00 Station of low point? x = -(g 1 /r) x = -([-0.01] / [0.00015/m]) x = 66.67 m Station = [23+00] + 67.67 m Station 23+67
 x = -([-0.01] / [ /m]) x = m Station = [23+00] m Station")
20
Properties of Vertical Curves BVC EVC PI G2G2 G1G1 Example: G 1 = -1% G 2 = +2% Elevation of PI = 125.00 m Station of EVC = 25+00 Station of PI = 24+00 Elevation at low point? y = y 0 + g 1 x + 1/2 rx 2 y 0 = Elev. BVC Elev. BVC = Elev. PI - g 1 L/2 Elev. BVC = 125 m - [-0.01][100 m] Elev. BVC = 126 m

21
Properties of Vertical Curves BVC EVC PI G2G2 G1G1 Example: G 1 = -1% G 2 = +2% Elevation of PI = 125.00 m Station of EVC = 25+00 Station of PI = 24+00 Elevation at low point? y = y 0 + g 1 x + 1/2 rx 2 y = 126 m + [-0.01][66.67 m] + 1/2 [0.00015/m][66.67 m] 2 y = 125.67 m

22
Properties of Vertical Curves BVC EVC PI G2G2 G1G1 Example: G 1 = -1% G 2 = +2% Elevation of PI = 125.00 m Station of EVC = 25+00 Station of PI = 24+00 Elevation at station 23+50? y = 126 m + [-0.01][50 m] + 1/2 [0.00015/m][50 m] 2 y = 125.69 m Elevation at station 24+50? y = 126 m + [-0.01][150 m] + 1/2 [0.00015/m][150 m] 2 y = 126.19 m

23
Design of Vertical Curves

24
The first step in the design is to determine the minimum length (or minimum K) for a given design speed. Factors affecting the minimum length include –Sufficient sight distance –Driver comfort –Appearance

25
Design of Vertical Curves Crest Vertical Curve If sight distance requirements are satisfied then safety, comfort, and appearance requirements are also satisfied. h 1 = height of driver’s eyes, in fth 2 = height of object, in ft

26
Design of Vertical Curves Crest Vertical Curve Equation relating sight distance to minimum length From AASHTO: h 1 ≈ 3.5 ft h 2 ≈ 0.5 ft (stopping sight distance) h 3 ≈ 4.25 ft (passing sight distance)
 h 3 ≈ 4.25 ft (passing sight distance)")
27
Design of Vertical Curves Sag Vertical Curve Stopping sight distance not an issue for sag vertical curves Instead the design controls are one of the following –Headlight sight distance –Rider comfort –Drainage –Appearance

28
Sag Vertical Curve Check also: Comfort –Change in grade, A –Design Speed Appearance –Change in grade, A Design of Vertical Curves

Similar presentations


>")


.>")


>")

 You learned how to lay out a vertical curve, given grades, PVC, PVI, and PVT in CE113 Surveying.>")


