Download presentation
Presentation is loading. Please wait.

1
Hierarchical Clustering Leopoldo Infante Pontificia Universidad Católica de Chile Reunión Latinoamericana de Astronomía Córdoba, septiembre 2001

2
Introduction The Two-point Correlation Function Clustering of Galaxies at Low Redshifts - SDSS results- Evolution of Clustering - CNOC2 results- Clustering of Small Groups of Galaxies The r o - d diagram

3
Rich Clusters Groups Galaxies

4
How do we characterize clustering? Correlation Functions and/or Power Spectrum

5
Random Distribution 1-Point 2-Point N-Point Clustered Distribution 2-Point r dV 1 dV 2

6
Continuous Distribution Fourier Transform Since P depends only on k

7
2-Dimensions - Angles Estimators In Practice A B

8
The co-moving Correlation Length

9
Proper Correlation length Proper Correlation distance Clustering evolution index Assumed Power Law 3-D Correlation Function Assumed Power Law Angular Correlation Function

10
Proper Correlation Length

11
Inter-system Separation, d Mean separation of objects Space density of galaxy systems As richer systems are rarer, d scales with richness or mass of the system

12
CLUSTERING Measurements from Galaxy Catalogs and Predictions from Simulations

15
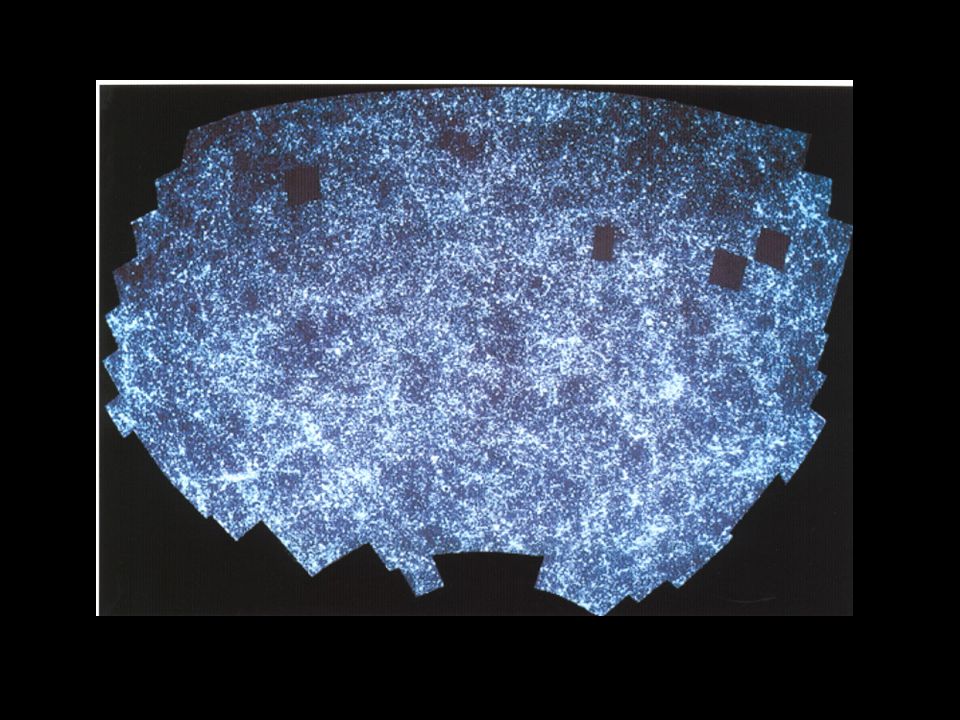
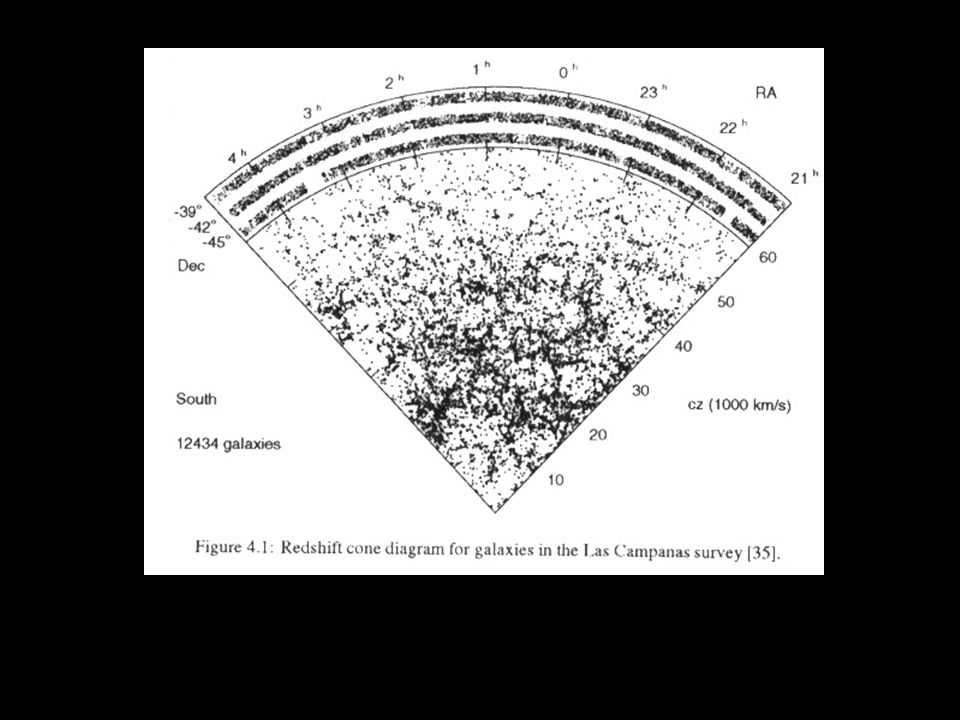
2-dF Catalog, 16.419 galaxies, south strip.

17
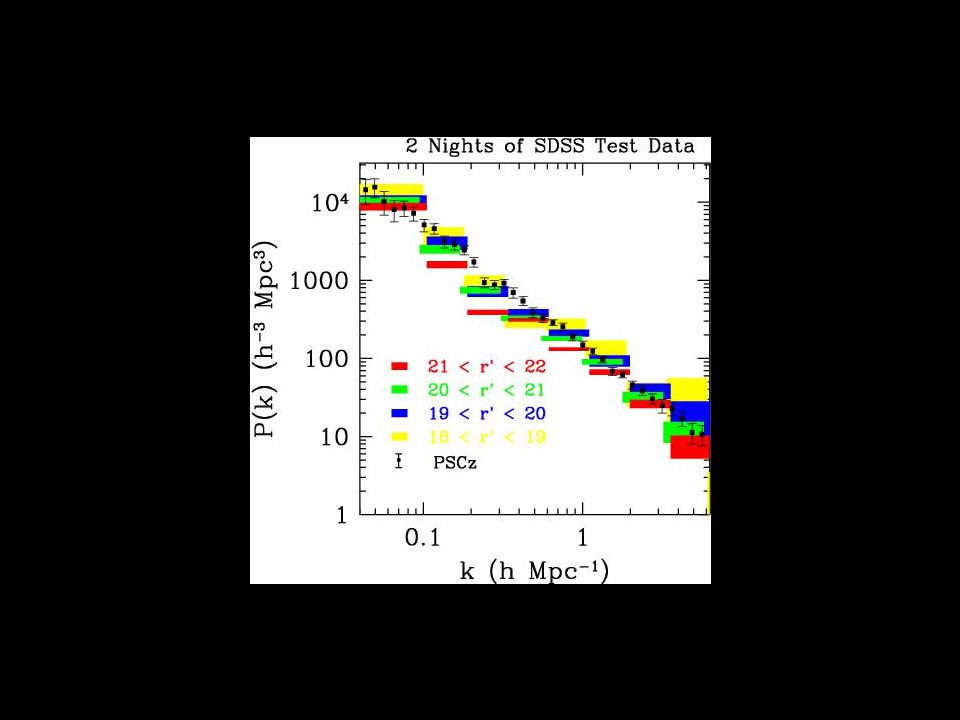
Sloan Digital Sky Survey 2.5m Telescope Two Surveys Photometric Spectroscopic Expect 1 million galaxies with spectra 10 8 galaxies with 5 colors Current results íTwo nights í Equatorial strip, 225 deg. 2 í2.5 million galaxies

18
Mock Catalogs

19
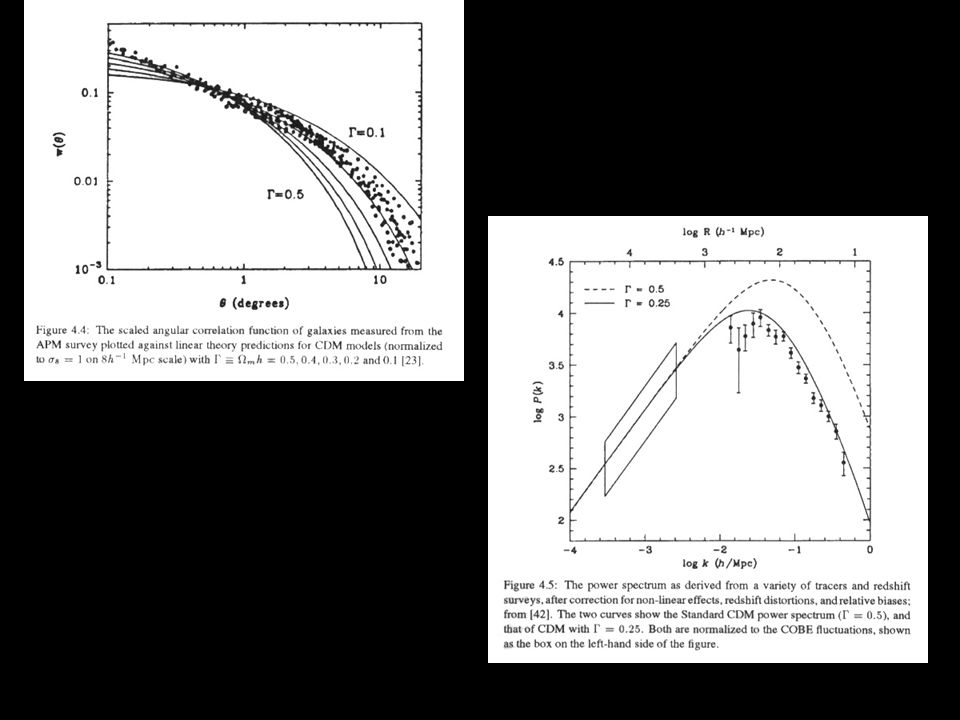
Correlations on a given angular scale probe physical scales of all sizes. Fainter galaxies are on average further away, so probe larger physical scales Angular Clustering

20
4Power law over 2 orders of magnitude 4Correlation in faintest bin correspond to larger physical scales less clustered

22
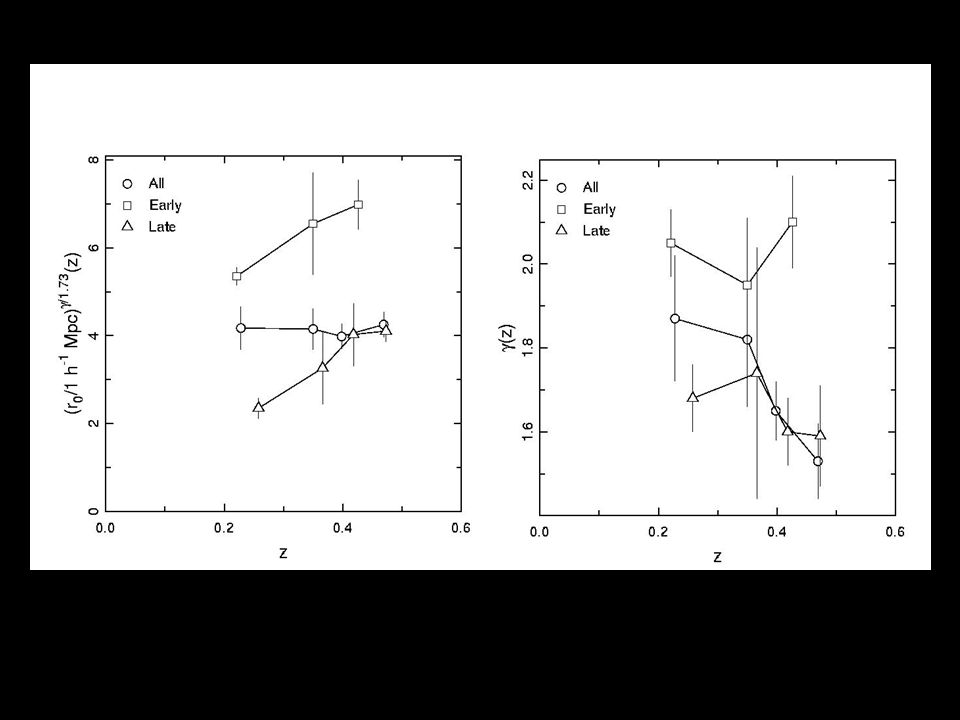
CNOC2 Survey Measures clustering evolution up to z 0.6 for Late and Early type galaxies. 1.55 deg. 2 ~ 3000 galaxies 0.1 < z < 0.6 Redshifts for objects with R c < 21.5 R c band, M R < -20 r p <10h -1 Mpc SEDs are determined from UBVR c I c photometry

23
Projected Correlation Length

25
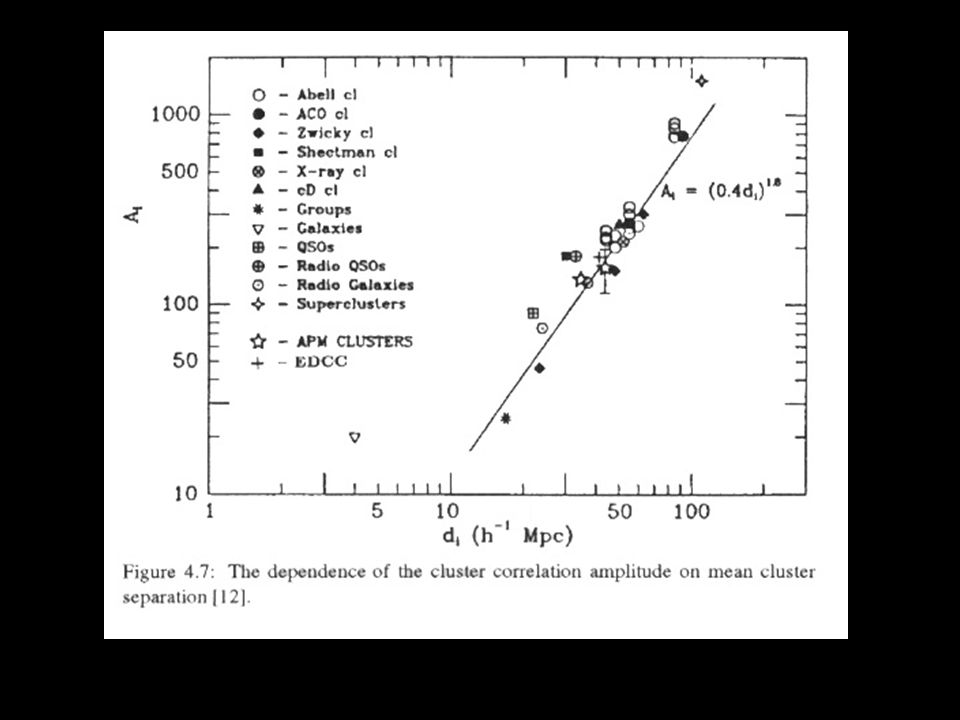
Clustering of Galaxy Clusters Richer clusters are more strongly clustered. Bahcall & Cen, 92, Bahcall & West, 92 r o =0.4 d c =0.4 n c -1/3 However this has been d isputed Incompleteness in cluster samples (Abell, etc.) APM cluster sample show weaker trend
 APM cluster sample show weaker trend.")
27
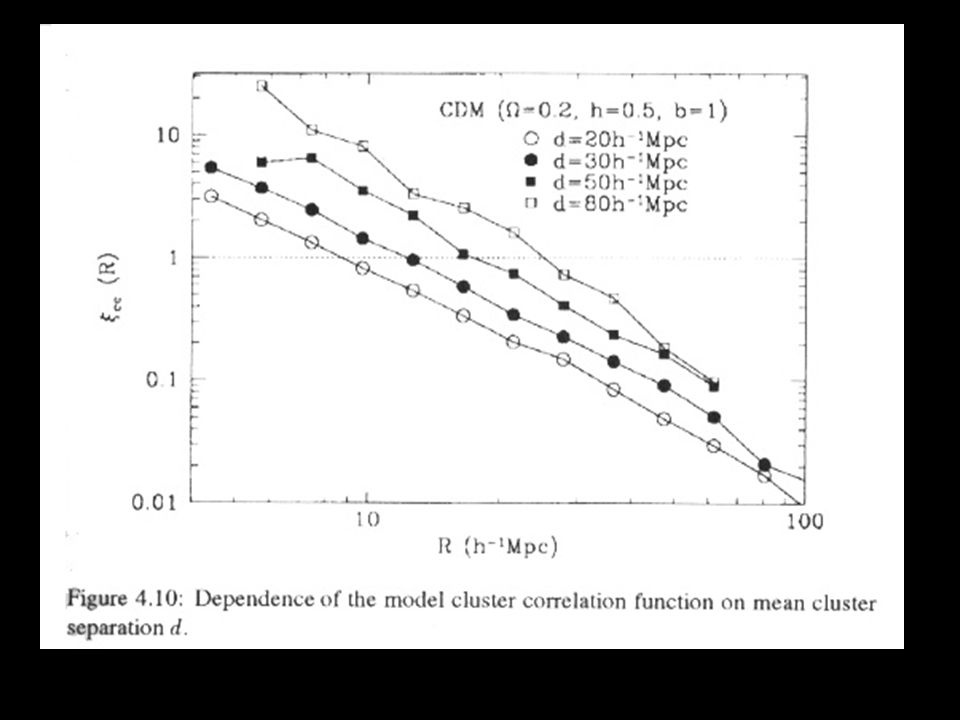
N body simulations Bahcall & Cen, ‘92, r o d c Croft & Efstathiou, ‘94, r o d c but weaker Colberg et al., ‘00, (The Virgo Consortium) –10 9 particles –Cubes of 2h -1 Gpc ( CDM) 3h -1 Gpc ( CDM) CDM =1.0 =0.0 h=0.5 =0.21 8 =0.6 CDM =0.3 =0.7 h=0.5 =0.17 8 =0.9
 –10 9 particles –Cubes of 2h -1 Gpc ( CDM) 3h -1 Gpc ( CDM) CDM =1.0 =0.0 h=0.5 =0.21 8 =0.6 CDM =0.3 =0.7 h=0.5 =0.17 8 =0.9")
30
CDM d c = 40, 70, 100, 130 h -1 Mpc Dark matter

32
Clustering and Evolution of Small Groups of Galaxies

33
Objective: Understand formation and evolution of structures in the universe, from individual galaxies, to galaxies in groups to clusters of galaxies. Main data: SDSS, equatorial strip, RCS, etc. Secondary data: Spectroscopy to get redshifts. Expected results: dN/dz as a function of z, occupation numbers (HOD) and mass. Derive r o and d=n -1/3 Clustering Properties
 and mass. Derive r o and d=n -1/3 Clustering Properties.")
34
Bias The galaxy distribution is a bias tracer of the matter distribution. –Galaxy formation only in the highest peaks of density fluctuations. –However, matter clusters continuously. In order to test structure formation models we must understand this bias.

35
Halo Occupation Distribution, HOD Bias, the relation between matter and galaxy distribution, for a specific type of galaxy, is defined by: The probability, P(N/M), that a halo of virial mass M contains N galaxies. The relation between the halo and galaxy spatial distribution. The relation between the dark matter and galaxy velocity distribution. This provides a knowledge of the relation between galaxies and the overall distribution of matter, the Halo Occupation Distribution.

36
In practice, how do we measure HOD? 4Detect pairs, triplets, quadruplets etc. n 2 in SDSS catalog. 4Measure redshifts of a selected sample. 4With z and N we obtain dN/dz We are carrying out a project to find galaxies in small groups using SDSS data.

37
Collaborators: M. Strauss N. Bahcall J. Knapp M. Vogeley R. Kim R. Lupton & Sloan consortium

38
The Data Equatorial strip, 2.5 100 deg2 Seeing 1.2” to 2” Area = 278.13 deg 2 Mags. 18 < r * < 20 N galaxies = 330,041 Note strips

39
dlogN/dm=0.46 Turnover at r * 20.8 De-reddened Galaxy Counts Thin lines are counts on each of the 12 scanlines

40
Selection of Galaxy Systems 4Find all galaxies within angular separation 2”< <15” (~37h -1 kpc) and 18 < r * < 20 4Merge all groups which have members in common. 4Define a radius group: R G 4Define distance from the group o the next galaxy; R N 4Isolation criterion: R G /R N 3 Sample 1175 groups with more than 3 members 15,492 pairs Mean redshift = 0.22 0.1

41
Galaxy pairs, examples Image imspection shows that less than 3% are spurious detections

42
Galaxy groups, examples

43
Main Results A = 13.54 0.07 = 1.76 A = 4.94 0.02 = 1.77 arcsec

44
galaxies pairs triplets Secondary Results Triplets are more clustered than pairs Hint of an excess at small angular scales

45
Space Clustering Properties -Limber’s Inversion- –Calculate correlation amplitudes from ( ) –Measure redshift distributions, dN/dz –De-project ( ) to obtain r o, correlation lengths –Compare r o systems with different HODs CNOC2 SDSS
 –Measure redshift distributions, dN/dz –De-project ( ) to obtain r o, correlation lengths –Compare r o systems with different HODs CNOC2 SDSS")
46
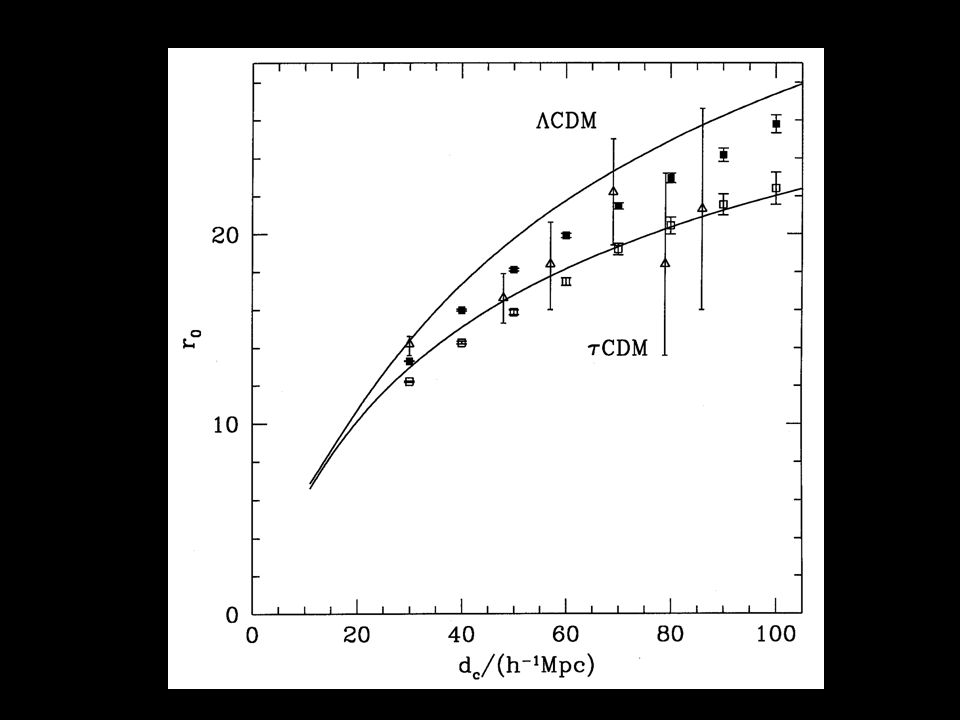
The r o - d relation Correlation scale Amplitude of the correlation function Mean separation As richer systems are rarer, d scales with richness or mass of the system

47
Rich Abell Clusters: Bahcall & Soneira 1983 Peacock & West 1992 Postman et al. 1992 Lee &Park 2000 APM Clusters: Croft et al. 1997 Lee & Park 2000 EDCC Clusters: Nichol et al. 1992 X-ray Clusters: Bohringer et al. 2001 Abadi et al. 1998 Lee & Park 2000 Groups of Galaxies: Merchan et al. 2000 Girardi et al. 2000 LCDM ( m =0.3, L =0.7, h=0.7) SCDM ( m = 1, L =0, h=0.5) Governato et al. 2000 Colberg et al. 2000 Bahcall et al. 2001
 SCDM ( m = 1, L =0, h=0.5) Governato et al Colberg et al Bahcall et al")
48
CONCLUSIONS We use a sample of 330,041 galaxies within 278 deg 2, with magnitudes 18 < r * < 20, from SDSS commissioning imaging data. We select isolated small groups. We determine the angular correlation function. We find the following: Pairs and triplets are ~ 3 times more strongly clustered than galaxies. Logarithmic slopes are = 1.77 ± 0.04 (galaxies and pairs) ( ) is measured up to 1 deg. scales, ~ 9 h -1 Mpc at =0.22. No breaks. We find r o = 4.2 ± 0.4 h -1 Mpc for galaxies and 7.8 ± 0.7 h -1 Mpc for pairs We find d = 3.7 and 10.2 h -1 Mpc for galaxies and pairs respectively. LCDM provides a considerable better match to the data Follow-up studies dN/dz and photometric redshifts. Select groups over > 1000 deg 2 area from SDSS
 ( ) is measured up to 1 deg. scales, ~ 9 h -1 Mpc at =0.22. No breaks. We find r o = 4.2 ± 0.4 h -1 Mpc for galaxies and 7.8 ± 0.7 h -1 Mpc for pairs We find d = 3.7 and 10.2 h -1 Mpc for galaxies and pairs respectively. LCDM provides a considerable better match to the data Follow-up studies dN/dz and photometric redshifts. Select groups over > 1000 deg 2 area from SDSS.")
Similar presentations


 Frank Briggs (ANU) Matthew Colless (AAO) Roberto De Propris (CTIO)>")
 Steve Wilkins (Cambridge) Imperial College.>")


>")


.>")

