Download presentation
Presentation is loading. Please wait.

2
HCV Disease Pathway Acute infection Spontaneous cure Chronic Hepatitis Cirrhosis Hepatocellular carcinoma 20-30% 70-80% 1- 4%/annum 20-100%!!! ??

3
Modelled prevalent number of HCV infected IDUs in Scotland according to stage of HCV disease, 1960-2030 1960198020002020 0 10 20 30 40 50 60 Living IDUs (thousands) 2008 Calendar year Mild disease Moderate disease Cirrhosis Recovered from HCV Cleared HCV from treatment Hutchinson et al. Hepatology 2005

5
Compensated cirrhosis Cirrhosis prevented from antiviral therapy* Living IDUs with cirrhosis 201020202030 0 1,000 2,000 3,000 201020202030 0 1,000 2,000 3,000 201020202030 0 1,000 2,000 3,000 Decompensated cirrhosis HCC Uptake of therapy by 225 IDUs per year Uptake of therapy by 1,000 IDUs per year Uptake of therapy by (up to) 2,000 IDUs per year Modelled number of IDUs with cirrhosis in Scotland by different uptake rates of HCV antiviral therapy, 2008-2030 * Excludes those prevented from antiviral therapy prior to 2008 Hutchinson, SJ. et al 2008 J Hepatol. 48 (Suppl 2):S297
:S297.")
6
In Scotland, 2002-2012: (a) the number of chronic HCV persons commencing a course of therapy each year, and (b) the cumulative number of patients attaining SVR Key points: 1052 patients treated in 2012/13 (marginally below the national target of 1,150) In the last three years, more than 1,000 patients per year commencing treatment in Scotland The number of persons known to have attained a SVR, now exceeds 3000 UPTAKE OF TREATMENT 0 1000 2000 3000 4000 200 400 600 800 1000 Number treated. 20022003200420052006200720082009201020112012 No persons commencing treatment Cumulative number of known SVR Cumulative SVR McDonald et al. J Viral Hep; in press

7
(1a) ATTENDANCE AT SPECIALIST SERVICES (1b) UPTAKE OF TREATMENT Proportion commencing treatment within 12 months of attendance, by calendar period, in Scotland. 0 10 20 30 40 50 96-98 99-0102-0405-07 08-09 0 10 20 30 40 50 96-98 02-0405-0708-09 99-01 Pre phase II % Attended % Treated Phase II PERIOD OF DIAGNOSISPERIOD OF ATTENDANCE McDonald et al. J Viral Hep; in press

8
0 50 100 150 98 000204060810 Number of deaths Year Death 0 50 100 150 98 0002 04 060810 Year Admission Number of admissions (I) LIVER DEATHS(II) FIRST-TIME ADMISSION FOR LIVER FAILURE (4) IMPACT OF SVR McDonald et al. J Viral Hep; in press

9
Estimated uptake of HCV antiviral therapy, by selected country Estimated number living with chronic HCV (N) Annual number initiated on HCV therapy (Rx) Annual treatment uptake (Rx/N) Scotland (2012)38,0001,0522.8% France (2000-2005) 1 ~500,000~13,500~2.7% USA (2008-2012) 2 ~3,200,00065,000~2.6% Australia (2006) 3 202,4002900~1.4% 1 Lettmeier et al. J Hepatol. 2008;49(4)528-36 2 Volk et al. Hepatology. 2009; 50:1750-1755 3 Gidding et al. J Gastroenterol Hepatol. 2009; 24(10)1648-54
 Volk et al. Hepatology. 2009; 50: Gidding et al. J Gastroenterol Hepatol. 2009; 24(10)")
10
Excess risk of a liver and an alcohol related hospital episode post treatment (in SVR & non-SVR patients) AND post diagnosis (in spontaneously resolved patients), compared to the general population Innes et al. Hepatology, 2011. * Age, sex & year standardised 0.5 1.0 5.0 10.0 50.0 Excess risk* Liver Alcohol Non-SVR (N=638) SVR (N=560) Non-cirrhotic SVR (N=503) Spontaneous resolved (N=3,690) 53.2 10.5 5.9 26.8 4.5 2.0 1.3 7.4
 SVR (N=560) Non-cirrhotic SVR (N=503) Spontaneous resolved (N=3,690)")
11
HCV treatment the state of the art Feb 2014 Interferon Based Tailored to Genotype Duration 24-48 weeks Scotland Genotype 1&3 SVR G1 70%, G3 75%

12
*This regimen has only been tested in patients who have failed previous therapy who were late respondersBoceprevir EU SmPC Non-cirrhotic treatment-naïve with detectable HCV RNA at Week 8 but undetectable at Week 24* Non-cirrhotic relapsers and partial responders 0 4828 48 24 361228 Null responders Patients with cirrhosis Weeks PR lead-in BOC + PR* BOC + PR PR STOP BOC + PR Treatment-naïve without cirrhosis who achieve undetectable HCV RNA at Weeks 8 and 24 HCV RNA If ≥100 IU/mL discontinue all drugs If detectable discontinue all drugs Boceprevir dose must not be reduced or restarted once stopped

13
If >1000 IU/mL at Week 4 or 12: discontinue all drugs If detectable at Week 24 or 36: discontinue PR 2404812364 Weeks STOP PR Telaprevir + PR PR Non-cirrhotic naïves and relapsers achieving undetectable HCV RNA at Week 4 and 12 (eRVR) Non-cirrhotic naïves and relapsers without eRVR Partial and null responders Patients with cirrhosis HCV RNA Telaprevir dose must not be reduced or restarted once stopped
 Non-cirrhotic naïves and relapsers without eRVR Partial and null responders Patients with cirrhosis HCV RNA Telaprevir dose must not be reduced or restarted once stopped")
14
BOC RGT 233/368 BOC44/PR48 242/366 PR48 137/363 n/N = Adapted from Poordad F, et al. N Engl J Med 2011;364:1195–206 *p<0.001 for both boceprevir arms versus PR48 * *

15
T12PR 659/903 PR48 158/361 n/N = 72–75* Sherman KE, et al. Hepatology 2010;52(Suppl.):401A Jacobson IM, et al. N Engl J Med 2011;364:2405-16; Sherman KE, et al. CROI 2011. Abstract 957 *p<0.001 vs PR48 in ADVANCE (75% versus 44%)
:401A Jacobson IM, et al. N Engl J Med 2011;364: ; Sherman KE, et al. CROI Abstract 957 *p<0.001 vs PR48 in ADVANCE (75% versus 44%).")
16
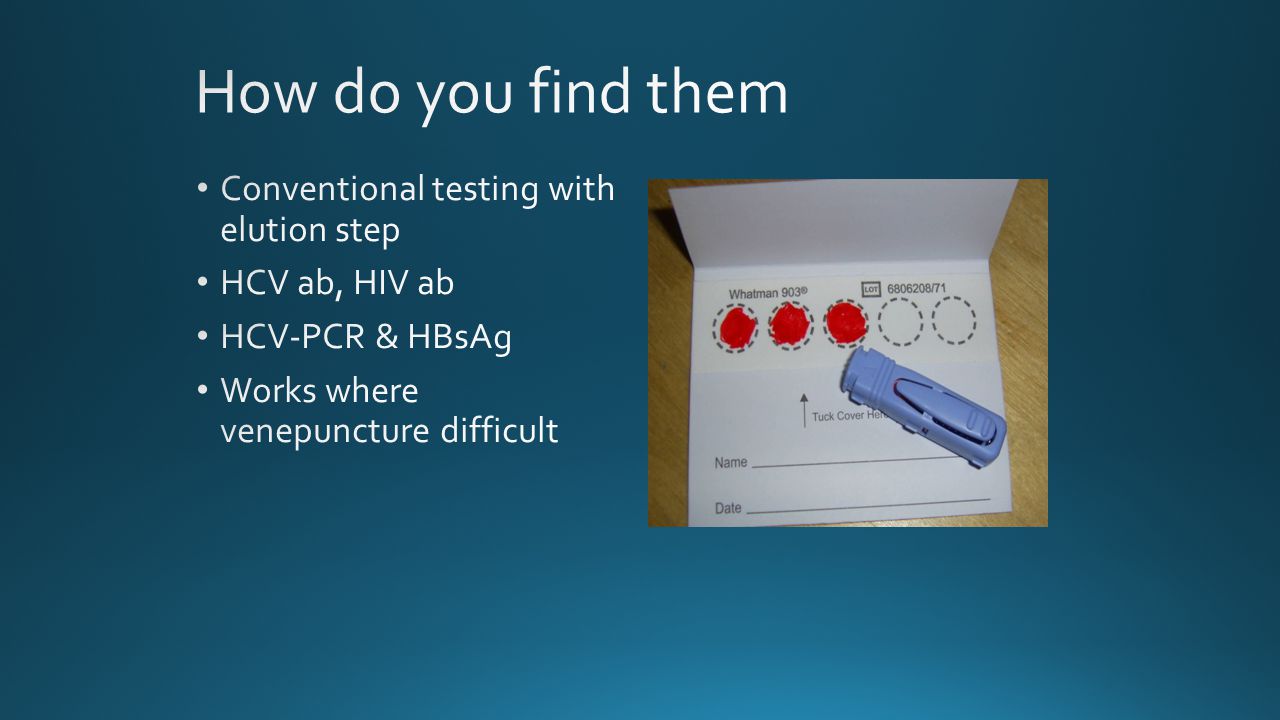
No Contact/harm reduction Methadone/ opiate substitution Needle exchange On or off opiate substitution therapy? Has changed drug habit to get HCV treatment

17
RCTs: randomized control trials

18
PWID: not a barrier to SVR in OST therapy *ex-IDU vs active IDU; P=0.02Jafferbhoy H, et al. J Viral Hepat. 2012:19(2):112–9 Non-IDU Ex-IDU Active IDU 80 70 60 50 40 30 20 10 0 G1 Non-G1 SVR achieved (%) 19/3612/3911/31 56/8633/43*
:112–9 Non-IDU Ex-IDU Active IDU G1 Non-G1 SVR achieved (%) 19/3612/3911/31 56/8633/43*.")
19
The Future

22
22 ‡ Race (Non-Black vs. Black) SOF Phase 3 Analysis in Patients with Traditional Negative Factors Virologic Response: SVR12 in NEUTRINO GT 1,4,5,6 Mangia A, et al. AASLD 2013. Washington, DC. #1115 Non-BlackBlack 91 87 0 20 40 60 80 100 248/273 47/54 Obesity (BMI < vs. ≥ 35 kg/m 2 ) < 35 kg/m 2 ≥ 35 kg/m 2 90 91 0 20 40 60 80 100 254/282 41/45 SVR12 (%) IL28B GT (Non-TT vs. TT) Non-TTTT 0 91 86 20 40 60 80 100 251/276 44/51
 SOF Phase 3 Analysis in Patients with Traditional Negative Factors Virologic Response: SVR12 in NEUTRINO GT 1,4,5,6 Mangia A, et al. AASLD Washington, DC. #1115 Non-BlackBlack /273 47/54 Obesity (BMI < vs. ≥ 35 kg/m 2 ) < 35 kg/m 2 ≥ 35 kg/m /282 41/45 SVR12 (%) IL28B GT (Non-TT vs. TT) Non-TTTT /276 44/51.")
23
Sulkowski M, et al. J Hepatol 2012; 56: S1422 NUC NS5B inhibitor sofosbuvir & Daclatasvir ± Ribavirin (geno 1, n =45)
.")
24
QUEST-1: Phase 3 trial of Simeprevir + PR in G1 treatment-naive patients 24 Jacobson IM et al, EASL 2013, Amsterdam, #1425 A NS3a PI a replacement for Boceprevir or telaprevir Response Guided Therapy criteria met by 85% SVR in 91% of RGT patients No incremental rash/anemia Hyperbilrubinemia

25
AbbVie Phase III Clinical Program Results fixed-dose combination of ABT-450/ritonavir (150/100mg) co-formulated with ABT-267 (25mg), dosed once daily, and ABT-333 (250mg) twice daily StudyPatientsTreatment RegimenSVR 12 PEARL-II (12 weeks) GT1b treatment- experienced (N=179) AbbVie regimen + RBV (n=88) 97% (85/88) AbbVie regimen only (n=91) 100% (91/91) PEARL-III (12 weeks) GT1b treatment-naive (N=419) AbbVie regimen + RBV (n=210) 99% (209/210) AbbVie regimen only (n=209) 99% (207/209) PEARL-IV (12 weeks) GT1a treatment-naive (N=305) AbbVie regimen + RBV (n=100) 97% (97/100) AbbVie regimen only (n=205) 90% (185/205) TURQUOISE-II (12 & 24 weeks) GT1 treatment-naive and treatment-experienced with compensated cirrhosis (N=380) AbbVie regimen + RBV, 12 weeks (n=208) 92% (191/208) AbbVie regimen + RBV, 24 weeks (n=172) 96% (165/172) SAPPHIRE-I (12 weeks) GT1 treatment-naive (N=631) AbbVie regimen + RBV (n=473) 96% (455/473) SAPPHIRE-II (12 weeks) GT1 treatment-experienced (N=394) AbbVie regimen + RBV (n=297) 96% (286/297)
 co-formulated with ABT-267 (25mg), dosed once daily, and ABT-333 (250mg) twice daily StudyPatientsTreatment RegimenSVR 12 PEARL-II (12 weeks) GT1b treatment- experienced (N=179) AbbVie regimen + RBV (n=88) 97% (85/88) AbbVie regimen only (n=91) 100% (91/91) PEARL-III (12 weeks) GT1b treatment-naive (N=419) AbbVie regimen + RBV (n=210) 99% (209/210) AbbVie regimen only (n=209) 99% (207/209) PEARL-IV (12 weeks) GT1a treatment-naive (N=305) AbbVie regimen + RBV (n=100) 97% (97/100) AbbVie regimen only (n=205) 90% (185/205) TURQUOISE-II (12 & 24 weeks) GT1 treatment-naive and treatment-experienced with compensated cirrhosis (N=380) AbbVie regimen + RBV, 12 weeks (n=208) 92% (191/208) AbbVie regimen + RBV, 24 weeks (n=172) 96% (165/172) SAPPHIRE-I (12 weeks) GT1 treatment-naive (N=631) AbbVie regimen + RBV (n=473) 96% (455/473) SAPPHIRE-II (12 weeks) GT1 treatment-experienced (N=394) AbbVie regimen + RBV (n=297) 96% (286/297)")
27
In developed country settings, people who inject drugs (PWID) contribute to the majority (>80%) of HCV transmission Pooled UK evidence for impact of harm reduction on HCV incidence 1 Opiate substitution therapy (OST) or high coverage needle and syringe programmes (NSP) alone reduces an individual’s HCV risk by ~50% In combination, reduces HCV risk by ~80% Modelling indicates OST and NSP likely important in preventing very high HCV prevalences in UK, BUT insufficient to reduce HCV to very low levels 2 [1] Turner K et al. Addiction 2011; 106:1978-88 [2] Vickerman P et al. Addiction 2012;107:1984-1995.
![In developed country settings, people who inject drugs (PWID) contribute to the majority (>80%) of HCV transmission Pooled UK evidence for impact of harm reduction on HCV incidence 1 Opiate substitution therapy (OST) or high coverage needle and syringe programmes (NSP) alone reduces an individual’s HCV risk by ~50% In combination, reduces HCV risk by ~80% Modelling indicates OST and NSP likely important in preventing very high HCV prevalences in UK, BUT insufficient to reduce HCV to very low levels 2 [1] Turner K et al.](http://images.slideplayer.com/14/4477587/slides/slide_27.jpg "Addiction 2011; 106: [2] Vickerman P et al. Addiction 2012;107:")
28
Bars indicate the mean relative prevalence reductions; whiskers represent the 95% credibility interval for the simualtions Martin NK, et al. J Hepatol 2011;54:1137–44 No scale-up Scale-up to 10/1,000 PWID Scale-up to 20/1,000 PWID Scale-up to 40/1,000 PWID Annually Scale-up to 80/1,000 PWID Relative prevalence reduction (%) at 15 years (2027) 100 0 10 30 40 50 60 70 80 90 20 Edinburgh 25% baseline chronic prevalence Melbourne 50% baseline chronic prevalence Vancouver 65% baseline chronic prevalence
 at 15 years (2027) Edinburgh 25% baseline chronic prevalence Melbourne 50% baseline chronic prevalence Vancouver 65% baseline chronic prevalence.")
29
DYNAMIC HCV TRANSMISSION MODEL Non-SVR infected PWID Chronically infected PWID Uninfected PWID Antiviral treatment Allow for re-infection New PWID Cease/die Acutely infected PWID Infection Spontaneous clearance

30
ADDITIONAL RISK HETEROGENEITY High risk, Off OST High risk, On OST Low risk, Off OST Low risk, On OST Martin NK, Vickerman P, Grebely J, Hellard M, Hutchinson SJ, Lima VD, Foster GR, Dillon J, Goldberg DJ, Dore G, and Hickman M. HCV treatment for prevention among people who inject drugs: modeling treatment scale-up in the age of direct acting antivirals. Hepatology 2013 PWID cycle through various risk and intervention states, associated with different risks of HCV acquisition Allows for examination of targeting strategies

31
RESULTS: EDINBURGH IFN-free DAAs Martin NK, Vickerman P, Grebely J, Hellard M, Hutchinson SJ, Lima VD, Foster GR, Dillon J, Goldberg DJ, Dore G, and Hickman M. HCV treatment for prevention among people who inject drugs: modeling treatment scale-up in the age of direct acting antivirals. Hepatology 2013

32
SENSITIVITY ANALYSIS Delaying initiation of IFN-free DAA scale-up by 4 yrs reduces impact by over 20% Less impact seen with shorter injecting duration Impact not sensitive to changes in assumptions regarding population heterogeneity and treatment targeting (low risk or on OST) because of movement/cycling between risk states Martin NK, Vickerman P, Grebely J, Hellard M, Hutchinson SJ, Lima VD, Foster GR, Dillon J, Goldberg DJ, Dore G, and Hickman M. HCV treatment for prevention among people who inject drugs: modeling treatment scale-up in the age of direct acting antivirals. Hepatology 2013

33
Turner K et al. Addiction 2011; 106:1978-88 Effect EstimatesAOR 1 95% CI >100%NSP0.480.30.9 OST0.410.20.8 OST and >100%NSP0.210.10.5 1 adjusted for: gender, crack, homeless, injecting duration 100%NSP is defined as exchanging more syringes than you inject

35
NECESSARY DAA TREATMENT RATES TO HALVE CHRONIC PREVALENCE IN 10 YRS WITH HARM REDUCTION Martin NK, et al.. CID 2013

36
Tayside

38
NESI: Needle Exchange Surveillance Initiative

39
6 months into project

40
1985 20yrs 2004 Success of HCV Therapy 0% 25% 50% 75% 100% Cure rate IFN-α 48 weeks 9% IFN-α 24 weeks 4% IFN/RBV 48 weeks 27% PEG/RBV 48 weeks 45% Triple Rx Protease inhibitor + PEG/RBV 24 weeks 75%2011 Combo DAA Nuc + 2 nd DAA 12 wks No IFN No RGT 95-100%2013 HCV a disease that need not kill anyone HCV a disease we can kill in our life time

Similar presentations


 for HIV and HCV: The evidence and modelling Peter Vickerman.>")


 Phase 3 Treatment Experienced Zeuzem S, et al. N Engl.>")

 Phase 3 Treatment Naïve Jacobson IM, et. al. N Engl J Med.>")


 + RBV in GT1 TURQUOISE-I.>")
 Phase 3 Treatment Naïve Sherman KE, et. al. N Engl J.>")
 Prepared by: David Spach, MD & H. Nina Kim, MD Last Updated: October.>")

