Download presentation
Presentation is loading. Please wait.

1
Pharmacokinetics and safety of etravirine administered once and twice daily and following two weeks treatment with efavirenz in healthy volunteers Marta Boffito 1, Akil Jackson 1, Mohammed Lamorde 1,3, David Back 2, Victoria Watson 2, Jessica Taylor 1, Laura Waters 1, David Asboe 1, Brian Gazzard 1, Anton Pozniak 1 1 St. Stephen’s Centre, Chelsea and Westminster Hospital, London, 2 Department of Pharmacology and Therapeutics, University of Liverpool, Liverpool, UK 3 Department of Pharmacology and Therapeutics, Trinity College Dublin, Ireland

2
Background NNRTI are widely used in combination with other ARVs in the management of HIV infection First generation NNRTIs have low genetic barrier to resistance and single mutations in the HIV reverse transcriptase lead to class-wide resistance [1] Following treatment failure or toxicity, NNRTIs are replaced by RTV boosted PIs. However, as new ARVs with efficacy against resistant virus and improved safety profiles are introduced, switching from NNRTIs to newer ARVs including second generation NNRTIs will occur
![Background NNRTI are widely used in combination with other ARVs in the management of HIV infection First generation NNRTIs have low genetic barrier to resistance and single mutations in the HIV reverse transcriptase lead to class-wide resistance [1] Following treatment failure or toxicity, NNRTIs are replaced by RTV boosted PIs.](http://images.slideplayer.com/14/4474986/slides/slide_2.jpg "However, as new ARVs with efficacy against resistant virus and improved safety profiles are introduced, switching from NNRTIs to newer ARVs including second generation NNRTIs will occur.")
3
Efavirenz has long and variable half-life (40-55 h) at steady state [2] Therapeutic concentrations measured up to several weeks after drug intake cessation in some patients [3] Efavirenz is an inducer of CYP450 [4], leading to reductions in concentrations of co-administered drugs Efavirenz is primarily metabolized by CYP3A4 and CYP2B6 Racially distributed pharmacogenetic differences in CYP2B6 activity appear to contribute to the high inter- individual variability in efavirenz exposure [5]
![Efavirenz has long and variable half-life (40-55 h) at steady state [2] Therapeutic concentrations measured up to several weeks after drug intake cessation in some patients [3] Efavirenz is an inducer of CYP450 [4], leading to reductions in concentrations of co-administered drugs Efavirenz is primarily metabolized by CYP3A4 and CYP2B6 Racially distributed pharmacogenetic differences in CYP2B6 activity appear to contribute to the high inter- individual variability in efavirenz exposure [5]](http://images.slideplayer.com/14/4474986/slides/slide_3.jpg "Efavirenz has long and variable half-life (40-55 h) at steady state [2] Therapeutic concentrations measured up to several weeks after drug intake cessation in some patients [3] Efavirenz is an inducer of CYP450 [4], leading to reductions in concentrations of co-administered drugs Efavirenz is primarily metabolized by CYP3A4 and CYP2B6 Racially distributed pharmacogenetic differences in CYP2B6 activity appear to contribute to the high inter- individual variability in efavirenz exposure [5]")
4
Etravirine retains efficacy in the presence of some common NNRTI associated resistance mutations A 40% decrease in etravirine concentrations was observed when co- administered with efavirenz [6] This appears to be mediated by the inductive effect of efavirenz on CYP3A4, involved in etravirine metabolism Switching from efavirenz to etravirine appears feasible because of development of resistance or toxicity [7,8] The effect of efavirenz on CYP3A4 may last longer than the drug half-life and etravirine sub-therapeutic concentrations are at risk after the switch PK evidence demonstrating adequate etravirine exposure after the switch from efavirenz is lacking; and the duration of CYP3A4 induction and its impact on etravirine concentrations in this scenario is unclear
![Etravirine retains efficacy in the presence of some common NNRTI associated resistance mutations A 40% decrease in etravirine concentrations was observed when co- administered with efavirenz [6] This appears to be mediated by the inductive effect of efavirenz on CYP3A4, involved in etravirine metabolism Switching from efavirenz to etravirine appears feasible because of development of resistance or toxicity [7,8] The effect of efavirenz on CYP3A4 may last longer than the drug half-life and etravirine sub-therapeutic concentrations are at risk after the switch PK evidence demonstrating adequate etravirine exposure after the switch from efavirenz is lacking; and the duration of CYP3A4 induction and its impact on etravirine concentrations in this scenario is unclear](http://images.slideplayer.com/14/4474986/slides/slide_4.jpg "Etravirine retains efficacy in the presence of some common NNRTI associated resistance mutations A 40% decrease in etravirine concentrations was observed when co- administered with efavirenz [6] This appears to be mediated by the inductive effect of efavirenz on CYP3A4, involved in etravirine metabolism Switching from efavirenz to etravirine appears feasible because of development of resistance or toxicity [7,8] The effect of efavirenz on CYP3A4 may last longer than the drug half-life and etravirine sub-therapeutic concentrations are at risk after the switch PK evidence demonstrating adequate etravirine exposure after the switch from efavirenz is lacking; and the duration of CYP3A4 induction and its impact on etravirine concentrations in this scenario is unclear")
5
Objective To assess the PKs of etravirine administered once or twice daily following a 2-week treatment period with efavirenz in healthy volunteers HIV negative healthy volunteers were selected to minimize the potential for development of resistance and preserve treatment options for HIV-infected patients

6
Study design ETR 400 mg OD ETR 200 mg BD WASH OUT EFV 600 mg OD EFV 600 mg OD ETR 400 mg OD ETR 200 mg BD Arm 1 Arm 2 Day 1 Day 14 Day 15 Day 28 Day 29 Day 42 Day 43Day 56 = PK day = Efavirenz and etravirine daily concentration measurement All subjects had serial blood samples for estimation of etravirine concentration collected on days 1, 14, 43 and 56 at the following times: pre-dose, 0.5, 1, 2, 3, 4, 6, 8, 10, and 12 h post-dose Arm 1 subjects also provided blood 24 h post-dose for etravirine C trough determination Samples for the determination of etravirine were collected daily from days 2 to 13 and from days 44 to 55 Samples for the determination of efavirenz concentrations were collected on days 42 and 43, 12 hours post- dosing and daily at the same time every day until day 56

7
Pharmacokinetic and statistical analysis Concentrations of etravirine in plasma were measured using a validated high performance liquid chromatography (HPLC)-tandem mass spectrometry method. Intra-assay and inter assay coefficient of variation at the low, medium and high quality controls were <11% Concentrations of efavirenz were determined using a validated HPLC method as previously described [9] C max, T max, C trough and half-life (t ½ ) were derived for etravirine and efavirenz. Area under the curve from 0 to 24 hours (AUC 0-24 ) for once daily and 0 to 12 hours (AUC 0-12 ) for twice daily etravirine were calculated using WinNonLin version 4.01a (Mountain View, California, USA) Inter individual variability in plasma concentrations during drug intake and following drug cessation was assessed by measuring the coefficient of variation (CV = standard deviation / mean X100) Within-subject changes for etravirine (prior to and after 14-day efavirenz intake period) were assessed by calculating geometric means (GM) and ratios (GMR) and 90% confidence intervals (CIs) The CIs were first determined using logarithms of the individual GMR values and then expressed as linear values. The changes in PK parameters were considered significant when the CI for the GMR did not cross the value of 1 Relationships between weight and BMI and efavirenz daily concentrations or etravirine exposure (expressed as the ratio between AUC prior to and after 14-day efavirenz intake period) were assessed by Pearson’s correlation (the groups were separated into halves by median weight and BMI) Gender differences in drug exposure were calculated using analysis of variance (ANOVA) P values 0.05 were considered statistically significant (SPSS, version 16.0, SPSS Inc. Headquarters)
 were derived for etravirine and efavirenz. Area under the curve from 0 to 24 hours (AUC 0-24 ) for once daily and 0 to 12 hours (AUC 0-12 ) for twice daily etravirine were calculated using WinNonLin version 4.01a (Mountain View, California, USA) Inter individual variability in plasma concentrations during drug intake and following drug cessation was assessed by measuring the coefficient of variation (CV = standard deviation / mean X100) Within-subject changes for etravirine (prior to and after 14-day efavirenz intake period) were assessed by calculating geometric means (GM) and ratios (GMR) and 90% confidence intervals (CIs) The CIs were first determined using logarithms of the individual GMR values and then expressed as linear values. The changes in PK parameters were considered significant when the CI for the GMR did not cross the value of 1 Relationships between weight and BMI and efavirenz daily concentrations or etravirine exposure (expressed as the ratio between AUC prior to and after 14-day efavirenz intake period) were assessed by Pearson’s correlation (the groups were separated into halves by median weight and BMI) Gender differences in drug exposure were calculated using analysis of variance (ANOVA) P values 0.05 were considered statistically significant (SPSS, version 16.0, SPSS Inc. Headquarters).")
8
Results Demographic and clinical characteristics 25 subjects (12 in arm 1 and 13 in arm 2) completed the study 9 subjects were females, median (range) age, weight and BMI were 43 (20-59) years, 83 (54-116) kg and 26 (18–33) kg/m 2 18 were Caucasian, 4 were of Asian origin and 3 were black The study drugs were well tolerated and no grade ¾ adverse events were reported
 completed the study 9 subjects were females, median (range) age, weight and BMI were 43 (20-59) years, 83 (54-116) kg and 26 (18–33) kg/m 2 18 were Caucasian, 4 were of Asian origin and 3 were black The study drugs were well tolerated and no grade ¾ adverse events were reported")
9
Etravirine pharmacokinetics Etravirine PK parameters before and after the efavirenz intake period, at initiation (day 1 and day 42) and at steady-state (day 14 and day 56) are shown in Table 1 Arm 1 and arm 2 steady-state etravirine concentrations before and after the efavirenz intake period are shown in Figure 1 Daily etravirine C trough after efavirenz intake are shown in Figure 2 While weight and BMI did not correlate with the ratio (before:after efavirenz) of etravirine AUC, C trough or C max, a significant effect of gender on the ratio of etravirine AUC and C trough was observed A decrease in AUC of 26.5 % in males, versus -7.5% in females (p=0.050) and 35% decrease in C trough in males versus -2.4% in females (p=0.017) was apparent
 and at steady-state (day 14 and day 56) are shown in Table 1 Arm 1 and arm 2 steady-state etravirine concentrations before and after the efavirenz intake period are shown in Figure 1 Daily etravirine C trough after efavirenz intake are shown in Figure 2 While weight and BMI did not correlate with the ratio (before:after efavirenz) of etravirine AUC, C trough or C max, a significant effect of gender on the ratio of etravirine AUC and C trough was observed A decrease in AUC of 26.5 % in males, versus -7.5% in females (p=0.050) and 35% decrease in C trough in males versus -2.4% in females (p=0.017) was apparent")
10
Etravirine 400 mg once daily (arm 1) Steady-state etravirine C max, C trough and AUC 0-24 22%, 33%, 29% lower after the efavirenz intake period Median (range) etravirine t ½ was 16 (10-28) hours on both days 14/15 (no efavirenz) and 56/57 (after efavirenz) Steady-state etravirine CV for C max, C trough and AUC 0-24 were 23%, 53% and 41% prior to efavirenz intake, and 37%, 80% and 62% after the efavirenz intake period
 Steady-state etravirine C max, C trough and AUC %, 33%, 29% lower after the efavirenz intake period Median (range) etravirine t ½ was 16 (10-28) hours on both days 14/15 (no efavirenz) and 56/57 (after efavirenz) Steady-state etravirine CV for C max, C trough and AUC 0-24 were 23%, 53% and 41% prior to efavirenz intake, and 37%, 80% and 62% after the efavirenz intake period")
11
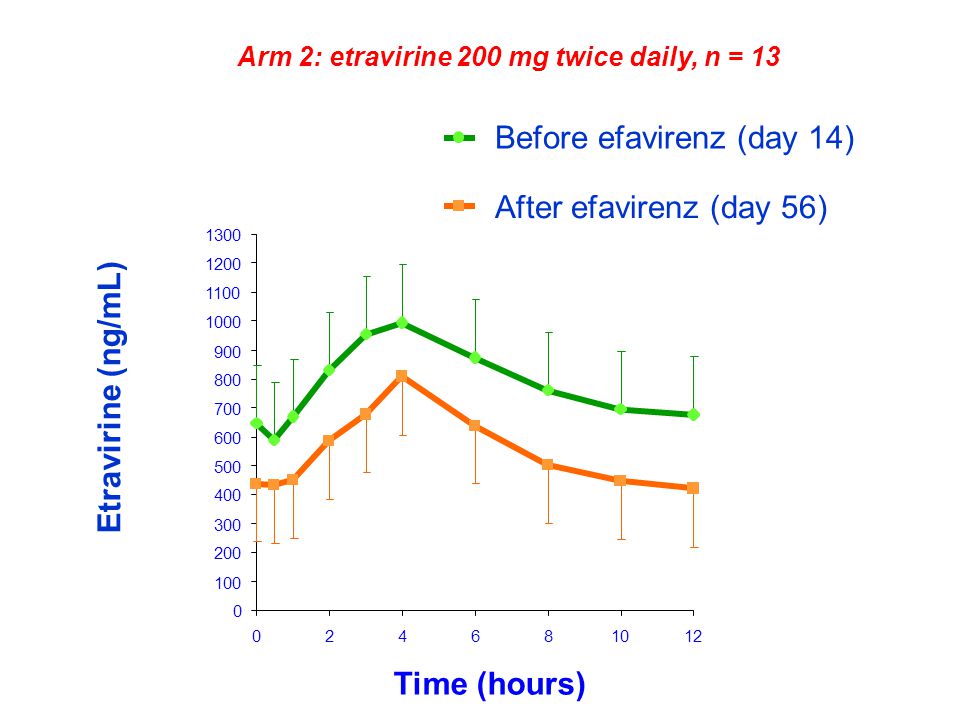
Etravirine 200 mg twice daily (arm 2) Steady-state etravirine C max, C trough and AUC 0-12 were 21%, 37%, 28% lower after the efavirenz intake period Median (range) etravirine t ½ was 13 (11-18) hours on day 14 and 8 (7-9) hours (43% lower) on day 56 Steady state etravirine CV for C max, C trough and AUC 0-12 were 35%, 42% and 38% prior to efavirenz intake, and 27%, 36% and 29% after the efavirenz intake period
 Steady-state etravirine C max, C trough and AUC 0-12 were 21%, 37%, 28% lower after the efavirenz intake period Median (range) etravirine t ½ was 13 (11-18) hours on day 14 and 8 (7-9) hours (43% lower) on day 56 Steady state etravirine CV for C max, C trough and AUC 0-12 were 35%, 42% and 38% prior to efavirenz intake, and 27%, 36% and 29% after the efavirenz intake period")
12
Efavirenz pharmacokinetics Efavirenz intake was stopped on day 42 after a 14 day treatment period t 1/2 (median, range) for subjects enrolled in arm 1 was 83 (45–183) hours and 64 (30–185) hours for subjects in arm 2 All subjects had detectable efavirenz concentrations 7 days after stopping efavirenz intake (day 50) In 5 subjects (3 in arm 1), concentrations > 1000 ng/mL on day 50 2 participants (1 in each arm) weighed less than 60 kg. Of the 3 subjects in arm 1 (1 female), 2 were of Asian origin and 1 was Caucasian Both subjects in arm 2 were Caucasian females Median (range) efavirenz concentrations 3, 7 and 10 days after stopping efavirenz (days 46, 50, and 53) in male subjects (n=16) were 672 (398-4736), 339 (109-3020) and 166 (109-1982) ng/mL
, 2 were of Asian origin and 1 was Caucasian Both subjects in arm 2 were Caucasian females Median (range) efavirenz concentrations 3, 7 and 10 days after stopping efavirenz (days 46, 50, and 53) in male subjects (n=16) were 672 ( ), 339 ( ) and 166 ( ) ng/mL.")
13
In female subjects, they were 1349 (403-6580), 454 (131-3857) and 292 (109-3411) ng/mL After adjusting for age, BMI, height and treatment arm there was no significant effect of gender on efavirenz concentrations Inter individual variability of efavirenz concentrations after drug withholding was wide: CV was 97%, 127%, and 159% on study days 46, 50, and 53 Efavirenz concentrations were negatively correlated with etravirine AUC and C trough ratios on corresponding days after / before efavirenz Correlation coefficients (p values) for efavirenz concentrations on day 50 and day 56 and etravirine AUC ratio at initiation (AUC day 43 / AUC day 1) were -0.60 (p=0.005), -0.62 (p=0.004), respectively Correlations coefficients for efavirenz concentrations on day 50 and 56 and etravirine AUC ratio at steady state (AUC day 56 / AUC day 14) were -0.48 (p=0.032) and -0.45 (p=0.049), respectively For C trough ratios, they were -0.54 (p=0.013) and -0.53 (p=0.017) at initiation, and -0.39 (p=0.089) and -0.393 (p=0.086) at steady state
, 454 ( ) and 292 ( ) ng/mL After adjusting for age, BMI, height and treatment arm there was no significant effect of gender on efavirenz concentrations Inter individual variability of efavirenz concentrations after drug withholding was wide: CV was 97%, 127%, and 159% on study days 46, 50, and 53 Efavirenz concentrations were negatively correlated with etravirine AUC and C trough ratios on corresponding days after / before efavirenz Correlation coefficients (p values) for efavirenz concentrations on day 50 and day 56 and etravirine AUC ratio at initiation (AUC day 43 / AUC day 1) were (p=0.005), (p=0.004), respectively Correlations coefficients for efavirenz concentrations on day 50 and 56 and etravirine AUC ratio at steady state (AUC day 56 / AUC day 14) were (p=0.032) and (p=0.049), respectively For C trough ratios, they were (p=0.013) and (p=0.017) at initiation, and (p=0.089) and (p=0.086) at steady state")
14
Conclusions Efavirenz inducing effect persists after stopping drug intake The decrease in etravirine is comparable to that determined in the presence of darunavir/ritonavir and is not considered clinically significant Clinical studies in HIV-infected patients are ongoing

15
References 1.Wainberg MA. HIV resistance to nevirapine and other non-nucleoside reverse transcriptase inhibitors. J Acquir Immune Defic Syndr 2003,34 Suppl 1:S2-7. 2.Smith PF, DiCenzo R, Morse GD. Clinical pharmacokinetics of non-nucleoside reverse transcriptase inhibitors. Clinical pharmacokinetics 2001,40:893-905. 3.Taylor S, Boffito M, Khoo S, Smit E, Back D. Stopping antiretroviral therapy. AIDS 2007,21:1673-1682. 4.Hariparsad N, Nallani SC, Sane RS, Buckley DJ, Buckley AR, Desai PB. Induction of CYP3A4 by efavirenz in primary human hepatocytes: comparison with rifampin and phenobarbital. J Clin Pharmacol 2004,44:1273-1281. 5.Haas DW, Ribaudo HJ, Kim RB, Tierney C, Wilkinson GR, Gulick RM, et al. Pharmacogenetics of efavirenz and central nervous system side effects: an Adult AIDS Clinical Trials Group study. AIDS 2004,18:2391-2400. 6.Kakuda TN, Scholler-Gyure M, Woodfall B, De Smedt G, Peeters M, Vandermeulen K. TMC125 in combination with other medications: summary of drug-drug interaction studies. In: Program and abstracts of the 8th International Congress on Drug Therapy in HIV infection, Glasgow, Scotland; 2006. 7.Scott C, Grover D, Nelson M. Is there a role for etravirine in patients with Nonnucleoside reverse transcriptase inhibitor resistance? AIDS 2008,22:989-990. 8.Lapadula G, Calabresi A, Castelnuovo F, Costarelli S, Quiros-Roldan E, Paraninfo G, et al. Prevalence and risk factors for etravirine resistance among patients failing on non-nucleoside reverse transcriptase inhibitors. Antivir. Ther. (Lond.) 2008,13:601-605. 9.Almond LM, Hoggard PG, Edirisinghe D, Khoo SH, Back DJ. Intracellular and plasma pharmacokinetics of efavirenz in HIV-infected individuals. J Antimicrob Chemother 2005,56:738-744.
 2008,13: Almond LM, Hoggard PG, Edirisinghe D, Khoo SH, Back DJ. Intracellular and plasma pharmacokinetics of efavirenz in HIV-infected individuals. J Antimicrob Chemother 2005,56:")
16
Figure 1: Mean steady-state etravirine plasma concentrations before (day 14) and after (day 56) efavirenz intake period Bars indicate standard deviation (SD) Arm 1: etravirine 400 mg once daily, n = 12
 and after (day 56) efavirenz intake period Bars indicate standard deviation (SD) Arm 1: etravirine 400 mg once daily, n = 12")
18
Figure 2: Etravirine ( : twice daily; : once daily) trough concentrations and efavirenz ( ) daily concentrations after stopping efavirenz intake and restarting etravirine 10 100 1000 10000 01234567891011121314 Days after stopping efavirenz Drug concentration (ng/mL)
 trough concentrations and efavirenz ( ) daily concentrations after stopping efavirenz intake and restarting etravirine Days after stopping efavirenz Drug concentration (ng/mL)")
19
Table 1: Etravirine pharmacokinetic parameters measured before (days 1 and 14) and after (days 43 and 56) the efavirenz intake period Etravirine PK parameter Before EFV GM (90% CI) Day 1/2 After EFV GM (90% CI) Day 43/44 GMR (90% CI) Before EFV GM (90% CI) Day 14/15 After EFV GM (90% CI) Day 56/57 GMR (90% CI) Arm 1 400 mg OD AUC 0-24h (ng.h/mL) 2996 (2626-4070) 2245 (1899-3171) 0.74 (0.66-0.83) 11064 (9741-14077) 7677 (6373-11134) 0.71 (0.62-0.81) C max (ng/mL) 385 (345-476) 293 (246-405) 0.78 (0.76-0.90) 863 (796-972) 676 (597-832) 0.78 (0.70-0.86) C trough (ng/mL) 41 (36-67) 31 (26-55) 0.71 (0.59-0.85) 270 (243-389) 175 (142-296) 0.67 (0.49-0.91) Day 1Day 43Day 14Day 56 Arm 2 200 mg BID AUC 0-12h (ng.h/mL) 1399 (1259-1777) 1090 (930-1452) 0.78 (0.66-0.92) 8756 (7755-10848) 6481 (5881-7615) 0.72 (0.63-0.81) C max (ng/mL) 286 (250-372) 201 (168-277) 0.70 (0.57-0.86) 1001 (892-1219) 816 (744-949) 0.79 (0.70-0.90) C trough (ng/mL) 52 (48-74) 34 (30-51) 0.66 (0.51-0.85) 596 (528-769) 395 (354-486) 0.63 (0.54-0.73) EFV – efavirenz, OD – once daily, BID – twice daily, AUC – area under the plasma concentration-time curve, C max – maximal concentration, C trough – pre-dose concentration, GM – geometric mean, GMR – geometric mean ratio, CI – confidence interval
 and after (days 43 and 56) the efavirenz intake period Etravirine PK parameter Before EFV GM (90% CI) Day 1/2 After EFV GM (90% CI) Day 43/44 GMR (90% CI) Before EFV GM (90% CI) Day 14/15 After EFV GM (90% CI) Day 56/57 GMR (90% CI) Arm mg OD AUC 0-24h (ng.h/mL) 2996 ( ) 2245 ( ) 0.74 ( ) ( ) 7677 ( ) 0.71 ( ) C max (ng/mL) 385 ( ) 293 ( ) 0.78 ( ) 863 ( ) 676 ( ) 0.78 ( ) C trough (ng/mL) 41 (36-67) 31 (26-55) 0.71 ( ) 270 ( ) 175 ( ) 0.67 ( ) Day 1Day 43Day 14Day 56 Arm mg BID AUC 0-12h (ng.h/mL) 1399 ( ) 1090 ( ) 0.78 ( ) 8756 ( ) 6481 ( ) 0.72 ( ) C max (ng/mL) 286 ( ) 201 ( ) 0.70 ( ) 1001 ( ) 816 ( ) 0.79 ( ) C trough (ng/mL) 52 (48-74) 34 (30-51) 0.66 ( ) 596 ( ) 395 ( ) 0.63 ( ) EFV – efavirenz, OD – once daily, BID – twice daily, AUC – area under the plasma concentration-time curve, C max – maximal concentration, C trough – pre-dose concentration, GM – geometric mean, GMR – geometric mean ratio, CI – confidence interval")
Similar presentations


 or with lipodystrophy. Although,>")


 when combined with Atazanavir 8.11 D Prelutsky 1, P Salvato 2, R Falcon 3 1. Washington University School.>")


