Download presentation
Presentation is loading. Please wait.

1
4 th Conference in Quantitative Biology QUB, September 2013Sol Efroni The Network is a Biomarker in Cancer Signatures Sol Efroni The Mina & Everard Goodman Faculty of Life Sciences Bar Ilan University

2
4 th Conference in Quantitative Biology QUB, September 2013Sol Efroni My Lab Rep-Seq Benichou et al, Immunology 2012 Vainas et al, Autoimmunity 2011 Mascanfroni et al, Nature Immunology 2013 Cancer Genomics Systems Immunology

3
4 th Conference in Quantitative Biology QUB, September 2013Sol Efroni

4
Introduction Biomarkers Regulation Implementation Complex Biomarkers Clinically motivated multi gene markers

5
4 th Conference in Quantitative Biology QUB, September 2013Sol Efroni The problem with Multi-gene mRNA markers Robustness Introduction Biomarkers Regulation Implementation

6
4 th Conference in Quantitative Biology QUB, September 2013Sol Efroni Introduction Biomarkers Regulation Implementation

7
4 th Conference in Quantitative Biology QUB, September 2013Sol Efroni Introduction Biomarkers Regulation Implementation TCGA

8
4 th Conference in Quantitative Biology QUB, September 2013Sol Efroni Introduction Biomarkers Regulation Implementation

9
4 th Conference in Quantitative Biology QUB, September 2013Sol Efroni Phenotype comparison TumorNormal Introduction Biomarkers Regulation Implementation

10
4 th Conference in Quantitative Biology QUB, September 2013Sol Efroni TumorNormal Introduction Biomarkers Regulation Implementation Phenotype comparison

11
4 th Conference in Quantitative Biology QUB, September 2013Sol Efroni Introduction Biomarkers Regulation Implementation A single number to represent the Pathway within this sample

12
4 th Conference in Quantitative Biology QUB, September 2013Sol Efroni Example Regulation as metric Introduction Biomarkers Regulation Implementation

13
Gene 1 Gene 2 Gene 1 is a perfect biomarker Gene 2 is a perfect biomarker 11 22 The pathway is enriched with the interesting genes Gene 1 and Gene 2 and and is therefore important

14
Gene 1 Gene 2 11 22 ? 1 Network Gene 1 is a poor biomarker Gene 2 is a poor biomarker The two gene network is a perfect biomarker Perfect corr Perfect anti corr

15
4 th Conference in Quantitative Biology QUB, September 2013Sol Efroni

18
Introduction Biomarkers Regulation Implementation

19
Efroni et al IET Systems Biology 2013 Greenblum et al. BMC Bioinformatics 2011 Efroni et al PLoS ONE 2009 Introduction Biomarkers Regulation Implementation

20
4 th Conference in Quantitative Biology QUB, September 2013Sol Efroni Pathways as biomarkers and pathways as targets in GBM and in Ovarian cancer

21
4 th Conference in Quantitative Biology QUB, September 2013Sol Efroni Rotem Ben-HamoDr. Helit Cohen Introduction Biomarkers Regulation Implementation ovarian

22
4 th Conference in Quantitative Biology QUB, September 2013Sol Efroni Methodology Ovarian Cancer – 511 patients, 348 whole exomes Introduction Biomarkers Regulation Implementation ovarian Data Collection

23
4 th Conference in Quantitative Biology QUB, September 2013Sol Efroni Ovarian cancer gene signature Introduction Biomarkers Regulation Implementation ovarian

24
4 th Conference in Quantitative Biology QUB, September 2013Sol Efroni Ben-Hamo R, Efroni S. BMC Systems Biology (2012) Survival Analysis: Gene based Introduction Biomarkers Regulation Implementation ovarian
 Survival Analysis: Gene based Introduction Biomarkers Regulation Implementation ovarian.")
25
4 th Conference in Quantitative Biology QUB, September 2013Sol Efroni A pathway view highlights a single pathway Introduction Biomarkers Regulation Implementation ovarian

26
4 th Conference in Quantitative Biology QUB, September 2013Sol Efroni Duke1 Dataset 119 patients Duke2 Dataset 42 patients TCGA 511 patients Ovarian Cancer: PDGF Signaling Pathway provides a robust signature Introduction Biomarkers Regulation Implementation ovarian

27
4 th Conference in Quantitative Biology QUB, September 2013Sol Efroni Again, a collection of sources for clinical and molecular data GBM Introduction Biomarkers Regulation Implementation GBM

28
4 th Conference in Quantitative Biology QUB, September 2013Sol Efroni Pathway 1 Pathway 2 Pathway 3 Pathway 4 Pathway 5 Pathway 6 … Pathway 579 Introduction Biomarkers Regulation Implementation GBM

29
4 th Conference in Quantitative Biology QUB, September 2013Sol Efroni The p38 pathway is most significant “p38 signaling mediated by mapkap kinases” Introduction Biomarkers Regulation Implementation GBM

30
4 th Conference in Quantitative Biology QUB, September 2013Sol Efroni Preliminary Results Ben-Hamo R, Efroni S. Genome Medicine (2011) Ben-Hamo R, Efroni S. Systems Biomedicine (2013) The p38 pathway is robust across multiple datasets Introduction Biomarkers Regulation Implementation GBM
 Ben-Hamo R, Efroni S. Systems Biomedicine (2013) The p38 pathway is robust across multiple datasets Introduction Biomarkers Regulation Implementation GBM.")
31
4 th Conference in Quantitative Biology QUB, September 2013Sol Efroni Another type of regulation has been suggested: microRNA Control over Pathways Inui M et al. Nature Reviews Molecular Cell Biology (2010) Introduction Biomarkers Regulation Implementation GBM
 Introduction Biomarkers Regulation Implementation GBM.")
32
4 th Conference in Quantitative Biology QUB, September 2013Sol Efroni Introduction Biomarkers Regulation Implementation GBM

33
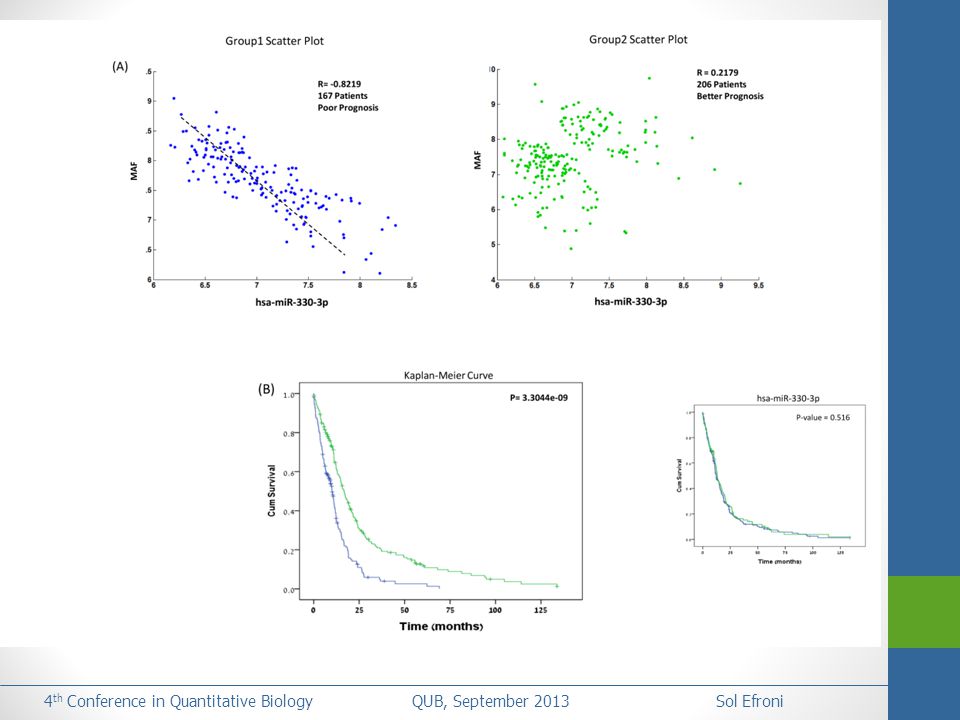
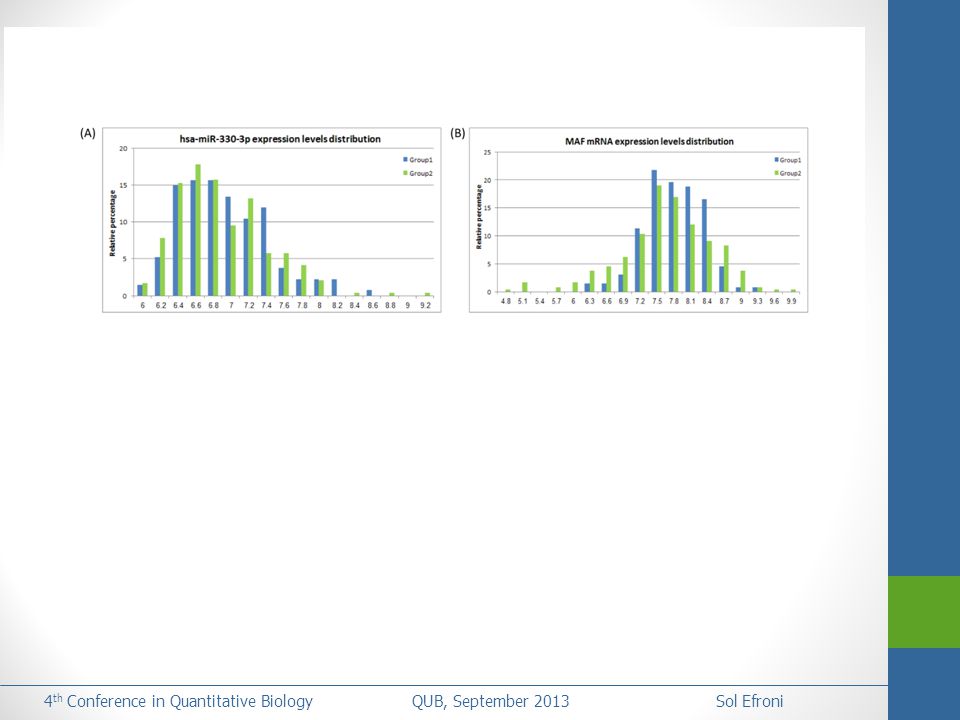
4 th Conference in Quantitative Biology QUB, September 2013Sol Efroni hsa-miR-9 R 2 = -0.21 R 2 = -0.67 P38 signaling pathway P38/MAPKP Pathway AND hsa-miR-9 Introduction Biomarkers Regulation Implementation GBM

34
4 th Conference in Quantitative Biology QUB, September 2013Sol Efroni Preliminary Results - Computational hsa-miR-9 R 2 = -0.21 R 2 = -0.67 P38 signaling pathway P38/MAPKP Pathway AND hsa-miR-9 Introduction Biomarkers Regulation Implementation GBM

35
4 th Conference in Quantitative Biology QUB, September 2013Sol Efroni Preliminary Results - Experimental Expression levels of P38 pathway genes in HeLa Vs. HMEC cell lines HeLa: cervical cancer cell line. HMEC: (Human mammary epithelial cell) primary cell line. microRNAs regulation of pathways - GBM Introduction Biomarkers Regulation Implementation GBM
 primary cell line. microRNAs regulation of pathways - GBM Introduction Biomarkers Regulation Implementation GBM.")
36
4 th Conference in Quantitative Biology QUB, September 2013Sol Efroni Expression levels of P38 pathway genes in HeLa cell lines after miR-9 transfection microRNAs regulation of pathways - GBM Introduction Biomarkers Regulation Implementation GBM

37
4 th Conference in Quantitative Biology QUB, September 2013Sol Efroni miR-9 down regulation of the p38 network improves prognosis ? Can we see the same effect with drug response? Introduction Biomarkers Regulation Implementation GBM

38
4 th Conference in Quantitative Biology QUB, September 2013Sol Efroni Drug response Patients are treated using a wide spectrum of 69 different drugs Drugs are classified into two groups: drugs that target genes in the p38 pathway And drugs that do not target genes in the pathway Introduction Biomarkers Regulation Implementation GBM

39
4 th Conference in Quantitative Biology QUB, September 2013Sol Efroni Out of the 69 drugs given to the patients 6 drugs target genes that are part of the p38 network Drug NameTargetPathway AccutaneRARAmap kinase inactivation of smrt co-repressor CCNUSTMN4Signaling mediated by p38-gamma and p38-delta pathway CelebrexCOX2Signaling mediated by p38-alpha and p38-beta pathway Cis Retinoic AcidRARAmap kinase inactivation of smrt co-repressor SorafenibRAF1p38 signaling mediated by MAPKAP kinases TamoxifenESR1Signaling mediated by p38-alpha and p38-beta pathway Introduction Biomarkers Regulation Implementation GBM

40
4 th Conference in Quantitative Biology QUB, September 2013Sol Efroni Group1 Low survival 169 patients Average overall survival time – 433 days Median survival time – 310 days All patients did not received p38 targeted drugs Group2 High survival 63 patients Average overall survival – 896 days Median survival time – 691 days All patients received p38 targeted drugs Ben-Hamo R, Efroni S. Genome Medicine (2011) Ben-Hamo R, Efroni S. Systems Biomedicine (2013) (CAMDA first prize)
 Ben-Hamo R, Efroni S. Systems Biomedicine (2013) (CAMDA first prize).")
41
4 th Conference in Quantitative Biology QUB, September 2013Sol Efroni

46
Summary Measure the Network Target the Network

47
4 th Conference in Quantitative Biology QUB, September 2013Sol Efroni Summary Core biology hides in functional wiring of the network By selecting for robust signatures we achieve significant markers for prognosis By following the outline of these signatures we discover biology that may lead to treatment

48
Acknowledgements Helit Cohen Rotem Ben Hamo Alona Zilberberg Jennifer Benichou Rivka Cashman Moriah Cohen Miri Gordin Dror Hibsh Ido Sloma Hagit Philip Renana Kozol

49
SYSTEMS BIOMEDICINE JOURNAL

50
Mechanisms

Similar presentations