Download presentation
Presentation is loading. Please wait.

1
Content Page Observational Method Experimental Method
Experimental Design Aims & Hypothesis Variables: IV, VD & EV/CV Operationalisation Sampling Techniques Factors Associated with Research Design Reliability Validity Ethical Issues Data Suggestions for future/Improvements Writing Procedure

2
Core Studies Loftus & Palmer Maguire Baron-Cohen Piliavin
Savage-Rumbaugh Reicher & Haslam Samuel & Bryant Rosenhan Bandura Thigpen & Cleckley Freud Griffiths Dement & Kleitman Milgram Sperry

3
1. Observational Method G541 & G544

4
Section B Briefly outline the observational method used in Psychology (4 marks) Describe 2 observational studies in Psychology (8 marks) Discuss strengths and limitations of using the observational method to investigate behaviour. Use examples of psychological research to support your answer (12 marks) Compare observations with self reports. Use examples of psychological research to support your answer
 Compare observations with self reports. Use examples of psychological research to support your answer.")
5
Key features of the observational method
In an observation, data are collected by someone observing (watching) participants and recording what pts do or say. Sometimes the observer is present and sometimes the observer is hidden behind a one-way mirror. Other recording techniques can be used, including video recordings and CCTV footage. Observations may be conducted on their own or they may be conducted as part of an experiment. NB: What identifies an investigation as an experiment is whether it has an IV and DV rather ran where it is conducted or the details of the procedure
 participants and recording what pts do or say. Sometimes the observer is present and sometimes the observer is hidden behind a one-way mirror. Other recording techniques can be used, including video recordings and CCTV footage. Observations may be conducted on their own or they may be conducted as part of an experiment. NB: What identifies an investigation as an experiment is whether it has an IV and DV rather ran where it is conducted or the details of the procedure.")
6
Observation in Core Studies
Study Approach Observational Role of observation in Study Loftus & Palmer Baron-Cohen Savage-Rumbaugh Bandura Freud Dement & Kleitman Sperry

8
Nature & Use Advantages Disadvantages Ethical Issues
Observation Nature & Use Everything is left as normal, all variables are free to vary. Exam behaviour without the interfering in any way Design: Overt or covert observations Advantages People tend to behave naturally (High EV) Information gathered is rich and full Can be used where other methods are not possible, where variables cannot be manipulated. Disadvantages Experimenter has no control over the situation Participants can be aware of being watched and this can affect behaviour Problems of reliability due to bias or imprecise categorisation of behaviour Problems of validity due to observers’ or coders’ assumptions Replication difficult Ethical Issues Informed consent Difficulty debriefing Privacy
 Information gathered is rich and full. Can be used where other methods are not possible, where variables cannot be manipulated. Disadvantages. Experimenter has no control over the situation. Participants can be aware of being watched and this can affect behaviour. Problems of reliability due to bias or imprecise categorisation of behaviour. Problems of validity due to observers’ or coders’ assumptions. Replication difficult. Ethical Issues. Informed consent. Difficulty debriefing. Privacy.")
9
Different Types of Observation

10
Types of Observation Controlled Observations Natural Observations
Conducted in a laboratory or classroom as part of an experimental procedure. Control of Pts and asked to do set tasks e.g. Bandura Natural Observations No control over pts and what they do e.g. Piliavin Participants Observations Type of natural observation, but observer is playing an active role and fully participating member of the group. Overt & Covert Griffiths Bandura Structured & Unstructured Unstructured >Milgram Time Sampling > Bandura e.g. 5 sec intervals Event Sampling > Bandura

11
Activity 1 Strengths & Weaknesses of Observational Method

12
Activity 1 Strengths & Weaknesses of Observational Method
High EcV > naturalistic Can establish C&E Rich, qualitative data Quan & Quali Covert observations unethical Easy to run Can’t control all variables. Little standardisations. Difficult to replicate. Low in DC’s (covert) High DC’s (overt)
 High DC’s (overt)")
13
Improving Observations
Inter-observer reliability: 2 observers Should be agreement on data collected

14
Activity 2 Strengths & Weaknesses of Observational Types
Controlled Natural Participant Unstructured Structured Time Sampling Event Sampling Overt Sampling Covert Sampling

15
2. Experimental Method

16
Section B Briefly outline the experimental method used in Psychology (4 marks) Describe 2 laboratory experiments in Psychology (8 marks) Discuss strengths and limitations of using the experimental method to investigate behaviour. Use examples of psychological research to support your answer (12 marks) Compare laboratory experiments with field experiments. Use examples of psychological research to support your answer Discuss the extent to which psychology can be a science (8 marks)
 Compare laboratory experiments with field experiments. Use examples of psychological research to support your answer. Discuss the extent to which psychology can be a science (8 marks)")
17
Brainstorm Write down everything you can remember about the experimental method

18
Brainstorm Write down everything you can remember about the experimental method: Types Design Hypothesis Variables Control Ethical Issues Data Collection

19
Research that uses the experimental method…

20
Key features of the experimental method
Theory: The aim of an experimental is to test a hypothesis (prediction) with the aim of disproving or supporting it. Test: In order to test the prediction, it has to be established that one variable (thing) has a measurable effect on another variable (thing). Control: The study must be conducted under controlled conditions so that the researcher can identify that the effect that has been found is due only to an identified variable and not to other factors that were not tested. Replication: In order for support for a theory to be retested it is vital that any experiment can be replicated (imitated with the same results) by others. This means that the method must be identified precisely and be standardised so that it can be imitated.
 with the aim of disproving or supporting it. Test: In order to test the prediction, it has to be established that one variable (thing) has a measurable effect on another variable (thing). Control: The study must be conducted under controlled conditions so that the researcher can identify that the effect that has been found is due only to an identified variable and not to other factors that were not tested. Replication: In order for support for a theory to be retested it is vital that any experiment can be replicated (imitated with the same results) by others. This means that the method must be identified precisely and be standardised so that it can be imitated.")
21
Key steps in an experiment
The experimenter comes up with a hypothesis The experimenter designs an experiment to test that hypothesis The experimenter manipulates one factor (the IV) that s/he has identified in his hypothesis as being likely to cause a particular effect. The experimenter measures the effect of this manipulation (DV). Other variables are controlled. The experimenter analyses the difference in the mean results obtained in each condition. If a significant difference is found between means, this supports the alternative hypothesis. If no significant difference is found, the null hypothesis is retained.
 that s/he has identified in his hypothesis as being likely to cause a particular effect. The experimenter measures the effect of this manipulation (DV). Other variables are controlled. The experimenter analyses the difference in the mean results obtained in each condition. If a significant difference is found between means, this supports the alternative hypothesis. If no significant difference is found, the null hypothesis is retained.")
22
Strengths Limitations
Test hypothesis by manipulation of IV Scientific: follows standardised procedures > enables replication Control over extraneous variables Produces quantitative data which can be statistical analyses to ensure meaningful comparison. Low ecological validity – removed from real life Small sample reduces generalisability Causes stress/anxiety to participants (ethical issues) Doesn't collect qualitative data therefore reductionist.
 Doesn t collect qualitative data therefore reductionist.")
24
Laboratory Experiment
Nature & Use IV manipulated to observe the effect on DV, under controlled conditions. Advantages Establishes causal relationships Allows for replication Good control over confounding variables Disadvantages Artificiality: Mundane realism and experimental realism The effects of being observed: Demand characteristics, (participants) evaluation apprehension (researcher)
 evaluation apprehension (researcher)")
26
Field Experiment Nature & Use Advantages Disadvantages
Investigate causal relationships in more natural surrounding Advantages Establishes cause and effect relationships Allows for replication Behaviour of participants more typical than in a laboratory experiment, high external (ecological) validity Avoids some participant effects Disadvantages Low in internal validity, poor control More time consuming
 validity. Avoids some participant effects. Disadvantages. Low in internal validity, poor control. More time consuming.")
28
Quasi (Naturalistic) Experiment
Nature & Use IV not directly manipulated Naturally occurring Advantages Participants behave naturally Investigates the effects of independent variables that it would be unethical to manipulate Disadvantages Participants not allocated at random to conditions Difficult to identify what aspects of the independent variable have caused the effects on behaviour

29
Activity 3 Strengths & Weaknesses of Experimental Method
EXPERIMENTS Strength Weaknesses

30
Activity 3 Strengths & Weaknesses of Experimental Method
EXPERIMENTS Strength Weaknesses Test hypo by manipulation of IV Low Ec V removed from real life Scientific follow standardised procedures enable replication Difficult to organise > sample sizes small reduced generalisability Enable researcher to control EV thereby improving reliability of the results. Increase anxiety and stress for pts > ethics Produces quantities data that is can be SA therefore robust and meaningful Reductionist > simplifying human behaviour

31
3. Experimental Design

33
Experimental: Independent Groups
Definition Two (or more) groups of participants, one for each condition. Advantages Avoids order effects Participants cannot guess the purpose and of the experiment therefore reduces demand characteristics. Disadvantages Needs more participants Lacks control of participants variables EG: LOFTUS & PALMER
 groups of participants, one for each condition. Advantages. Avoids order effects. Participants cannot guess the purpose and of the experiment therefore reduces demand characteristics. Disadvantages. Needs more participants. Lacks control of participants variables. EG: LOFTUS & PALMER.")
35
Experimental: Matched Participants
Definition Participants matched on key participant variables Advantages No order effects Participants variables partly controlled EV well controlled Disadvantages Matching is difficult EG: Bandura

37
Experimental: Repeated Measures
Definition Same participants in each condition Advantages Good control for participant variables Fewer participants Removes pts variables Disadvantages Order effects (e.g. Boredom, practice) Participants guess the purpose (DC) EG: SAMUEL & BRYANT
 Participants guess the purpose (DC) EG: SAMUEL & BRYANT.")
38
Activity 4 Design Imagine that you are going to conduct an observation of children in a playground with two other researchers. To what extent to you think that you will all record the same behaviours? How might you cope with any disagreements? If an experimenter used different wording in the instructions to different participants, how might this affect the results of the study?

39
Activity 5 Strengths & Weaknesses of Experimental Design
RM MP

40
Activity 5 Strengths & Weaknesses of Experimental Design
No order effects Reduce DC Even with random allocation of pts to groups it is not possible to control pts variables as sample small RM Removes Pts variables Order effects need to be controlled Less control over task variables as different materials need to be presented to remove order effects Increase DC’s as repeat procedure MP EV are well controlled Impossible to control of EV’s normally matched on one/two criterial

41
4. Aims & Hypothesis

43
Research Definition The process of gaining knowledge through the examination of data derived empirically or theoretically. Reasons for using To produce objective facts

45
Aims Definition Reasons for using The stated intention of a study
To be clear about the purpose of a study

47
there will be an effect of x on y
Experimental (alterative) Hypothesis Definition A statement of the relationship between the IV and DV Reasons for using An alternative to the null hypothesis (accept/reject) there will be an effect of x on y
 Hypothesis. Definition. A statement of the relationship between the IV and DV. Reasons for using. An alternative to the null hypothesis (accept/reject) there will be an effect of x on y.")
49
there will be no effect of x on y
Null Hypothesis Definition An assumption that there is no relationship (difference, association, etc) in the population from which a sample is taken with respect to the variables being studied. there will be no effect of x on y
 in the population from which a sample is taken with respect to the variables being studied. there will be no effect of x on y.")
51
Directional Hypothesis
1 TAILED Definition Predicts the effect/relationship Reasons for using Previous research suggests the direction

53
Non-directional hypothesis
2 TAILED Definition Does not predict the direction of the effect/relationship Reasons for using Allows for a difference/relationships occurring in either direction Previous research has been inconclusive

54
Activity 6 Generating Hypothesis
Generate a hypothesis for each of the questions: What are “football hooligans” really like? Do children play differently at different ages? What are the effects of caffeine on attention and concentration? Identify the independent variable (IV) and the dependent variable (DV) from each hypothesis. Identify whether your hypotheses are one tailed or two tailed (remember one-tailed hypothesis predicts the direction of the effect of the IV on the DV, whereas a two-tailed hypothesis does not). Write a null hypothesis for each of the experimental hypotheses.
 and the dependent variable (DV) from each hypothesis. Identify whether your hypotheses are one tailed or two tailed (remember one-tailed hypothesis predicts the direction of the effect of the IV on the DV, whereas a two-tailed hypothesis does not). Write a null hypothesis for each of the experimental hypotheses.")
55
Activity 7 Null Hypothesis
Devise a suitable null and experimental hypothesis for the following: An investigator considers the effect of noise on students’ ability to concentrate and complete a word-grid. One group only is subjected to the noise in the form of a distractor, i.e. a television programme. An investigator explores the view that there might be a link between the amount of television children watch and their behaviour at school.

56
Activity 8 Hypothesis Read through these examples of alternative hypotheses, and identify whether each is one- or two- tailed: There will be a difference in scores on an intelligence test between people who eat fish and those who do not eat fish. There will be a relationship between extroversion and introversion and a preference for loud music People will remember more words in a foreign language if the information is presented in picture form, rather than as words alone.

57
5. Variables

59
Variables Independent Variable Manipulated by the experimenter Create different conditions Dependent Variable Measures the consequence of IV manipulation

60
Activity 9 IV & DV Identify IV, DV in the following them in the following examples. Remember: The IV depends on the DV The IV is manipulated by the experimenter or varies naturally The DV is one we measure Long-term separation effects emotional development more than short-term separation. (The two variables are length of separation and emotional development.) Participants conform more when the model is someone they respect. (The two variables are extent of conformity and degree of respect for the model.) Participants remember more words before lunch than after lunch. (The two variables are number of words remembered and whether the test is before or after lunch). Boys are better than girls at throwing balls. (The two variables are gender and ability to throw a ball). Physical attractiveness makes a person more likeable. (The two variables are attractiveness of a person’s photograph and whether they are rated as more or less likeable.)
 Participants conform more when the model is someone they respect. (The two variables are extent of conformity and degree of respect for the model.) Participants remember more words before lunch than after lunch. (The two variables are number of words remembered and whether the test is before or after lunch). Boys are better than girls at throwing balls. (The two variables are gender and ability to throw a ball). Physical attractiveness makes a person more likeable. (The two variables are attractiveness of a person’s photograph and whether they are rated as more or less likeable.)")
61
ING NEOUS

62
Extraneous Variables Situational variables are characteristics of the environment in which the experiment is being conducted which may have an effect on the results. The nature of these variables is very much dependent on the nature of the experiment but temperature, time and humidity could all be situational variables. Person or Subject variables are inherent characteristics of the Experimental Unit that might affect outcomes. Hence examples of subject variables might include age, gender and other demographic details (among subjects) and x, y and z (among objects) although this is very much dependent on the object in the experiment. Experimental variables are characteristics of the experimenter or the experimental team which might influence how the experiment is conducted, or how the experimental subject responds/behaves in the experimental setting. There is a wide definition for these variables and they may include age, gender, qualifications, etc.
 and x, y and z (among objects) although this is very much dependent on the object in the experiment. Experimental variables are characteristics of the experimenter or the experimental team which might influence how the experiment is conducted, or how the experimental subject responds/behaves in the experimental setting. There is a wide definition for these variables and they may include age, gender, qualifications, etc.")
64
Extraneous Variables Situational variables : Women shown the most romantic proposals are in a warmer room. Personal Variables: What if the women shown the most romantic video clips are also more romantic in nature than the other women? Experiment/Researcher Variables: What if the experimenter was really nice to one group and he was very gruff with the other groups? NB extraneous variables are only important if they are present for one group and not the other. If all of your subjects are exposed to the same extraneous variable (like if Josh was nice to all the subjects), then it won't change your dependent variable and it's not considered an extraneous variable.
, then it won t change your dependent variable and it s not considered an extraneous variable.")
65
EXTRANEOUS Variables Variables other than the independent variable that may bear any effect on the behaviour of the subject being studied. Three main types 1. Subject variables: age, gender, health status, mood, background, etc. 2. Experimental variables are characteristics of the persons conducting the experiment which might influence how a person behaves. Gender, the presence of racial discrimination, language, or other factors may qualify as such variables. 3. Situational variables: Air temperature, level of activity, lighting, and the time of day.

66
Confounding Variables
A confounding variable or factor is also sometimes referred to as a confounder or a lurking variable. It is a "hidden" that affects the variables in question but is not known or acknowledged, and thus (potentially) distorts the resulting data. This hidden third variable causes the two measured variables to falsely appear to be in a causal relation. An experiment that fails to take a confounding variable into account is said to have poor internal validity.
 distorts the resulting data. This hidden third variable causes the two measured variables to falsely appear to be in a causal relation. An experiment that fails to take a confounding variable into account is said to have poor internal validity.")
67
Controlling EV It is necessary to control extraneous variables so that results are not undermined by their effect (become confounding): Control: Ensuring that an extraneous variable remains the same for all experimental units in the experiment. This requires that you are aware of the extraneous variable during the design stage and that you can control it. Constant: Balance the variable across experimental groups This enables comparisons to be made between experimental units on the basis of the effect of the variable.

68
Activity 10 Extraneous Variables
Identify the IV and DV Operationalise variables Identify EV A psychologist wants to investigate whether students who complete their 4 hours of independent study per week do better in the psychology exam than those students who only complete 1 hour per week... An experiment to see if recall on a memory test is affected by time of day Does drinking coffee whilst revising improve exam results? An experiment to investigate the effects of fatigue on reaction time

69
Activity 11 Independent Variables in Core Studies
Loftus & Palmer Samuel & Bryant Bandura Piliavin

70
Activity 11 Independent Variables in Core Studies
Loftus & Palmer The verb in the critical question Samuel & Bryant Asking 2 questions before or after Materials (play-doh, water) Bandura Aggressive model, non aggressive, no model Sex of the model Piliavin Victim ‘black’ or ‘white’ Victim ‘ill’ or ‘drunk’ Intervention of model helper
 Bandura. Aggressive model, non aggressive, no model. Sex of the model. Piliavin. Victim ‘black’ or ‘white’ Victim ‘ill’ or ‘drunk’ Intervention of model helper.")
71
Activity 12 Dependent Variables in Core Studies
Loftus & Palmer Samuel & Bryant Bandura Piliavin

72
Activity 12 Dependent Variables in Core Studies
Loftus & Palmer Estimated recalled speed Samuel & Bryant Mean number of errors in the conservation task Bandura Frequency of imitative aggressive acts Frequency of non-imitative acts Frequency of verbally aggressive behaviours Piliavin Time between first collapse and first helper No of passengers who left when victim collapsed

73
6. Operationalisation

74
‘Eating spinach affects performance’

75
Variables in a form that can be tested (operations)
Operationalisation Variables in a form that can be tested (operations) How hypothesis will be tested Both IV and DV need to be precisely operationalised, otherwise, the results may not be valid and cannot be replicated.
 How hypothesis will be tested. Both IV and DV need to be precisely operationalised, otherwise, the results may not be valid and cannot be replicated.")
76
Activity 13 Operationalisation
Here are some research ideas. For each one, identify the IV & DV and suggest ways in which each could be operationalised: Do people remember more about a topic they are interested in that about one in which they have little interest? Are there gender differences in the amount of aggression shown by children in play? Are neurotic people more likely to suffer from phobias?

77
7. Sampling Method

79
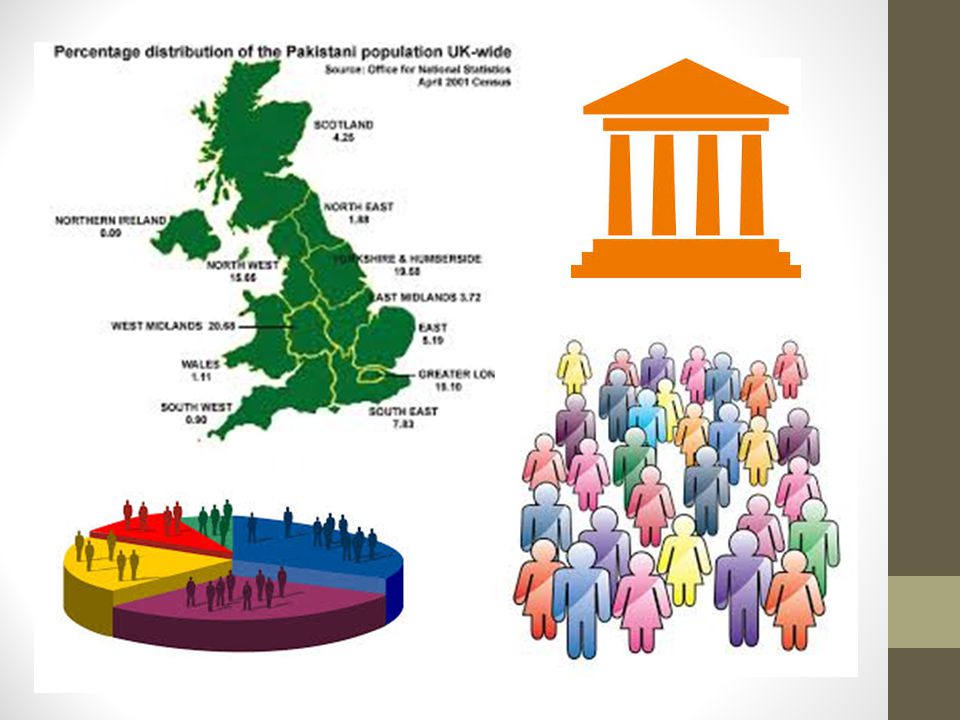
Population Sample Definition Evaluation Definition Evaluation
The group of people whom the sample is drawn Evaluation May be biased Sample Definition Selected to be representative of the population Evaluation May be biased ,therefore can’t generalise

81
Random sampling Definition Advantage Disadvantage
Every member of the population has an equal chance of being selected Advantage Potentially unbiased Most replicable Disadvantage Needs to be drawn from a large population to be unbiased Difficult to obtain

82
Participants for Psychological Research

83
Volunteer Sample Self Selected
Definition Participants become part of a study by volunteering Advantage Access to a variety of participants Ethically sound Disadvantage Volunteer biased Small sample

84
Are you available?

85
Opportunity Sample Definition Advantage Disadvantage
Selecting people who are more easily available Advantage Easy to obtain Disadvantage Very biased Not replicable

86
Activity 14 Target Population
Identify an appropriate target population for each project below. You would select your research sample from this population. To discover whether there are enough youth facilities in your community. To discover whether cats like dried or tinned cat food. To discover whether children aged between 5 and 11 watch too much violent television. To discover the causes of anxiety experienced by participants in research studies.

87
Activity 15 Sampling Find a study to illustrate volunteer sampling and another one to illustrate opportunity sampling. (Clue: Most of the studies you have covered used a volunteer sample, whereas some of the studies have used opportunity samples). Why do you think volunteers are more likely than non-volunteers to be sensitive to the demand characteristics of a study? When would you not expect to find evidence of participant reactivity? Is honesty the best policy? Would demand characteristics be reduced if both participants and experimenters knew the true aims of the experiment?
. Why do you think volunteers are more likely than non-volunteers to be sensitive to the demand characteristics of a study When would you not expect to find evidence of participant reactivity Is honesty the best policy Would demand characteristics be reduced if both participants and experimenters knew the true aims of the experiment")
88
Activity 16 Sampling in Core Studies
Stated Y/N If stated, which one? If not stated, which should? Loftus & Palmer Milgram Maguire Griffiths

89
8. Factors associated with research design
Operationalisation Standardisation Control of variables Pilot studies

90
‘Eating spinach affects performance’
Effects validity and replicability

91
Pilot study Research is expensive (time + money). To establish weather a design works, that pts understand the instructions, that nothing has been missed out, and that pts are able to do what is asked, a pilot study (trial run, small scale) should be undertaken.
. To establish weather a design works, that pts understand the instructions, that nothing has been missed out, and that pts are able to do what is asked, a pilot study (trial run, small scale) should be undertaken.")
92
Any variables that change between conditions, other than the IV...
Control of Extraneous Variables Any variables that change between conditions, other than the IV...

94
Using techniques to ensure that extraneous variables are eliminated
Experimental Control Using techniques to ensure that extraneous variables are eliminated Extraneous/ confounding variables Hold constant or eliminate Random Allocation Participants to experimental groups; allocate items on a test Counterbalancing Order effects balanced to make sure each condition comes first or second in equal amounts (ABBA) Standardised procedures A set of procedures that are the same for all participants. To enable replication.
 Standardised procedures. A set of procedures that are the same for all participants. To enable replication.")
95
Control of Investigator Variables (effect)
Anything that investigator does which has an effect on the participant’s performance other than what was intended Double blind The investigator does not know the purpose of the experiment, to prevent expectations influence the participant’s behaviour Standardised instructions A set of instructions that are the same for all participants. To avoid investigator effects.

96
OR

97
Control of Participant Variables (effect)
Anything that has an effect on the participant’s performance other than what was intended Single blind Deception to prevent the participants knowing the experimental aim Placebo conditions Control group thinks it is receiving the experimental treatment Demand Characteristics A demand characteristic is a subtle cue that makes participants aware of what the experimenter expects to find or how participants are expected to behave. Standardised instructions A set of instructions that are the same for all participants. To avoid investigator effects.

98
Interviewer bias Experimenter bias
Investigator effect: Anything the investigator does which has an effect on a participant’s performance in a study other then what was intended. Interviewer bias The same in an interview situation, through, for example, leading questions and the ‘Green-spoon’ effect Experimenter bias The effect of an experimenter’s expectations, communicated unconsciously, on a participant’s behaviour

99
Control Group In the design of experiments, treatments are applied to experimental units in the treatment group. In comparative experiments, members of the complementary group, the control group, receive either no treatment or a standard treatment.

100
Standardisation Procedures Pts treated in exactly the same way.
Instructions Pts told what to do in exactly the same way.

101
Activity 17 Control of Variables in Core Studies
Well Controlled Confounding Loftus & Palmer Samuel & Bryant Bandura Piliavin

102
Activity 17 Control of Variables in Core Studies
Well Controlled Confounding Loftus & Palmer Video Clips Gender (or age) Samuel & Bryant Same materials Intelligence (or gender) Bandura Same toys to play with Not matched on age Piliavin Same subway carriage Participant variables
 Samuel & Bryant. Same materials. Intelligence (or gender) Bandura. Same toys to play with. Not matched on age. Piliavin. Same subway carriage. Participant variables.")
103
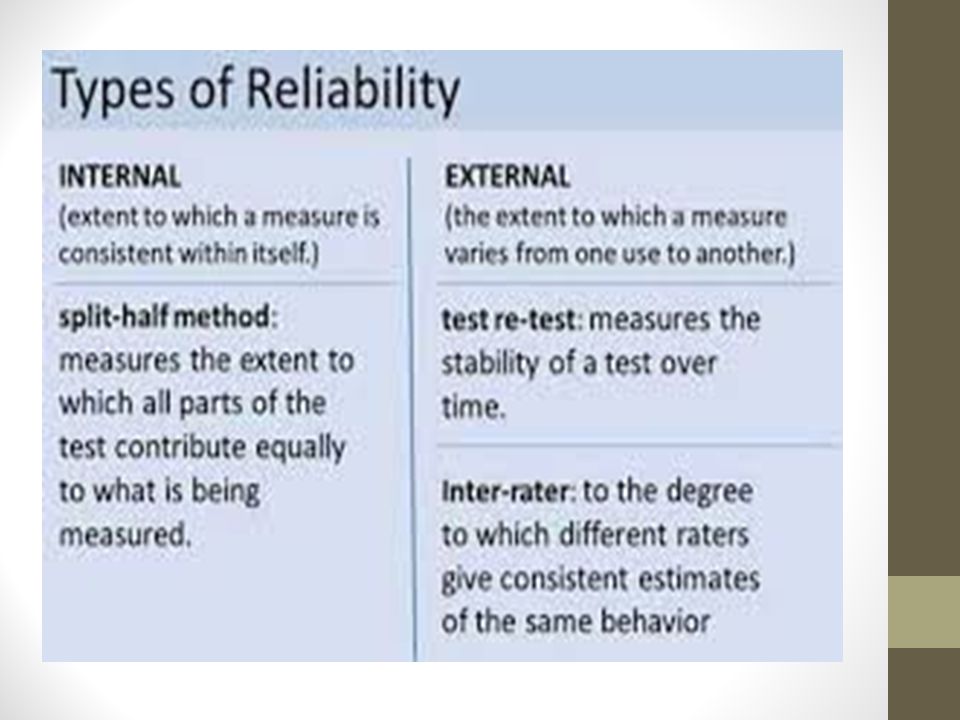
9. Reliability of Measurement

105
10. Validity

106
Generalisability The findings of any particular study should apply to the whole population

109
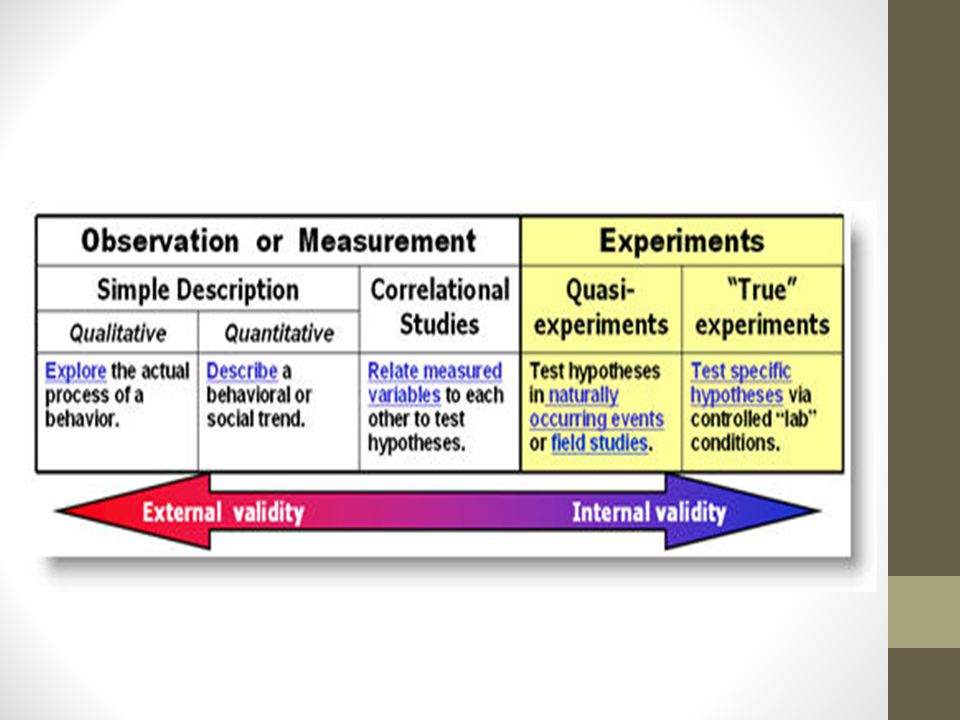
Types of Validity Experimental Internal External Measure Concurrent Content

110
Validity: The legitimacy of a study
Internal Validity The extent to which the a measurement technique measures what it is supposed to Reasons for low internal validity Demand Characteristics: Features of an experiment the elicit a particular response form participants. Participant reactivity Extraneous variables not controlled (CV), act as an additional IV. Mundane realism: Do measures used generalise to real life > contribute to external validity External Validity Validity outside of the research situation, extent to which findings can be generalised Assessing external validity How representative is the sample of participants of the population to which the results are to be generalised? Population V Do the research setting and situation generalise to a real-life setting or situation? Ecological V Do the findings generalise to the past and to the future? Historical V
, act as an additional IV. Mundane realism: Do measures used generalise to real life > contribute to external validity. External Validity. Validity outside of the research situation, extent to which findings can be generalised. Assessing external validity. How representative is the sample of participants of the population to which the results are to be generalised Population V. Do the research setting and situation generalise to a real-life setting or situation Ecological V. Do the findings generalise to the past and to the future Historical V.")
111
Situational Variables Participant Variables Investigator Effects
Experimental Internal Extraneous Mundane Realism External Ecological Validity Population Validity Historical Validity Extraneous Variables Situational Variables Participant Variables Investigator Effects Demand Characteristics Participant Effects

112
Participant Reactivity

113
Participant reactivity: The fact that participants react to cues in an experimental situation
Hawthorne Effect Increased attention becomes a confounding variable Demand Characteristics Features of an experiment that a participant unconsciously, responds to when searching for clues about how to behave. A confounding variable. Social Desirability bias The desire to appear favourably

114
Validity of Psychological Measure
Concurrent Validity How well does the measure agree with existing measures? - Test using old and new tests Content Validity Does the method used actually seem to measure what you intended? - Use a panel of experts Concurrent Measure Content

115
Activity 18 Ecological Validity in Core Studies
How/Low Evidence Loftus & Palmer Samuel & Bryant Dement & Kleitman Milgram

116
11. Ethical Issues

117
11. Ethical Issues Difficulty debriefing Privacy Confidentiality
Deception Informed consent Psychological harm Difficulty debriefing Privacy Confidentiality

118
11. Dealing with Ethical Issues
Presumptive… A B C Prior…

119
Dealing with informed consent
Presumptive consent: Ask for others’ opinion and presume participants feel the same way. Prior general consent: Get participants to agree to take part in a number of studies, one of which they will be deceived in.

120
11. Dealing with Ethical Issues

121
Dealing with deception
Debriefing: Inform participants of true nature of the study after it is conducted and allow them to discuss their feelings. Right to withhold information Cost and benefits: Deception is acceptable if the benefits are sufficient.

122
11. Dealing with Ethical Issues

123
Dealing with protection from psychological harm
Anticipating harm and stopping Using role-play Use of questionnaires: Ask people how they would behave. Debriefing

124
Activity 19 Ethical Issues in Core Studies
Informed Consent Deception RTW Debrief Loftus & Palmer Samuel & Bryant Dement & Kleitman Milgram

125
12. Data Type of data Descriptive Statistics Inferential Statistics

126
Types of Data

127
Data Collection Quantitative Data Qualitative Data
Easy to analysis Produces neat conclusions Oversimplifies reality Qualitative Data Represents the complexity of human behaviour Provides rich data More difficult to detect patterns and reach conclusions Subjective, affected by personal expectations and beliefs

128
Descriptive Statistics
Measures of central tendency Measures of dispersion Graphical representation

129
2,4,4,5,6,6,7,7 8,8,8,8,8 9,10,11,11,12

130
Measures of Central Tendency
Mean: Add values, divide by number of values Makes use of all the data Can be misrepresentative if there are extreme values. Median: Middle value in an ordered list Not affected by extreme scores Not as ‘sensitive’ as the mean Mode: The most common value(s) The mist common value(s) Not useful when there are several modes
 The mist common value(s) Not useful when there are several modes.")
131
Measures of Dispersion

132
Measures of dispersion
the range standard deviation

133
Measures of Dispersion
Range Highest to lowest Easy to calculate Affected by extreme values Standard Deviation SD measures the amount of variation or dispersion from the average. Precise, all values taken into account Harder to calculate

135
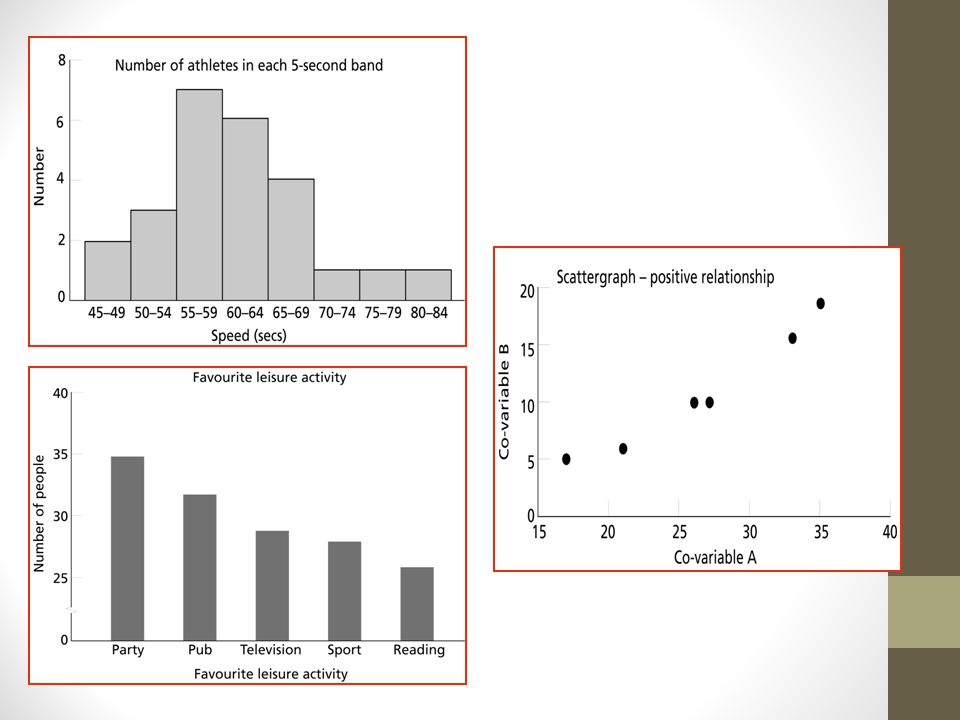
Graphs & Charts Histogram Bar Charts Scattergraph
Graph showing continuous frequency data with a true zero e.g Exam results 0-30marks Bar Charts Graph showing frequency data; data need not be continuous e.g. Categories Scattergraph For correlations. Scatter of dots; each dot represent one case

136
Inferential Statistics
Level of data Levels of significance Tests Type 1 & Type 2 Error

137
Inferential Statistics
June 2012: What does p ≤ 0.05 level of significance mean? (2) This means that this is a 95% probability that the change in the DV is as a result of the IV and a less than 5% probability that this is due to random chance. The findings are therefore statistically significant. Thus we can reject the null hypothesis and accept the experimental/alternative hypothesis. If you obtained this level of significance in your practical project, explain what this would mean in relation to your null hypothesis. (4) June 2011: You must use a repeated measures design experiment and plan to collect quantitative data. State an appropriate statistical test to analyse the data you would collect. Give reasons for your choice. (3)
 This means that this is a 95% probability that the change in the DV is as a result of the IV and a less than 5% probability that this is due to random chance. The findings are therefore statistically significant. Thus we can reject the null hypothesis and accept the experimental/alternative hypothesis. If you obtained this level of significance in your practical project, explain what this would mean in relation to your null hypothesis. (4) June 2011: You must use a repeated measures design experiment and plan to collect quantitative data. State an appropriate statistical test to analyse the data you would collect. Give reasons for your choice. (3)")
138
Inferential Statistics
June 2010: You must use a correlation design and plan to collect at least ordinal data. State an appropriate statistical test (non-parametric) to analyse the data you would collect. Give reasons for your choice. (3) June 2013: How could you obtain nominal level data from your practical project? (3) June 2014: You must use an independent measure design and plan to collect data which measures observable behaviour. State and appropriate inferential statistical test to analyse the data that would be collected in your practical project. Give reasons for your choice. (3
 to analyse the data you would collect. Give reasons for your choice. (3) June 2013: How could you obtain nominal level data from your practical project (3) June 2014: You must use an independent measure design and plan to collect data which measures observable behaviour. State and appropriate inferential statistical test to analyse the data that would be collected in your practical project. Give reasons for your choice. (3")
139
Inferential Statistics
Specimen Papers: You must use a repeated measures design experiment and plan to collect at least ordinal level data. State an appropriate statistical test to analyse the data you would collect. Give reasons for your choice. (3) If having carried out your investigation and an inferential statistical test, your experimental hypothesis was found to be significant for p≤0.05, what would p≤0.05 mean? (3) Identify and describe the rational for choosing an appropriate inferential statistical test that could be used to calculate the significance of any correlation in your practical project. (3) If your practical project comes up with the findings or what does p ≤ 0.05 level of significance mean? (2)
 If having carried out your investigation and an inferential statistical test, your experimental hypothesis was found to be significant for p≤0.05, what would p≤0.05 mean (3) Identify and describe the rational for choosing an appropriate inferential statistical test that could be used to calculate the significance of any correlation in your practical project. (3) If your practical project comes up with the findings or what does p ≤ 0.05 level of significance mean (2)")
140
Inferential Statistics
Experiment This means that this is a 95% probability that the change in the DV is as a result of the IV and a less than 5% probability that this is due to random chance. The findings are therefore statistically significant. Thus we can reject the null hypothesis and accept the experimental hypothesis. Non-Experimental This means that this is a 95% probability that the change in the DV is as a result of the IV and a less than 5% probability that this is due to random chance. The findings are therefore statistically significant. Thus we can reject the null hypothesis and accept the alternative hypothesis. Correlation This means that this is a 95% probability that the relationship between the two variables is significant and a less than 5% probability that this is due to random chance. The findings are therefore statistically significant. Thus we can reject the null hypothesis and accept the alternative hypothesis.

141
Nominal Data

142
Ordinal Data

143
Interval/Ratio Data

144
Levels of Significance
Is there a difference between the groups that is REAL or is it due to CHANCE? Level Probability Significance When used 1% (p<0.01) Highly Where we would want to take few chances 5% (p<0.05) Significant Acceptable for psychological research 10% (p<0.10) Marginally May indicate need for better methodology Less than
 Highly. Where we would want to take few chances. 5% (p<0.05) Significant. Acceptable for psychological research. 10% (p<0.10) Marginally. May indicate need for better methodology. Less than.")
145
Inferential statistics
Non-Parametric statistical tests: Mann Whitney U: Test significance of the difference between two conditions when an independent design has been used and the level of data is at least ordinal. Wilcoxon matched participant signed rank: Test significance of the difference between two conditions when an repeated measures design has been used and the level of data is at least ordinal. Chi-Squared: test of significance of association used when nominal data has been collected. Spearmans Rho Test: when data is at least ordinal and a correlational method is used.

146
Difference/Association
Level of measurement Difference/Association Repeated Independent Correlation Categorical Nominal Sign Test Chi Squared Measured Ordinal Wilcoxon T (matched pairs) Mann Whitney U Spearman (rho)
 Mann Whitney U. Spearman (rho)")
147
Type 1 & 2 Errors There is a possibility that errors may have been made: Type 1 Error Deciding to reject the null when actually the results was due to chance or some other factor. Type 2 Error Deciding to retain the null when actually the result was caused by the IV. Too Low P = <0.10 Type 1 Error more likely Too High P = <0.001 Type 2 Error more likely

148
13. Improvements & Future Research
Indentify a limitation and suggest how you make improvements to the investigation: Example: Sample Method Validity Reliability Ethics If you were to progress research in this area what would you do next? Think about changes that you could make to your stimulus Could you use a different method? What implications does your research have on society? What group would benefit from knowing this information (application) Does this study have real life validity?
 Does this study have real life validity")
149
14. Writing procedures…

150
14. Writing a procedure for Experiments
Decide aim, research question and alternative/null hypothesis Plan procedure, including obtaining ethics approval, choosing experimental design, operationalising the hypothesis, preparation of materials and deciding sampling method. Obtain sample and make arrangements for conduct of study Obtain informed consent from participants Allocate participants to experimental conditions and give instructions. Participants follow experimental steps (data collected) Thank and debrief participants Analysis data, produce conclusions Write report of practical investigation
 Thank and debrief participants. Analysis data, produce conclusions. Write report of practical investigation.")
151
14. Writing a procedure for Observations
Decide aim and research question Plan procedure: obtain ethics approval, draw up schedule (if structured observation): choose and train observers: plan time and location for observation. Possibly run pilot study in order to check on usefulness of selected categories and feasibility. Covert observations – no informed consent/overt Obs – pats informed that observation will be conducted. Place observers in position. Conduct observation – pts are observed for designated period while observers record behaviours (data collected). Thank and debriefed pts (overt) Analyse data, produce findings and draw conclusions Write report of practical investigation.
: choose and train observers: plan time and location for observation. Possibly run pilot study in order to check on usefulness of selected categories and feasibility. Covert observations – no informed consent/overt Obs – pats informed that observation will be conducted. Place observers in position. Conduct observation – pts are observed for designated period while observers record behaviours (data collected). Thank and debriefed pts (overt) Analyse data, produce findings and draw conclusions. Write report of practical investigation.")
152
Qualitative Methods Observations Self Report Correlation

154
Correlational Analysis
Nature & Use Co-variables examined for positive, negative or zero association. Advantages Allows study of hypotheses that cannot be examined directly More data on more variables can be collected more quickly that in an experiment set-up Problems of interpretation are reduced when no association is found Disadvantages Interpretation of results is difficult Cause and effect cannot be established Direction of causality is uncertain Variables other than one of interest may be operating Ethical Issues Misunderstanding of findings because causal relationship cannot be established

156
Questionnaire Nature & Use Advantages Disadvantages
Set of questions Design: open (qual) or closed (quan) Advantages A lot of data can be collected Does not require specialist administrators People are more willing to answer embarrassing or personal questions on an anonymous written questionnaire than in a face-to-face interview Disadvantages Leading questions, social desirability bias Biased samples Ethical Issues Confidentiality Privacy
 or closed (quan) Advantages. A lot of data can be collected. Does not require specialist administrators. People are more willing to answer embarrassing or personal questions on an anonymous written questionnaire than in a face-to-face interview. Disadvantages. Leading questions, social desirability bias. Biased samples. Ethical Issues. Confidentiality. Privacy.")
158
Interview Nature & Use Advantages Disadvantages Ethical Issues
Questions can be predetermined, or created in response to answers. Design: structured/ unstructured questions Advantages Lots of ‘rich’ data Telephone interviews Disadvantages Social desirability bias, interview bias Requires skilled personnel Ethical Issues Confidentiality Privacy

Similar presentations


 Psychological Investigations.>")


