Download presentation
Presentation is loading. Please wait.

1
NHS North of England performance overview - June 2012 report RTT admitted 90% March 2012 62 day Cancer Q4 2011/12 A&E 4 hour wait QTD as at 27-May-12 Mixed Sex accommodat ion April 2012 Ambulance Cat A April 2012 Health Checks Q4 2011/12 C-diff April 2012 PCT Cluster Overall South of Tyne & Wear Tees South Yorkshire & Bassetlaw North of Tyne County Durham & Darlington Merseyside Calderdale Kirklees & Wakefield Humber Lancashire Manchester Cumbria Cheshire Airedale Bradford & Leeds North Yorkshire & York Health Visitors March 2012

2
Data thresholds and time periods Overall score Each Red = 0 Amber = 2 Green=3 Score of >=20 Green, >=16 Amber, <16 Red IndicatorData period Upper threshold (green) Lower threshold (Amber) RTT admitted patients seen within 18 weeks Mar 201290% 62 day cancer waiting timesQ4 2011/1285% C-diff infections12/13 YTD at Apr 120 z-score1 z-score Mixed Sex accommodationApr 20120 breaches Breach rate <1 per 1000 FCEs A&E 4 hour wait Q1 to date at 27 th May 2012 0 main provider trusts breaching the 95% threshold Ambulance Cat A (8 mins)Apr 201275%71% Health Checks – eligible patients offered an NHS health check Q4 2011/12Meets plan 80% of plan level Health Visitors – number of WTE on ESR Mar 2012 Meets PCT cluster target Within 2% of PCT cluster target
 Lower threshold (Amber) RTT admitted patients seen within 18 weeks Mar % 62 day cancer waiting timesQ4 2011/1285% C-diff infections12/13 YTD at Apr 120 z-score1 z-score Mixed Sex accommodationApr breaches Breach rate <1 per 1000 FCEs A&E 4 hour wait Q1 to date at 27 th May main provider trusts breaching the 95% threshold Ambulance Cat A (8 mins)Apr %71% Health Checks – eligible patients offered an NHS health check Q4 2011/12Meets plan 80% of plan level Health Visitors – number of WTE on ESR Mar 2012 Meets PCT cluster target Within 2% of PCT cluster target")
3
Scoring Overall score Each Red = 0 Amber = 2 Green=3 Score of >=20 Green, >=16 Amber, <16 Red Note – The Health Visitor indicator is not included in the overall score.

4
NHS North of England provider performance overview – May 2012 report Provider Overall Rtt admitted 90% March-12 62 day cancer Q4 2011/12 Mixed Sex Accommodation April-12 VTE assessments April-12 6-wk diagnostic wait March-12 C-diff April-12 A&E 4 hour wait QTD as at 27- May-12

5
NHS North of England provider performance overview – May 2012 report Provider Overall Rtt admitted 90% March-12 62 day cancer Q4 2011/12 Mixed Sex Accommodation April-12 VTE assessments April-12 6-wk diagnostic wait March-12 C-diff April-12 A&E 4 hour wait QTD as at 27- May-12

6
Data thresholds and time periods IndicatorData period Upper threshold (green) Lower threshold (Amber) RTT admitted patients seen within 18 weeks Mar 201290% 62 day cancer waiting timesQ4 2011/1285%* C-diff infections12/13 YTD at Apr 120 z-score1 z-score Mixed Sex accommodationApr 20120 breaches Breach rate <1 per 1000 FCEs A&E 4 hour wait Q1 to date as at 27 th May 12 95% Proportion of adult admissions risk assessed for VTE Apr 201290%85% Diagnostic 6-week waiting timesMar 201299%97% * The Clatterbridge Cancer Centre and The Christie, as specialist Cancer Service providers, are monitored against an agreed 79% standard, for 62 day cancer waiting times, by the Department of Health and Monitor.
 Lower threshold (Amber) RTT admitted patients seen within 18 weeks Mar % 62 day cancer waiting timesQ4 2011/1285%* C-diff infections12/13 YTD at Apr 120 z-score1 z-score Mixed Sex accommodationApr breaches Breach rate <1 per 1000 FCEs A&E 4 hour wait Q1 to date as at 27 th May 12 95% Proportion of adult admissions risk assessed for VTE Apr %85% Diagnostic 6-week waiting timesMar %97% * The Clatterbridge Cancer Centre and The Christie, as specialist Cancer Service providers, are monitored against an agreed 79% standard, for 62 day cancer waiting times, by the Department of Health and Monitor.")
7
Scoring Overall score Each Red = 0 Amber = 2 Green = 3 White (denominator=0) = 3 RTT (where <50 patients) = 3 Cancer 62wk wait (where <10 patients) = 3 Score of >=20 Green, >=16 Amber, <16 Red
 = 3 RTT (where <50 patients) = 3 Cancer 62wk wait (where <10 patients) = 3 Score of >=20 Green, >=16 Amber, <16 Red")
8
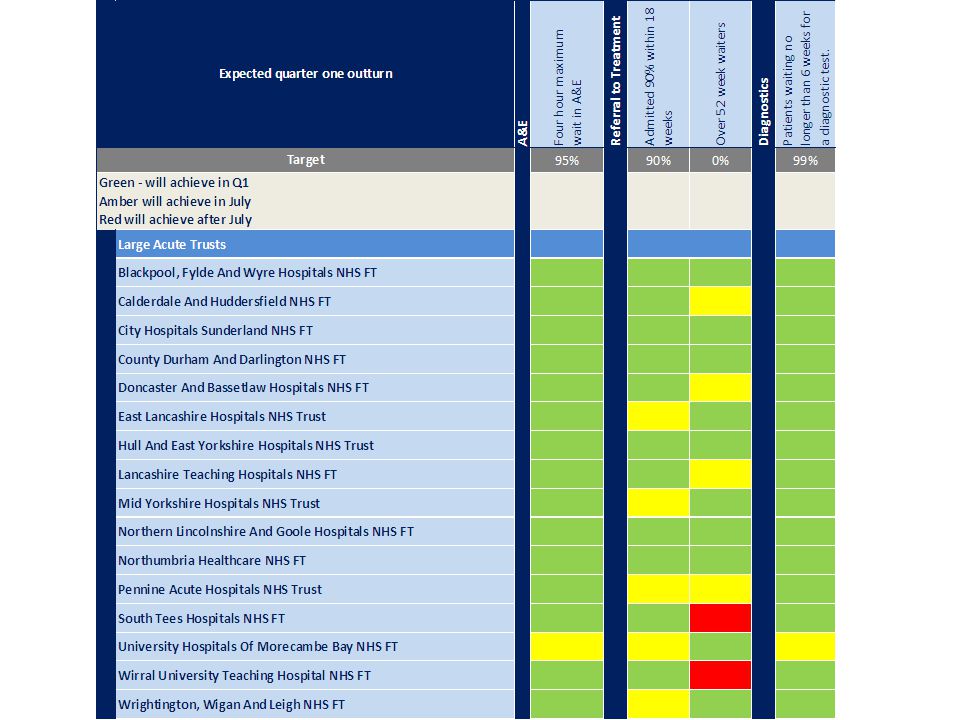
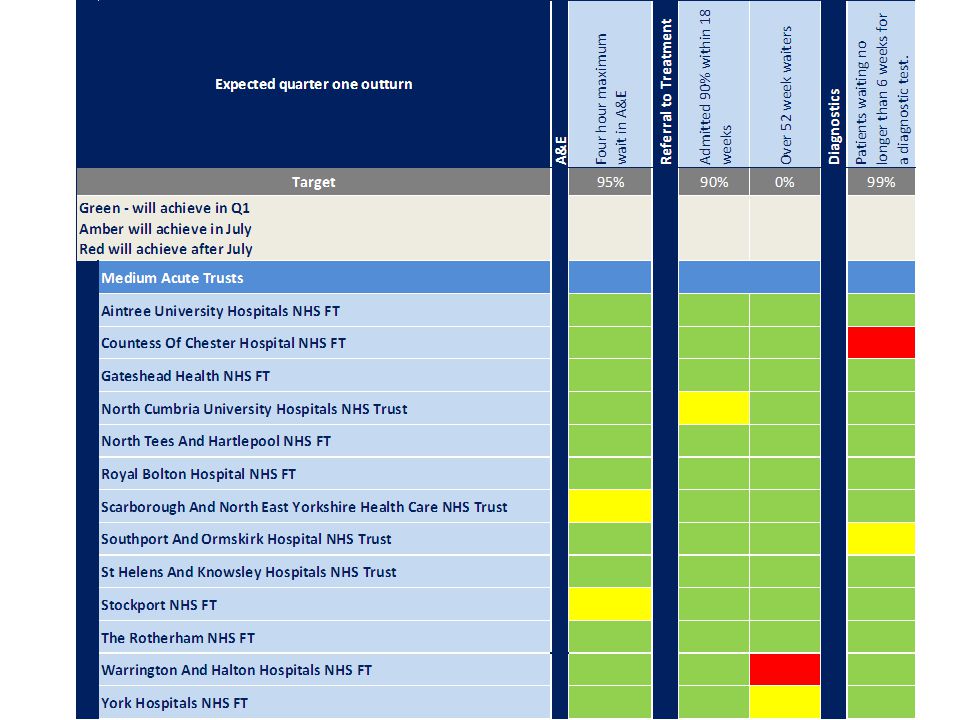
Projected Q1 performance outturn A&E RTT for admitted patients Over 52 week waiters Diagnostics

Similar presentations


 Draft v0.1 19 March 2011.>")


>")


