Download presentation
Presentation is loading. Please wait.

2
Summary of 8th lesson Exotic microbes have a reduced level of genetic variability If genotypes fall on clades separated by long branches, it may be an indication there is no sex going on between individuals belonging to the two branches. Formal tests like the Index of association can test for that Anonymous multilocus analysis can be done without any knowledge of the genome using markers such as RAPDs or AFLPs Need to eliminate co-segregant markers and to use Jaccard;s

3
Dealing with dominant anonymous multilocus markers Need to use large numbers (linkage) Repeatability Graph distribution of distances Calculate distance using Jaccard’s similarity index
 Repeatability Graph distribution of distances Calculate distance using Jaccard’s similarity index")
4
Jaccard’s Only 1-1 and 1-0 count, 0-0 do not count 1010011 1001011 1001000

5
Jaccard’s Only 1-1 and 1-0 count, 0-0 do not count A: 1010011 AB= 0.60.4 (1-AB) B: 1001011 BC=0.50.5 C: 1001000 AC=0.20.8
 B: BC= C: AC=0.20.8")
6
Now that we have distances…. Plot their distribution (clonal vs. sexual)
")
7
Now that we have distances…. Plot their distribution (clonal vs. sexual) Analysis: –Similarity (cluster analysis); a variety of algorithms. Most common are NJ and UPGMA
 Analysis: –Similarity (cluster analysis); a variety of algorithms. Most common are NJ and UPGMA.")
8
Now that we have distances…. Plot their distribution (clonal vs. sexual) Analysis: –Similarity (cluster analysis); a variety of algorithms. Most common are NJ and UPGMA –AMOVA; requires a priori grouping
 Analysis: –Similarity (cluster analysis); a variety of algorithms. Most common are NJ and UPGMA –AMOVA; requires a priori grouping.")
9
AMOVA groupings Individuals within population Among populations Among regions AMOVA: partitions molecular variance amongst a priori defined groupings

10
Results: Jaccard similarity coefficients 0.3 0.900.920.94 0.960.98 1.00 0 0.1 0.2 0.4 0.5 0.6 0.7 Coefficient Frequency P. nemorosa P. pseudosyringae: U.S. and E.U. 0.3 Coefficient 0.900.920.940.960.981.00 0 0.1 0.2 0.4 0.5 0.6 0.7 Frequency

11
0.90.910.920.930.940.950.960.970.980.99 Pp U.S. Pp E.U. 0.0 0.1 0.2 0.3 0.4 0.5 0.6 Jaccard coefficient of similarity 0.7 P. pseudosyringae genetic similarity patterns are different in U.S. and E.U.

12
P. nemorosa P. ilicis P. pseudosyringae Results: P. nemorosa

13
Results: P. pseudosyringae P. nemorosa P. ilicis P. pseudosyringae = E.U. isolate

14
Have we sampled enough? Resampling approaches Saturation curves –A total of 30 polymorphic alleles –Our sample is either 10 or 20 –Calculate whether each new sample is characterized by new alleles

15
Saturation curves 1 2 3 4 5 6 7 8 9 10 11 12 13 14 15 16 17 18 19 20 No Of New alleles

16
If we have codominant markers how many do I need IDENTITY tests = probability calculation based on allele frequency… Multiplication of frequencies of alleles 10 alleles at locus 1 P1=0.1 5 alleles at locus 2 P2=0,2 Total P= P1*P2=0.02

17
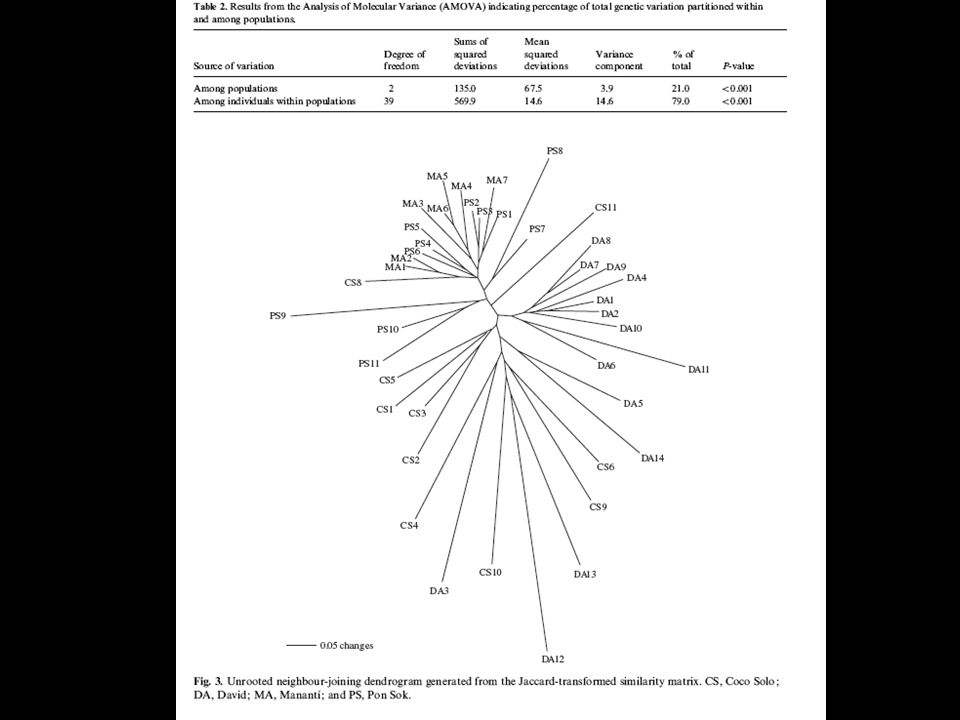
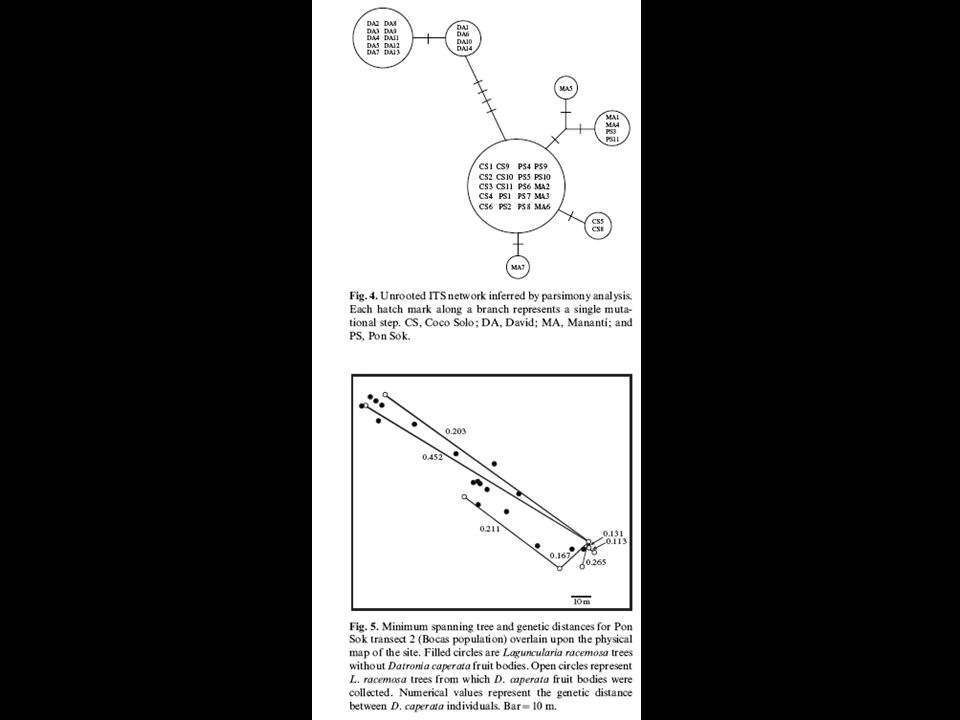
White mangroves: Corioloposis caperata

21
White mangroves: Corioloposis caperata Distances between study sites

22
Coriolopsis caperata on Laguncularia racemosa Forest fragmentation can lead to loss of gene flow among previously contiguous populations. The negative repercussions of such genetic isolation should most severely affect highly specialized organisms such as some plant- parasitic fungi. AFLP study on single spores

24
Using DNA sequences Obtain sequence Align sequences, number of parsimony informative sites Gap handling Picking sequences (order) Analyze sequences (similarity/parsimony/exhaustive/bayesian Analyze output; CI, HI Bootstrap/decay indices
 Analyze sequences (similarity/parsimony/exhaustive/bayesian Analyze output; CI, HI Bootstrap/decay indices")
25
Using DNA sequences Testing alternative trees: kashino hasegawa Molecular clock Outgroup Spatial correlation (Mantel) Networks and coalescence approaches
 Networks and coalescence approaches")
26
Good chromatogram! Bad chromatogram… Pull-up (too much signal)Loss of fidelity leads to slips, skips and mixed signals Reverse reaction suffers same problems in opposite direction
Loss of fidelity leads to slips, skips and mixed signals Reverse reaction suffers same problems in opposite direction.")
27
Alignments (Se-Al)
")
28
Distance vs. parsimony Distance simply calculates at how many positions sequences are similar or differen – (Matteo) ACGTAACGTT-AG –(Amanda)AGTTAACGTTAAG –(Patrick)ACTTAACGTTAAG
 ACGTAACGTT-AG –(Amanda)AGTTAACGTTAAG –(Patrick)ACTTAACGTTAAG.")
29
Distance vs. Parsimony Patrick AmandaMatteo Matteo Patrick Amanda OUTGROUP can allow us to pick Matteo as ancestral

30
Confidence Bootstrap (resampling approcah) Decay indices (threshold approach) Consistency index Homoplasy index
 Decay indices (threshold approach) Consistency index Homoplasy index")
31
Pacifico Caribe

32
The “scale” of disease Dispersal gradients dependent on propagule size, resilience, ability to dessicate, NOTE: not linear Important interaction with environment, habitat, and niche availability. Examples: Heterobasidion in Western Alps, Matsutake mushrooms that offer example of habitat tracking Scale of dispersal (implicitely correlated to metapopulation structure)---
---.")
38
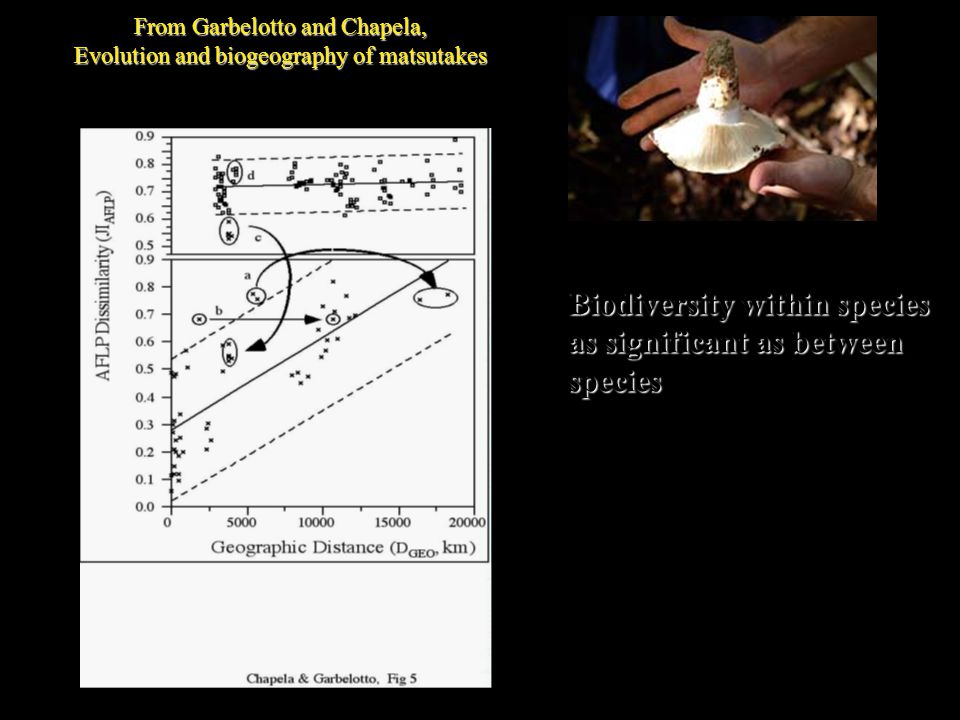
From Garbelotto and Chapela, Evolution and biogeography of matsutakes Biodiversity within species as significant as between species

39
Other important types of markers (co-dominant) Restriction Fragment Length Polymorphisms (RFLP) of a locus Single Nucleotide Polymorphisms (SNPs) Microsatellites (SSR)
 Restriction Fragment Length Polymorphisms (RFLP) of a locus Single Nucleotide Polymorphisms (SNPs) Microsatellites (SSR)")
40
Restriction Fragment Length Polymorphisms (RFLP) of a locus aacccacgtcaataaaaa aacccac + gtcaataaaaa One restriction site aacccaggtcaataaaaa No restriction sites
 of a locus aacccacgtcaataaaaa aacccac + gtcaataaaaa One restriction site aacccaggtcaataaaaa No restriction sites")
41
Restriction Fragment Length Polymorphisms (RFLP) of a locus Two alternate alleles= codominant marker
 of a locus Two alternate alleles= codominant marker")
42
Single Nucleotide Polymorphisms (SNPs) nnACGTnnnnnnTAAGnnnnnn nnAGGTnnnnnnTATGnnnnnn
 nnACGTnnnnnnTAAGnnnnnn nnAGGTnnnnnnTATGnnnnnn")
43
Dept. of Energy / Joint Genome Institute (www.JGI.gov) Shotgun sequencing Completed May 2004 - 7x coverage 66 MB………..much larger than first calculated Used 445,030 reads (FASTA format)- 3x coverage FASTA format
- 3x coverage FASTA format.")
44
1. SSR detection * batch search * di and tri-nucleotide repeats * differ in repeat length CCGAAATCGGACCTTGAGTGCGG AGAGAGAGAGAGA CTGTACGAGCCCGAGTCTCGCAT

45
locus ct 0070

46
Microsatellites (SSR) Supposed to be neutral Stepwise mutation model Very sensitive because loci are prone to mutation Allele is af fragment of DNA that includes the flanking regions of the microsatellite and then a certain number of tandem repeats (variation in size should be in multiple of SSR(
 Supposed to be neutral Stepwise mutation model Very sensitive because loci are prone to mutation Allele is af fragment of DNA that includes the flanking regions of the microsatellite and then a certain number of tandem repeats (variation in size should be in multiple of SSR(")
Similar presentations


>")
 Molecular Medicine 2) Energy sources and environmental applications 3) Risk assessment 4) Bioarchaeology,>")


 The order of the base pairs in the sequence of every human varies In a single.>")

 Analyze sequences (similarity/parsimony/exhaustive/bayesian.>")


 Known as the Humungous Fungus, or honey mushroom Form rhizomorphs, which make up much of the “humungous” part Basidiocarp:>")
 Known as the Humungous Fungus, or honey mushroom Form rhizomorphs, which make up much of the “humungous” part Basidiocarp:>")


