Download presentation
Presentation is loading. Please wait.

1
SOLVED EXAMPLES

2
Example 1 Rubber tires are known to have km as mean life time and 5000 km as standard deviation. A Sample of 16 rubber tires are selected randomly, what is the probability that the SAMPLE MEAN will be in the interval from to Find the standard error in using the sample mean to ESTIMATE the population mean.

3
Example 2 Suppose that X is the number of observed “successes” in a sample of n observations where p is the probability of success on each observation. Show that = X/n is an unbiased estimator of p Show that the standard error of is

4
Example 3 Let X be a random variable with mean μ and variance б2
Given two independent random samples of sizes n1 and n2, with sample means Show that is an unbiased estimator of µ If are independent , Find the value of that minimizes the standard error of

5
Now Find and

6
Therefore, Then S2 is Unbiased Estimator of σ2

7
Z is Standard Normal variable
To proceed further to find SE(S2), Bias (S) and MSE(S), a new important distribution should be considered. Standard Normal σ2=1 Z It is the CHI-SQUARE distribution Consider the variable ζ1 = Z2 where, n Z is Standard Normal variable 2 ζ ζ1 is a Chi-square variable with one degree of freedom has mean=1 and variance = 2 1 Chi-square ζ2 is a Chi-square variable with two degrees of freedom has mean =2 and variance=4 ζn is a Chi-square variable with n degrees of freedom has mean =n and variance = 2n
, Bias (S) and MSE(S), a new important distribution should be considered. Standard Normal. σ2=1. Z. It is the CHI-SQUARE distribution. Consider the variable ζ1 = Z2 where, n. Z is Standard Normal variable. 2. ζ. ζ1 is a Chi-square variable with one degree of freedom. has mean=1 and variance = Chi-square. ζ2 is a Chi-square variable with two degrees of freedom. has mean =2 and variance=4. ζn is a Chi-square variable with n degrees of freedom. has mean =n and variance = 2n.")
8
is a Chi-square variable with (n-1) degrees of freedom ζn-1 .
Mean = n and Variance = 2 (n-1) Then
 Then.")
9
Find the Standard Error SE of Estimator

10
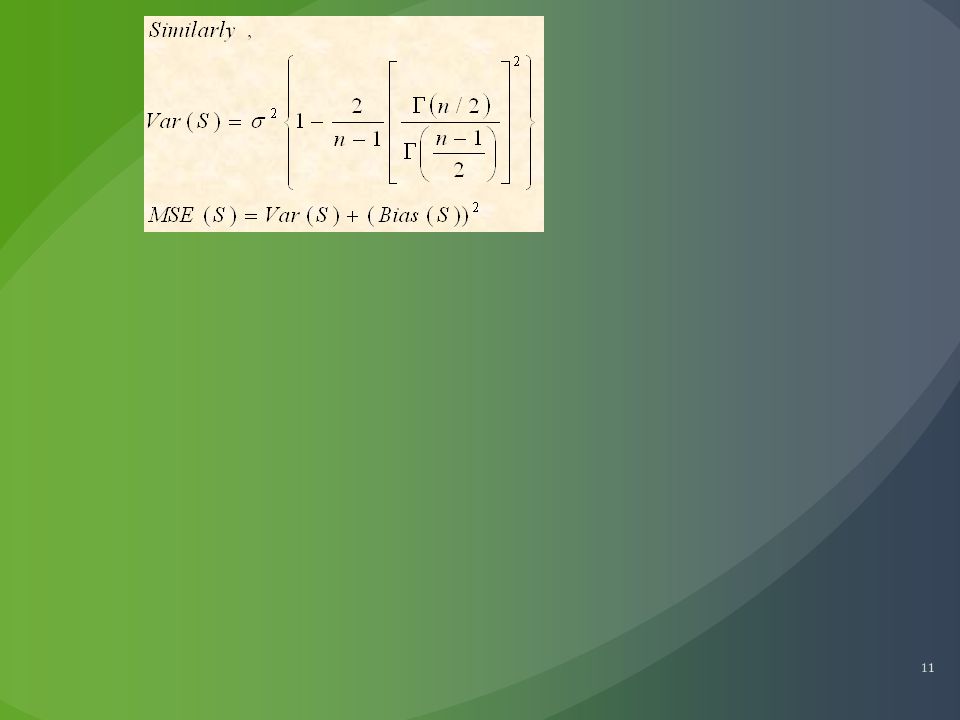
BIAS and MEAN SQUARE ERROR OF ESTIMATOR S
Chi-Square distribution The Probability density function of ζn-1 is given by: Then S is a Biased Estimator of σ

12
NONCONVENTIONAL PARAMETERS
ESTIMATION OF NONCONVENTIONAL PARAMETERS Conventional Parameters are mainly: Mean, Variance, Standard Deviation, Quartiles Consider the following Population Probability Density Functions Parameters Ө,β and η in the above distribution are Nonconventional There are TWO Methods for Deriving ESTIMATORS For these PARAMETERS 1- Method of MOMENTS 2- Method of MAXIMUM LIKELIHOOD FUNCTION

13
METHOD OF MOMENTS

14
Consider the following Probability Density Function
Required to find an expression to Evaluate an Estimator of the Parameter θ By the method of Moments

15
MAXIMUM LIKELIHOOD FUNCTION

16
Given a SAMPLE of size N: x1, x2, x3,…, xN
Taken from the population with known distribution f(x|Ө) Likelihood Function is the Joint Probability Function Of All points of the SAMPLE The idea of the method of Maximum Likelihood is to determine The expression of the parameter Ө that makes L(Ө) MAXIMUM This could be done by Differentiating L(Ө) w.r.t Ө and equating to zero
 Likelihood Function is the Joint Probability Function. Of. All points of the SAMPLE. The idea of the method of Maximum Likelihood is to determine. The expression of the parameter Ө that makes L(Ө) MAXIMUM. This could be done by Differentiating L(Ө) w.r.t Ө and equating to zero.")
17
A population is defined by the following probability density function
Example 1 A population is defined by the following probability density function Find the Maximum Likelihood Estimator of Ө Now, the Likelihood Function of the population is given by: Taking the logarithm of L(Ө) Differentiate w.r.to Ө and equate to zero, we find Consider the first moment of the f(x) Therefore
 Differentiate w.r.to Ө and equate to zero, we find. Consider the first moment of the f(x) Therefore.")
18
Example 2 A population is defined by the BINOMIAL distribution as follows: Find the Maximum Likelihood Estimator of p The Likelihood Function of the population is given by: Taking the logarithm of the likelihood function Differentiate w.r.to and equate to zero

19
A population is defined by the following probability density function
Example 3 A population is defined by the following probability density function Find the Maximum Likelihood Estimator of Ө Now, the Likelihood Function of the population is given by: Taking the logarithm of L(Ө) Differentiate w.r.to Ө and equate to zero, we find Therefore, the Maximum Likelihood Estimator MLE of the parameter Ө can be readily found as follows:
 Differentiate w.r.to Ө and equate to zero, we find. Therefore, the Maximum Likelihood Estimator MLE. of the parameter Ө. can be readily found as follows:")
20
Example 4 A population is defined by the following Normal Distribution Find the Maximum Likelihood Estimators of µ, σ Now, the Likelihood Function of the population is given by: Taking the logarithm of L(µ, σ) Differentiate partially w.r.to µ and σ and equate to zero, we find
 Differentiate partially w.r.to µ and σ and equate to zero, we find.")
Similar presentations

 2004 Brooks/Cole, a division of Thomson Learning, Inc. Chapter 6 Point Estimation.>")


 values must be estimated before.>")


=“geometric distribution”), 9-R9(a,b) Recommended Questions: 9.1, 9.8, 9.20, 9.23, 9.25.>")
