Download presentation
Presentation is loading. Please wait.

1
Herschel study of the dust content of Cassiopeia A Ref: arxiv:1005.2688v1 Oliver Krause PPT

2
Why study the dust in SNRs As important producers of the dust grains – Ejecta dust is thought to play a key role as a coolant in the formation of high-redshift galaxies (Morgan & Edwards 2003) – (0.1-1 M sun of dust per SNe is required to form to explain large dust content (>10 8 M sun ) and rapid enrichment) SNRs ejecta and the dust physics in the shock Need direct, observational evidence
 – (0.1-1 M sun of dust per SNe is required to form to explain large dust content (>10 8 M sun ) and rapid enrichment) SNRs ejecta and the dust physics in the shock Need direct, observational evidence")
3
Herschel space telescope 1,500,000 km from the Earth Probing the cold but animate universe The Three Musketeers: 1. PACS (Photodetecting Array Camera and Spectrometer) 55 to 210 um 2. SPIRE (Spectral and Photometric Imaging Receiver) 194 to 672 um 3. HIFI (Heterodyne Instrument for the Far Infrared) 240 to 625 um R=10 7
 55 to 210 um 2. SPIRE (Spectral and Photometric Imaging Receiver) 194 to 672 um 3. HIFI (Heterodyne Instrument for the Far Infrared) 240 to 625 um R=10 7.")
4
PACS bands (top row) and in the three SPIRE bands (bottom row)
 and in the three SPIRE bands (bottom row)")
5
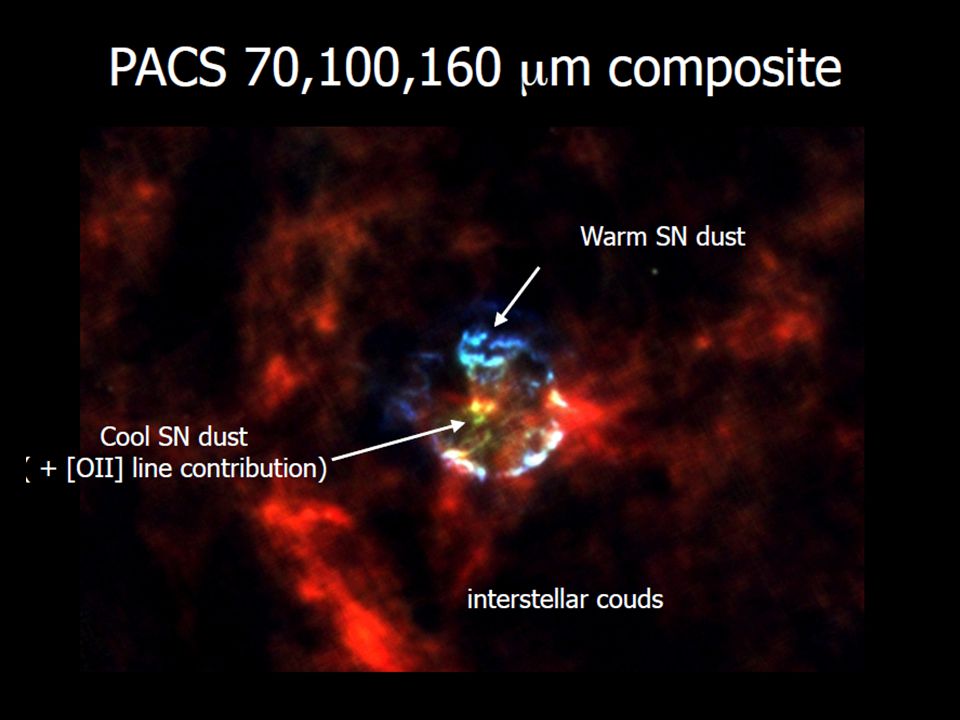
Resemblistic analysis (image part) PACS 70um image strongly resembles the similar angular resolution Spitzer 24um MIPS image Fainter outer region— forward shock A bright warm dust rim-- reverse shock Longer wavelength-- Knots, lanes of diffuse Interstellar(IS) dust, morphology closely matches molecular lines
 PACS 70um image strongly resembles the similar angular resolution Spitzer 24um MIPS image Fainter outer region— forward shock A bright warm dust rim-- reverse shock Longer wavelength-- Knots, lanes of diffuse Interstellar(IS) dust, morphology closely matches molecular lines")
7
Resemblistic analysis (SED part) Emission component decomposition – nonthermal – warm dust – The cold interstellar – cool Cas A dust
 Emission component decomposition – nonthermal – warm dust – The cold interstellar – cool Cas A dust")
8
Nonthermal component Resemble: VLA 6 cm & IRAC 3.6um Convolving to 6’’ Correspond very closely – Indicating that both are dominated by by the nonthermal emission Mean spectral index: – -0.70+/_0.05 (other ref: Dunne et al. 2003)
.")
9
Warm dust Resemble: 24 um & 70 um – Pointing to a common emitting warm dust component – Peaking in bright rim /reverse shock – More emission from interior in 70 um image Originated from 3*10 -3 M sun of 82 K magnesium protosilicate (Hines et al. 2004)
.")
10
Cold component 70um(Cold dust): – I 70um -n*I 24um (Normalised the 24 um image to the surface brightness levels in the outer parts of Cas A in 70 um image and subtracted it) ?? – Total “warm dust” contribution at 70um is 120+/_6 Jy Longer wavelengh (Cold dust): – Warm dust-Subtracted images from 100 um
: – Warm dust-Subtracted images from 100 um.")
11
Cold Interstellar Component Resemble-_-!!!: 160/350/500um – > indicating that they are emitted by the same cold IS dust particles. – determined average 100/160 and 70/160um flux ratios for several bright regions located outside the remnant. – Then applied these ratios to the 160umimage and subtracted them from 70um and 100um images – In order to determine Cold dust contribution at 160 um, subtracted a scaled image of the cool component at 70 m(where the ISM and line contamination is smallest) from the 160-m map iteratively, until its visible imprint was minimized.
 from the 160-m map iteratively, until its visible imprint was minimized..")
12
Total and individual component flux densities (in Jy) for Cas A
 for Cas A")
13
70-850um SED of the components

14
The mass of cool dust in Cas A The cold dust can be fitted by ~0.075 M sun of ~35K silicate dust. Other studies: – Sibthorpe et al. derived a 33-K cool dust mass of 0.055 M – Nozawa et al. (2010) modelled the Hines et al. (2004) 8- 100um SED of Cas A with 0.008M sun of shock-heated warm dust and 0.072M sun of unshocked cool dust in the remnant’s interior. (dust formation model for the Cas A ejecta predicted 0.17 M of new dust, from which they suggested that 0.09 M had already been destroyed by the reverse shock)
 modelled the Hines et al. (2004) um SED of Cas A with 0.008M sun of shock-heated warm dust and 0.072M sun of unshocked cool dust in the remnant’s interior. (dust formation model for the Cas A ejecta predicted 0.17 M of new dust, from which they suggested that 0.09 M had already been destroyed by the reverse shock).")
15
A conclusion image

16
Thanks

17
Jacobus Kapteyn Telescope Nik Szymanek (of the amateur UK Deep Sky CCD imaging team of Nik Szymanek and Ian King) in summer 1997
 in summer 1997")
18
William Herschel Telescope Nik Szymanek

19
Lagoon nebula (M8), Triffid Nebula (M20) and the Jacobus Kapteyn and Isaac Newton Telescopes Nik Szymanek
, Triffid Nebula (M20) and the Jacobus Kapteyn and Isaac Newton Telescopes Nik Szymanek")
20
he Dutch Open Telescope (DOT) and the Nordic Optical Telescope (NOT) Nik Szymanek
 and the Nordic Optical Telescope (NOT) Nik Szymanek")
21
Dunne et al.2003 Nature M = S D^2/k B (n, T) where S is the flux density measured at frequency n, D is the distance, and k is the dust mass absorption coefficient. The value B is the Planck function, and T is the dust temperature. (S ∝ Bv^beta)
.")
Similar presentations
, Kartik Sheth (Caltech/SSC),>")

 May 23, 2013.>")
, K.S. Long (STScI), K. Borkowski & S.P. Reynolds (NCSU) Summary:>")
 & G350.1-0.3 in X-rays Anant Tanna Physics IV 2007 Supervisor: Prof. Bryan Gaensler.>")


; Kate Su, George Rieke, John Stansberry,>")
 Collaborators:>")
 & Neal. J. Evans II (Univ.>")
; IRAC.>")


 Prof. Dr. C. Waelkens (KUL) Academic year 2014-2015.>")
 IC 10 Antennae.>")
 2013/10/24 〇 Contents of this talk - Introduction - Our ALMA proposals.>")
>")