Download presentation
Presentation is loading. Please wait.

1
General analysis of inbreeding
Self-fertilization and sibling mating most extreme forms of inbreeding, but matings between more distant relatives (e.g. cousins) has same effect on frequency of homozygotes, but rate is slower.
 has same effect on frequency of homozygotes, but rate is slower.")
2
General analysis of inbreeding
F = Coefficient of inbreeding: probability that two alleles in an individual are identical by descent (both alleles are copies of a particular ancestor’s allele in some previous generation). F increases as relatedness increases.
. F increases as relatedness increases.")
3
Figure 7. 29 Identity by descent
Figure 7.29 Identity by descent. Identity by descent is illustrated in a pedigree representing a mating between two full cousins. Each of the two full cousins has received an identical copy of the A1 allele from their grandfather. Each passes this allele on to the daughter at the bottom of the figure. She therefore has two copies of the A1 allele that are identical by descent.

4
General analysis of inbreeding
If we compare heterozygosity of inbred population Hf with that of a random mating population Ho relationship is Hf = Ho (1-F) Anytime F>0 frequency of heterozygotes is reduced and frequency of homozygotes naturally increases.
 Anytime F>0 frequency of heterozygotes is reduced and frequency of homozygotes naturally increases.")
5
General analysis of inbreeding
Calculating F. Need to use pedigree diagrams. Example: Female is daughter of two half-siblings. Two ways female could receive alleles that are identical by descent.

6
Half-sibling mating Male Female Male Male Female Fig 6.27a

7
Fig 6.27b

8
General analysis of inbreeding
Total probability of scenario is 1/16 + 1/16 = 1/8.

9
Inbreeding depression
Inbreeding increases frequency of homozygotes and thus the probability that deleterious alleles are visible to selection. In humans, children of first cousins have higher mortality rates than children of unrelated individuals.

10
Fig 6.28 Each dot on graph represents mortality rates for a human
population. Mortality rate for children of cousins consistently about 4% higher than rate for children of non-relatives. Fig 6.28

11
Inbreeding effects on high blood pressure
In a study of 2760 individuals from 25 Croatian islands Rudan et al. found a strong positive relationship between high blood pressure and the inbreeding coefficent.

12
Figure 7. 32 Inbreeding and high blood pressure
Figure 7.32 Inbreeding and high blood pressure. Rudan and his colleagues measured the relationship between the inbreeding coefficient F and high blood pressure (hypertension) from 2760 individuals on Croatian islands in the Adriatic Sea. Individuals with higher inbreeding coefficients were more likely to suffer from hypertension. Adapted from Rudan et al. (2003).
 from 2760 individuals on Croatian islands in the Adriatic Sea. Individuals with higher inbreeding coefficients were more likely to suffer from hypertension. Adapted from Rudan et al. (2003).")
13
Inbreeding depression
Inbreeding depression also documented in studies of wild animals. E.g. Great Tit. Two studies show that survival of inbred nestlings is lower than that of outbred individuals and that hatching success of inbred eggs is lower than that of outbred eggs.

14
Fig. 6.30

15
Migration Migration: movement of alleles between populations.
Migration can cause allele and genotype frequencies to deviate from Hardy-Weinberg equilibrium.

16
Migration Consider Continent-Island migration model.
Migration from island to continent will have no effect of continental allele frequencies. Continental population much larger than island. However continent to island migration can greatly alter allele frequencies.

17
Empirical example of migration’s effects
Lake Erie water snakes. Snakes range in appearance from unbanded to strongly banded. Banding caused by single locus: banded allele dominant over unbanded.

18
Lake Erie water snakes Mainland: almost all snakes banded.
Islands many snakes unbanded. Unbanded snakes have selective advantage: better camouflage on limestone rocks. Camouflage very valuable when snake is young.

19
Fig 6.6

20
Lake Erie water snakes If selection favors unbanded snakes on islands why aren’t all snakes unbanded? Migration introduces alleles for banding.

21
Fig 6.7 A unbanded, B+C some banding, D strongly banded

22
Lake Erie water snakes Migration of snakes from mainland makes island populations more like mainland. This is general effect of migration: Homogenizes populations (making them resemble each other).
.")
23
Genetic Drift Genetic drift results from the influence of chance. When population size is small, chance events more likely to have a strong effect. Sampling errors are very likely when small samples are taken from populations.

24
Genetic Drift Assume gene pool where frequency A1 = 0.6, A2 = 0.4.
Produce 10 zygotes by drawing from pool of alleles. Repeat multiple times to generate distribution of expected allele frequencies in next generation.

25
Fig 6.11

26
Genetic Drift Allele frequencies much more likely to change than stay the same. If same experiment repeated but number of zygotes increased to 250 the frequency of A1 settles close to expected 0.6.

27
6.12c

28
Empirical examples of sampling error: Founder Effect
Founder Effect: when population founded by only a few individuals allele frequencies likely to differ from that of source population. Only a subset of alleles likely to be represented and rare alleles may be over-represented.

29
Founder effect in Silvereye populations.
Silvereyes colonized South Island of New Zealand from Tasmania in 1830. Later spread to other islands.

31
6.13b

32
Founder effect in Silvereyes
Analysis of microsatellite DNA from populations shows Founder effect on populations. Progressive decline in allele diversity from one population to the next in sequence of colonizations.

33
Fig 6.13 c

34
Founder effect in Silvereyes
Norfolk island Silvereye population has only 60% of allelic diversity of Tasmanian population.

35
Founder effect in human populations
Founder effect common in isolated human populations. E.g. Pingelapese people of Eastern Caroline Islands are descendants of 20 survivors of a typhoon and famine that occurred around 1775.

36
Founder effect in human populations
One survivor was heterozygous carrier of a recessive loss of function allele of CNGB3 gene. Codes for protein in cone cells of retina. 4 generations after typhoon homozygotes for allele began to be born.

37
Founder effect in human populations
Homozygotes have achromotopsia (complete color blindness, extreme light sensitivity, and poor visual acuity). Achromotopsia rare in most populations (<1 in 20,000 people). Among the 3,000 Pingelapese frequency is 1 in 20.
. Achromotopsia rare in most populations (<1 in 20,000 people). Among the 3,000 Pingelapese frequency is 1 in 20.")
38
Founder effect in human populations
High frequency of allele for achromotopsia not due to a selective advantage, just a result of chance. Founder effect followed by further genetic drift resulted in current high frequency.

39
Effects of genetic drift over time
Effects of genetic drift can be very strong when compounded over many generations. Simulations of drift. Change in allele frequencies over 100 generations. Initial frequencies A1 = 0.6, A2 = Simulation run for different population sizes.

40
6.15A

41
6.15B

42
6.15C

43
Conclusions from simulations
Populations follow unique paths Genetic drift has strongest effects on small populations. Given enough time even in large populations genetic drift can have an effect. Genetic drift leads to fixation or loss of alleles, which increases homozygosity and reduces heterozygosity.

44
6.15D

45
6.15E

46
6.15F

47
Conclusions from simulations
Genetic drift produces steady decline in heterozygosity. Frequency of heterozygotes highest at intermediate allele frequencies. As one allele drifts to fixation number of heterozygotes inevitably declines.

48
Wright-Fisher model The Hardy-Weinberg model provides an idealized picture of how allele frequencies and genotype frequencies are expected to change over time in a large population. The Wright-Fisher model is a similar model but applies to small populations.

49
Wright-Fisher model The W-F model retains the assumptions of the H-W model except for population size and in the model only a small sample of gametes are drawn at random from the gene pool. The small sample drawn mimics the effects of drift because allele frequencies in the sample can differ a lot from the starting gene pool.

50
Loss of heterozygosity over time
We know that genetic drift leads to a loss of heterozygosity over time. Alleles going to fixation naturally reduce the diversity of alleles in the population and without allelic diversity heterozygosity must decline.

51
Loss of heterozygosity over time
In a Wright-Fisher population expected heterozygosity declines on average by a factor of 1/2N per generation, where N is population size. When N is large 1/2N is very small so we expect heterozygosity to decline slowly. Conversely, with a small population 1/2N is large and heterozygosity will decline quickly as a result of drift.

52
Why does heterozygosity decline by 1/2N per generation?
Recall that F = Coefficient of inbreeding: probability that two alleles in an individual are identical by descent (both alleles are copies of a particular ancestor’s allele in some previous generation).
.")
53
Why does heterozygosity decline by 1/2N per generation?
Also recall that two alleles can be identical in their genetic sequence (e.g. both A1), but if they did not come from the same shared ancestor they are not considered identical by descent.
, but if they did not come from the same shared ancestor they are not considered identical by descent.")
54
Why does heterozygosity decline by 1/2N per generation?
Consider a gamete pool to which all parents contribute equally and from which offspring are produced by drawing two gametes at random. With a population of N parents each contributing 2 alleles there is a total pool of 2N alleles.

55
Figure 8.6 A gamete-pool approach to calculating how F changes over time in a population. With probability 1/2N, both gene copies in an offspring derive from the same gene copy in a parent, and thus they are identical by descent with probability 1. With probability 1 − 1/2N, the gene copies in an offspring derive from two different gene copies in the parent, and thus they are identical by descent with the same probability as were gene copies in the parental generation.

56
Why does heterozygosity decline by 1/2N per generation?
Under these circumstances the probability of an offspring having two alleles derived from the same parental copy is 1/2N. {Note the probability is not 1/2N * 1/2N because the first allele can be any allele and there is then a 1/2N chance it is the same as that first one}

57
Why does heterozygosity decline by 1/2N per generation?
The parental generation had a level of heterozygosity that we call Hparental. Thus the offspring generations heterozygosity is Hoffspring = [1 – 1/2N] * Hparental See box 8.2 for derivation

58
Empirical studies on allele fixation and heterozygosity
Buri (1956) established 107 Drosophila populations. All founders were heterozygotes for an eye-color gene called brown. Neither allele gives selective advantage. Initial genotype bw75/bw Initial frequency of bw75 = 0.5
 established 107 Drosophila populations. All founders were heterozygotes for an eye-color gene called brown. Neither allele gives selective advantage. Initial genotype bw75/bw. Initial frequency of bw75 = 0.5.")
59
Buri (1956) study Followed populations for 19 generations.
Population size kept at 16 individuals. What do we predict will occur in terms of allele fixation and heterozygosity?

60
Buri (1956) study In each population expect one of the two alleles to drift to fixation. Expect heterozygosity to decline in populations as allele fixation approaches.

61
Buri (1956) study Distribution of frequencies of bw75 allele became increasingly U-shaped over time. By end of experiment, bw75 allele fixed in 28 populations and lost from 30.

62
Fig 6.16

64
Buri (1956) study Frequency of heterozygotes declined steadily over course of experiment. Declined faster than expected because effective population size was smaller than initial size of 16 (effective refers to number of actual breeders; some flies died, some did not get to mate).
.")
65
Fig 6.17

66
Effective population size
Effective population size refers to the number of breeders in a population. In many cases population size and effective population size may be quite different if most individuals don’t breed, if a few individuals produce most of the offspring or if there is a strongly biased sex ratio.

67
Allele fixation in natural populations
Templeton et al. (1990) Studied Collared Lizards in Ozarks of Missouri Desert species occurs on remnant pieces of desert-like habitat called glades.
 Studied Collared Lizards in Ozarks of Missouri. Desert species occurs on remnant pieces of desert-like habitat called glades.")
68
Templeton et al. (1990) Human fire suppression has resulted in loss of glade habitat and loss of crossable savannah habitat between glades. Areas between glades overgrown with trees.

69
Templeton et al. (1990) Based on small population sizes and isolation of collared lizard populations Templeton et al. (1990) predicted strong effect of genetic drift on population genetics. Expected low genetic diversity within populations, but high diversity between populations.
 predicted strong effect of genetic drift on population genetics. Expected low genetic diversity within populations, but high diversity between populations.")
70
Templeton et al. (1990) Found expected pattern. Genotype fixation common within populations and different genotypes were fixed in different populations. Lack of genetic diversity leaves populations vulnerable to extinction. Found >66% of glades contained no lizards.

71
Templeton et al. (1990) What conservation measures could be taken to assist Collared Lizard populations?
 What conservation measures could be taken to assist Collared Lizard populations.")
72
Templeton et al. (1990) Repopulate glades by introducing lizards.
Burn oak-hickory forest between glades to allow migration between glades.

73
Population bottlenecks
Another way in which populations may be exposed to the effects of drift is if the population experiences a bottleneck. A bottleneck occurs when a population is reduced to a few individuals and subsequently expands. Even though the population is large it may not be genetically diverse as few alleles passed through the bottleneck.

74
Figure 8. 21 The population bottleneck concept
Figure 8.21 The population bottleneck concept. In the original population, there are three different alleles, represented here by blue, black, and yellow balls. A bottleneck cuts population size dramatically, leading to shifts in allele frequency simply by chance. Compare the frequency of black and blue balls before and after the bottleneck. Bottlenecks can even result in the loss of certain alleles. The yellow allele is lost in this example.

75
Population bottlenecks
Simulation models show a bottleneck can dramatically affect population genetics. Next slide shows effects of a bottleneck on allele frequencies in 10 replicate populations.

76
Figure 8. 22 A bottleneck causes a drastic shift in allele frequency
Figure 8.22 A bottleneck causes a drastic shift in allele frequency. Here we see the results from simulations of 10 replicate populations, each with 1000 diploid individuals, going through a brief population bottleneck. Each population starts with the A1 and A2 alleles each at frequency 50%. One sample trajectory is highlighted for emphasis. Allele frequencies drift gradually until the population bottleneck, at which point the drift accelerates dramatically, causing large changes in allele frequency. As the populations are restored to their original sizes, the rate of allele frequency fluctuation slows.

77
Empirical example of a bottleneck-northern elephant seal
The northern elephant seal (which breeds on California and Baja California) was hunted almost to extinction in the 19th century. Only about individuals survived. Now there are more than 100,000 individuals.
 was hunted almost to extinction in the 19th century. Only about individuals survived. Now there are more than 100,000 individuals.")
78
Figure 8. 23 Bottlenecks in a natural population
Figure 8.23 Bottlenecks in a natural population. Male northern elephant seals at San Simeon, California.

79
Empirical example of a bottleneck-northern elephant seal
The northern elephant seal population should show evidence of the bottleneck. Two studies in the 1970’s and 1990’s that examined 62 different proteins for evidence of heterozygosity found zero variation. In contrast, similar studies of southern elephant seals show plenty of variation.

80
Figure 8.24 Low variation in northern elephant seals: enzyme electrophoresis data. No molecular variation is observed in any of the 62 northern elephant seal proteins surveyed by enzyme electrophoresis. By contrast, enzyme electrophoretic studies on southern elephant seals reveal significant molecular variation. Adapted from Hoelzel (1999).
..")
81
Empirical example of a bottleneck-northern elephant seals
More recent work that has used DNA sequencing has shown some variation in northern seals, but still much less than in southern elephant seals.

82
Figure 8.25 Low variation in northern elephant seals: DNA sequence data. DNA sequence studies at three different highly variable loci reveal much greater variation in southern elephant seal populations than in northern elephant seal populations. Adapted from Hoelzel et al. (1999b).
..")
83
Empirical example of a bottleneck-northern elephant seals
Examination of museum specimens collected before the bottleneck have shown much more variation in these specimens than in current populations, which shows that the population was much more genetically diverse before the bottleneck.

84
Small populations: inbreeding and drift
In small populations inbreeding may be unavoidable. Even with random mating, a small population that stays small and receives no immigrants will become inbred. Major problem for rare species such as California sea otters and northern elephant seals.

85
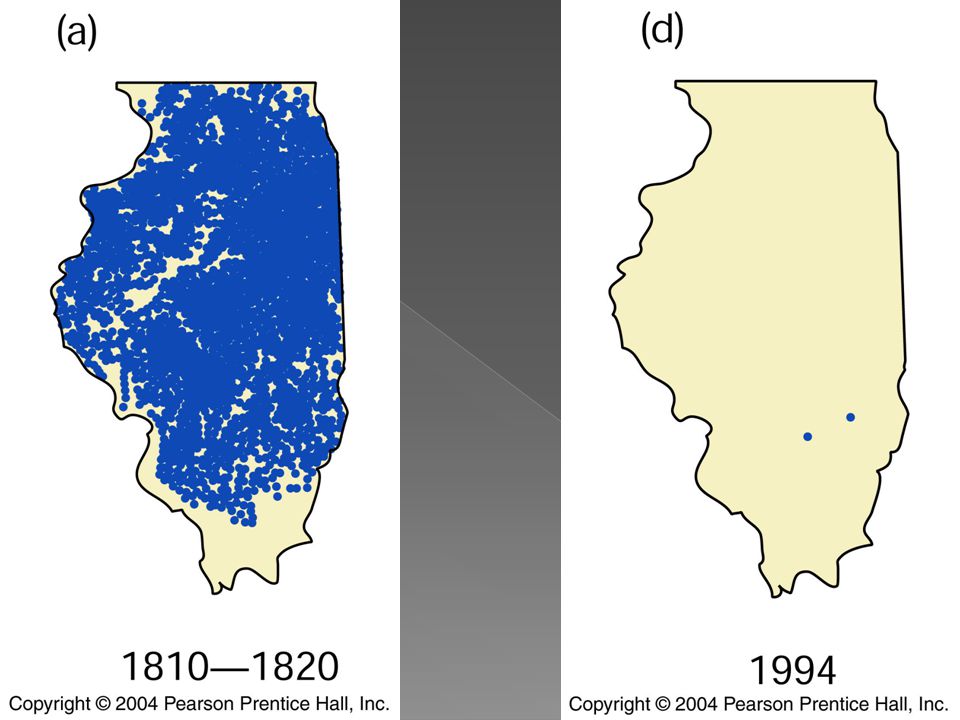
Population genetics and conservation of Prairie Chickens
Two hundred years ago Illinois covered with prairie and home to millions of Greater Prairie Chickens. Steel plough allowed farmers to farm the prairie. Acreage of prairie plummeted and so did Prairie Chicken numbers.

86
Lesser Prairie Chicken

88
Conservation of Prairie Chickens
In 1960’s habitat protection measures introduced and population increased until mid 1970’s. Then population collapsed. By 1994 <50 birds in two populations in Illinois.

89
Fig 6.3

90
Conservation of Prairie Chickens
Why did prairie chicken populations decline even though available habitat was increasing? Prairie destruction reduced numbers of birds and isolated the populations from each other.

91
Conservation of Prairie Chickens
No migration between populations. Small populations vulnerable to genetic drift and inbreeding depression. Accumulation of deleterious recessive alleles (genetic load) can lead to extinction of small populations.
 can lead to extinction of small populations.")
92
Conservation of Prairie Chickens
Problem exacerbated when exposure of deleterious mutations further reduces population size and increases effectiveness of drift. “Extinction vortex”. Prairie chickens showed clear evidence of inbreeding depression. Egg hatching rates had declined dramatically by 1990 < 40% hatch rate.

93
FIG 6.31

94
Conservation of Prairie Chickens
Illinois Prairie chicken populations showed less genetic diversity than other populations and less genetic diversity than they had in the past. Illinois birds 3.67 alleles per locus rather than alleles of other populations and 5.12 of Illinois museum specimens.

95
Conservation of Prairie Chickens
Conservation strategy?

96
Conservation of Prairie Chickens
In 1992 prairie chickens introduced from other populations to increase genetic diversity. Hatching rates increased to >90%. Population increased.

Similar presentations


A b)B c)both A and B d)neither A nor B Which of these populations are in Hardy- Weinberg.>")


