Download presentation
Presentation is loading. Please wait.

1
West Michigan Prosperity Alliance General Session October 10, 2014

2
Michigan State Senate Districts

3
Michigan State House Districts

15
September 26, 2013 125 Regional Representatives Attend Informational Meeting

16
Regional Transportation and Planning Economic Development Adult Education Higher Education Work Force Development Private Business/At Large Members West Michigan Prosperity Alliance 25 Grant Awarded January 2014

17
Steering Committee At Large/ Private Business Workforce Development Economic Development Adult Education Higher Education Regional Transportation and Planning John Weiss - GVMC Dave Bee - WMRPC Erin Kuhn - WMSRDC Steve Bulthuis - MACC Paul Griffith - Michigan Works! West Central Deb Groeneveld - Michigan Works Muskegon-Oceana Jacob Maas - Kent-Allegan Michigan Works! Mike O’Connor - Adult Edu. of Zeeland P.S. Kathleen Sullivan - Adult Learning Partners of West Michigan Doug Wood - Orchard View Schools Adult Education Bruce Adair - Lakeshore Advantage Valarie Byrnes - Barry County Economic Dev. Ed Garner - Muskegon Area First Rick Chapla -The Right Place Fiona Hert - GRCC Lynda Matson - WSCC Dan Rinsema- Sybenga - MCC Simone Jonaitis - GVSU Linda Brand - Model Community Initiative Jim Fisher - Padnos Roger Safford - MDOT Andy Johnston - West Michigan Chamber Coalition Jim Sandy - Mecosta County Dev. Corp. Bill Raymond - Ottawa County Michigan Works! Kevin Stotts -Talent 2025

18
Regional Prosperity Plan Steering Committee Plan Implementation Continued Regional Cooperation Community Conversations

19
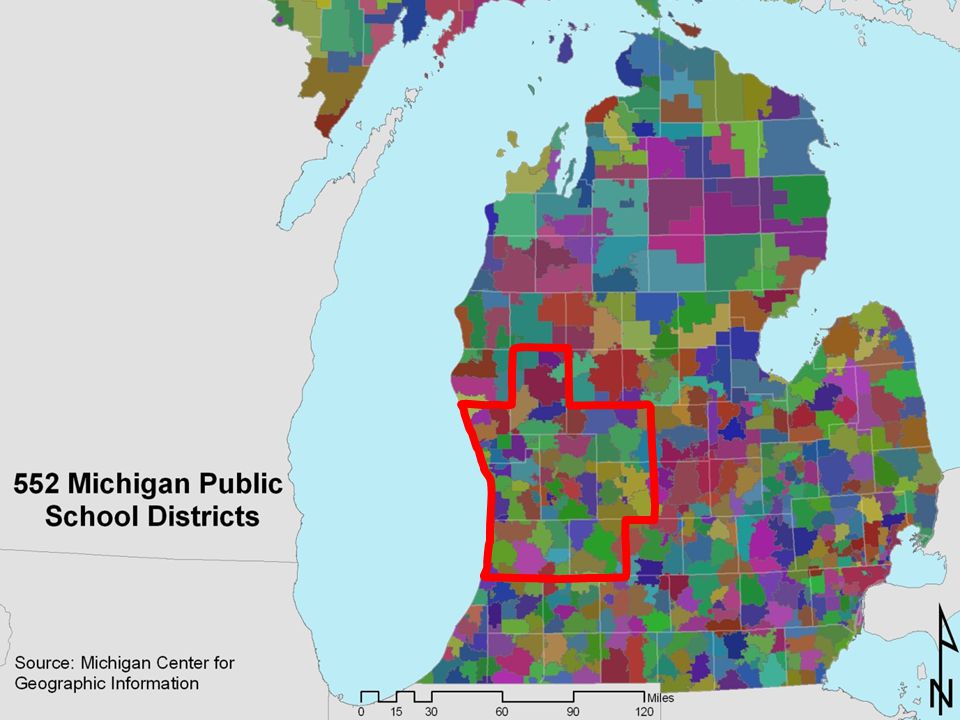
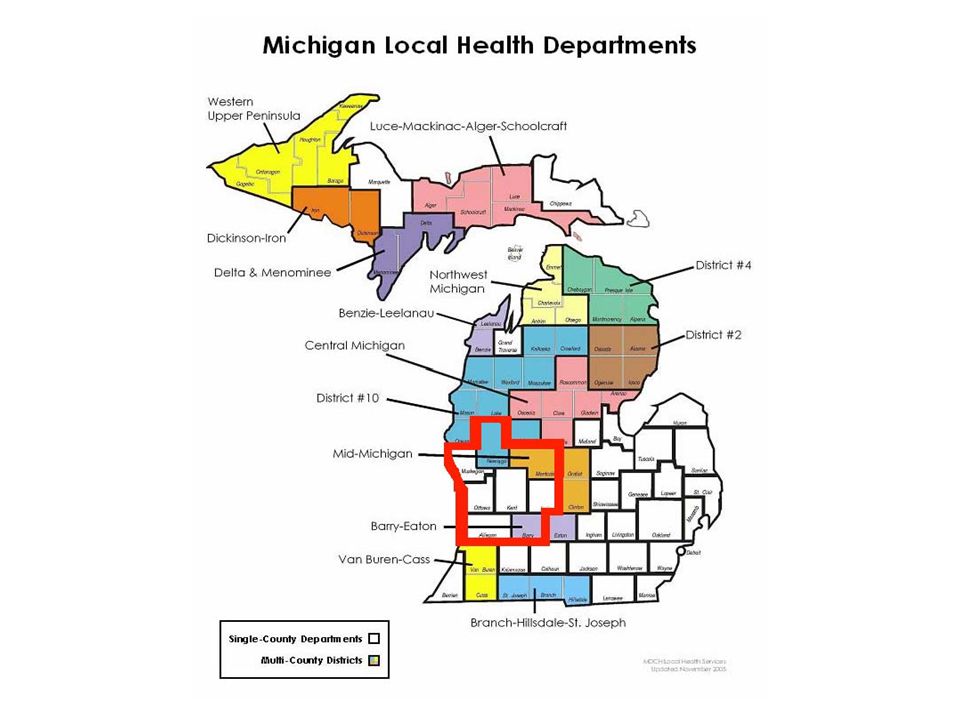
Some Simple Statistics About Our Region 13 Counties 341 Units of Government 1,532,851 people (15.5% of Michigan) 757,540 Labor Force (+1.5% since 2009) 7.4% Unemployment Rate ( 4.7 % since 09) 8,163 square miles, about the same size as the State of New Jersey 130 Miles of Lake Michigan Shoreline and extends 75 miles to the heart of Michigan’s lower peninsula 10,000 employers,$5.7 billion in economic output
 757,540 Labor Force (+1.5% since 2009) 7.4% Unemployment Rate ( 4.7 % since 09) 8,163 square miles, about the same size as the State of New Jersey 130 Miles of Lake Michigan Shoreline and extends 75 miles to the heart of Michigan’s lower peninsula 10,000 employers,$5.7 billion in economic output")
20
Between 2000-2012 our population gained 86,575 or 6% while overall Michigan lost 55,500 residents. Over 90,000 people commute into our region for work and over 114,000 residents leave the region for their jobs. Employment has recovered from the Great Recession Between 2009 and 2012, payroll jobs in the West Michigan Prosperity Region grew by 50,025 or 8.6%percent, more than twice that of the 4.0%percent growth statewide 90+ school districts, 13 major colleges and universities, 70,000 college students

21
What are the Required Deliverables? A 5 Year Regional Prosperity Plan including and economic development blueprint A performance Dashboard and measurable annual goals. Monthly meetings to consider and discuss issues leading to a common vision of economic prosperity including economic development, talent and infrastructure.

22
Community Conversations Can We Agree and Prioritize 6 Projects of Significant Regional Economic Importance? Criteria Potential Projects Final Projects March June September

23
Community Conversation Governor’s Economic Summit March 17, 2014 180 Local and State Government Representatives and Business Leaders Project Criteria Long term impact and sustainability Regional Impact Provide employment opportunities Recognize Regional Strengths and challenges Promotes public/private partnerships

24
The West Michigan Prosperity Alliance The West Michigan Prosperity Alliance (WMPA) will solicit projects from across the region and from across interests. The WMPA will evaluate each project based on criteria established by the Alliance. Almost 3,000 solicitations for projects were distributed Thirty-one projects were nominated

25
AN UPDATE ON STATE AND LOCAL PROGRESS REGIONAL PROSPERITY Initiative

26
STATE PROGRESS REPORT Alignment of Regions by Departments Data Analysis by Regions Continued Discussion with the Federal Government RPI First Year Awards Budget and Next Steps

27
Aligned EDCs, RENs, CAT Teams, URC, SBTDCs, etc. Working to align PTACs and MACACA regional re- granting Required alignment of CDC funding priorities and RPI priorities this FY MEDC ALIGNMENT

28
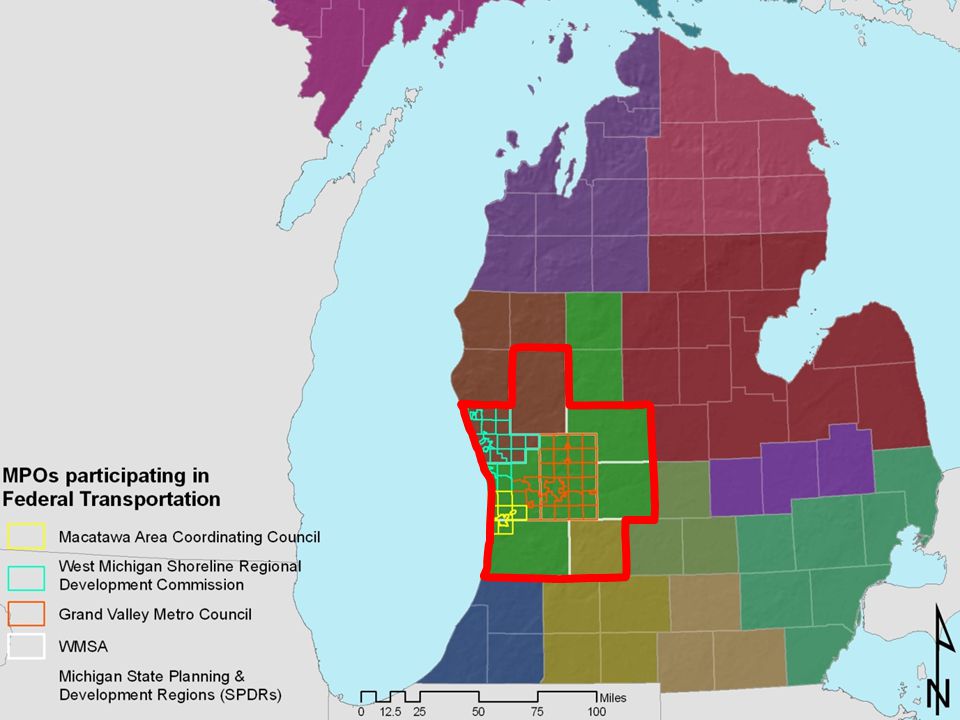
MDOT Alignment Alignment Work is Ongoing A boundary busters team has been formed Active participants in many of our RPI teams

29
MSHDA Alignment Aligned all MSHDA regions including Homeless Assistance and Community Development RegionsCommunity Development Regions Have assigned place making teams by region and are actively working to connect with RPI recipients

30
WDA Alignment Talent districts have been adopted by all! Reported data provided will be assessed along the Prosperity Regions All Mi Works Boards were eligible to participate in an RPI applications chose to participate in 1 or more

31
DTMB ALIGNMENT DTMB is providing regional data to help inform the RPI processregional data Other offices at DTMB are working to ensure that they can support the Regional Prosperity Initiative – Procurement – State Facilities – Technology

32
MDEQ Alignment MDEQ explicitly states on their website that they are part of the RPI initiative and has identified contacts for each RPI teamwebsite In addition, they have specifically realigned their brownfield redevelopment program map

33
MDNR Alignment Aligned DNR operations centers and include contact information by region herehere First state department to consider the importance of regional data analysis

34
MDARD Alignment Michigan Dept. of Ag. Rural Development MDARD has aligned ag development specialists and supplied regional contacts

35
DHS Alignment DHS recently announced their new Business Service Center Regional Map They are working toward a more regional approach by having stand out county directors coordinate regional strategies and work more closely with the department

36
Department of Education MDE’s regions have a number of complications including – ISD coverage – Funding model – Connection to other state service providers like Workforce Development The department is analyzing how they can proceed with alignment in a measured way – First step is MDE regional support staff

37
Military and Veterans Affairs Reconfigured regions for regional service officer distribution

38
Michigan State Police Has worked to align District Posts with Prosperity Regions – MSP Director was one of the most anxious directors to receive notice of RPI recipients and begin connecting her team with local leaders State police only have one additional region to align, emergency preparedness regions – These regions are connected closely to DCH regions and require interdepartmental work to move

39
MDOC Alignment FOA regions have aligned and contacts have been assigned Currently working through an RPI- RFP that will conform to the prosperity regions Recent benefit seen through greater connection to MEDC, WDA for employment outcomes

40
Outliers in the regional model A few departments have no existing service boundaries but have been asked to assign a point of contact for the RPI effort by region and to consider reporting data on a regional basis – Civil Rights (MDCR) – Treasury (MDT) – Departments of Insurance and Financial Strength (DIFS)
 – Treasury (MDT) – Departments of Insurance and Financial Strength (DIFS)")
41
DATA ANALYSIS BY REGIONS Power of data analysis by regions LMI and DNR were the first to begin such analysis Other departments have been directed to follow Other data sources to be considered as well – Gallup Well-Being

42
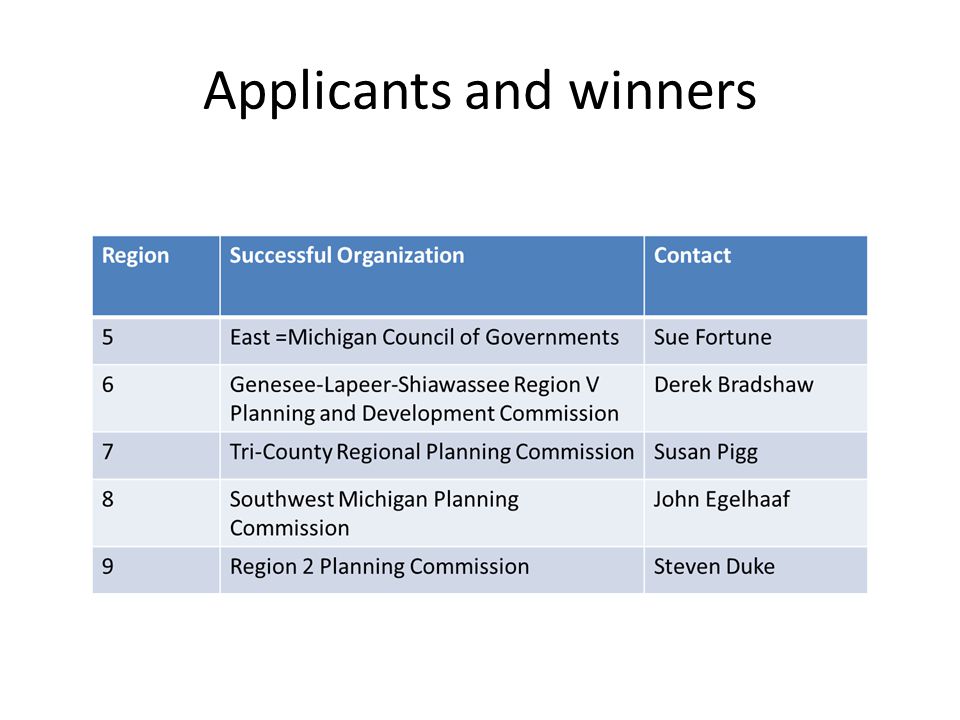
RPI Grants First Round-2013 – DTMB received 11 applications, all from eligible applicants – Funding requests exceeded available dollars, totaling more than $3m – Applications were reviewed by the award committee based on evaluation criteria made available to applicants prior to submission – 7 successful applicants Second Round-2013/2014 – Applicants who were not successful in the first round addressed specific concerns and were eligible to reapply in round two – All unsuccessful applicants reapplied – Again, funding exceeded available dollars by more than $300,000 – 4 applicants reapplied, all were successful at some level

43
Applicants and winners

45
Where we were January 2014

46
What a Difference in 9 Months

47
Governor Discusses RPI GVMC/RPI Board Meeting June 6, 2014 17 out of 20 State Agencies are Complete Regional Reinvention Task Force to Advance Governor’s Regional Prosperity Initiative

48
Review of Projects Project Criteria Long term impact and sustainability Regional Impact Provide employment opportunities Recognize Regional Strengths and challenges Promotes public/private partnerships

49
Next Steps Review and Prioritize the 6 Projects Insert the projects in the Prosperity Plan Steering approves Prosperity Plan Application for 2015 Continue to Promote Regional Cooperation and Collaboration while providing assistance to the 6 Regional Projects Expand the Steering Committee to Include Foundations and Non-Profits

50
West Michigan Prosperity Alliance General Session October 10, 2014

Similar presentations


 & Community-Based Transportation Planning (CBTP) Grant Programs California Department of Transportation District 3 January 25,>")


 Sustainability for Early Childhood Systems Building.>")


