Download presentation
Presentation is loading. Please wait.

1
URBAN GROWTH AND AEROSOL EFECTS ON CONVECTION OVER HOUSTON Gustavo G. Carrió, William R. Cotton, William Y. Cheng, and Steve M. Saleeby Colorado State University, Dept. of Atmospheric Science Fort Collins, Colorado

2
Houston is one of the fastest growing metropolitan areas in the United States during the past three decades.

3
Regional Atmospheric modeling system (RAMS@CSU) coupled to the Town Energy Budget (TEB) generalized canyon model We focused on a convective storm triggered by the sea breeze circulation (Aug 24 2001)
 generalized canyon model We focused on a convective storm triggered by the sea breeze circulation (Aug )")
4
RAMS@CSU microphysics Experimental design Simulation conditions Brief summary of results Overview

5
Cloud Droplet Nucleation Number nucleated obtained from lookup table as a function of CCN number concentration Vertical velocity Temperature kappa Lookup table generated previously (offline) from detailed parcel-bin model N c1 =N ccn N c2 =N gccn ; S w > 0.0
 from detailed parcel-bin model N c1 =N ccn N c2 =N gccn ; S w > 0.0")
6
Ice Crystal Nucleation Ice nucleation follows the approach described by Meyers et al. (1992): N i = N IN exp [12.96 (S i - 1)] T r si (supersaturation with respect to ice), and T r sl (supersaturation with respect to liquid). Secondary ice particle production model in RAMS is based on Mossop (1976). In MKS units, the formula is: where B increases linearly from 0 to 1 as ice temperature T increases from -8 C to -5 C, B decreases linearly from 1 to 0 as T increases from -5 C to -3 C, and B is zero at other ice temperatures. Ni is the number of ice particles produced per second, N24 is the number of cloud droplets larger than 24 m in diameter that are collected by ice each second, N 13 is the number of cloud droplets smaller than 13 m in diameter that are collected by ice each second.
: N i = N IN exp [12.96 (S i - 1)] T r si (supersaturation with respect to ice), and T r sl (supersaturation with respect to liquid). Secondary ice particle production model in RAMS is based on Mossop (1976). In MKS units, the formula is: where B increases linearly from 0 to 1 as ice temperature T increases from -8 C to -5 C, B decreases linearly from 1 to 0 as T increases from -5 C to -3 C, and B is zero at other ice temperatures. Ni is the number of ice particles produced per second, N24 is the number of cloud droplets larger than 24 m in diameter that are collected by ice each second, N 13 is the number of cloud droplets smaller than 13 m in diameter that are collected by ice each second..")
7
Features of RAMS bin- emulating microphysics Cloud droplets (1 st mode) and drizzle drops are independently nucleated by the activation of CCN and GCCN (prognostic variables) Collection is simulated using stochastic collection solutions using look-up tables. Sedimentation of hydrometeors uses bin-approach(allows size-sorting) This bin-emulating approach has been extended to all hydrometeor interactions, including sedimentation,auto- conversion, ice particle riming, and all interactions among 3 liquid modes. This bin-emulating approach has been extended to all hydrometeor interactions, including sedimentation, auto- conversion, ice particle riming, and all interactions among 3 liquid modes. Uses generalized gamma distribution basis functions :
 This bin-emulating approach has been extended to all hydrometeor interactions, including sedimentation,auto- conversion, ice particle riming, and all interactions among 3 liquid modes. This bin-emulating approach has been extended to all hydrometeor interactions, including sedimentation, auto- conversion, ice particle riming, and all interactions among 3 liquid modes. Uses generalized gamma distribution basis functions :.")
8
RAMS Liquid Hydrometeors

9
Simulation conditions Two-moment microphysics for 8 water species: Cloud and drizzle droplets, Rain, Pristine ice, Snow, Aggregates, Graupel, and Hail Initialized: August 24 00Z (~12h before convection started) Simulation time= 24h 3 two-way interactive nested grids: x1 =15.0km N x1 = 71 N z1 = 61 t=30s x2 =3.75km N x2 =102 N z2 =102 t=7.5s x3 =0.75km N x3 =202 N z3 =202 t=2.5s
 Simulation time= 24h 3 two-way interactive nested grids: x1 =15.0km N x1 = 71 N z1 = 61 t=30s x2 =3.75km N x2 =102 N z2 =102 t=7.5s x3 =0.75km N x3 =202 N z3 =202 t=2.5s")
10
Grid configuration

11
Experimental design

12
Some Results (city size) Cells covered a larger area for “larger cities” Updraft intensity did not show a regular behavior Although, downdrafts tended to be stronger
 Cells covered a larger area for larger cities Updraft intensity did not show a regular behavior Although, downdrafts tended to be stronger")
13
Some Results (city size) The intensity of the sea-breeze (~ SE) increased monotonically for larger urban areas. Kg m -2 s -1 (flux averaged over the 1 st km)
.")
14
Some Results (city size) Total precipitated volume Precip rates over Grid 3 1992 2001 2006
 Total precipitated volume Precip rates over Grid 3 ")
15
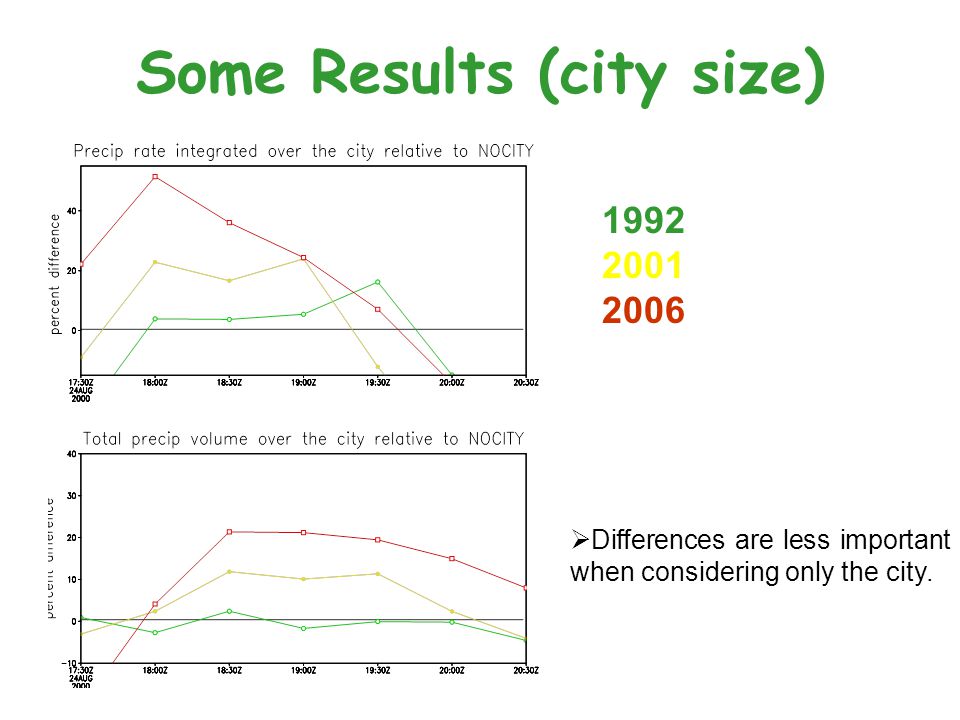
Some Results (city size) Differences are less important when considering only the city. 1992 2001 2006
16
Some Results (city size) Small relative differences in LWC for the period of intense convection (~18:30Z) Much larger differences in total in-cloud mass (larger area) 1992 2001 (grid 3) 2006
 Small relative differences in LWC for the period of intense convection (~18:30Z) Much larger differences in total in-cloud mass (larger area) (grid 3) 2006")
17
Some Results (aerosols) Differences are really small less than 1% for both domain and the city, although positive for the first. [CCN] city = 1500cm -3 [CCN] city = 2000cm -3 [CCN] clean city = 300cm -3

18
Some Results (aerosols) Positive differences in LWC maxima for the period of intense convection (~18:30Z) 4% and 9% for supercooled water between -10 and -20°C (~4-8km) [CCN] city = 1500cm -3 [CCN] city = 2000cm -3 [CCN] clean city = 300cm -3
![Some Results (aerosols) Positive differences in LWC maxima for the period of intense convection (~18:30Z) 4% and 9% for supercooled water between -10 and -20°C (~4-8km) [CCN] city = 1500cm -3 [CCN] city = 2000cm -3 [CCN] clean city = 300cm -3](http://images.slideplayer.com/14/4416640/slides/slide_18.jpg "Some Results (aerosols) Positive differences in LWC maxima for the period of intense convection (~18:30Z) 4% and 9% for supercooled water between -10 and -20°C (~4-8km) [CCN] city = 1500cm -3 [CCN] city = 2000cm -3 [CCN] clean city = 300cm -3")
19
Results Summary Considering “larger cities” : Higher precip. rates (finest grid). The NO CITY run exhibits a maximum much later. Conversely, the precip. rates and accumulated values over urban cells did not show any regular behavior. Total volume of precipitation (finest grid) increased monotonically 9, 11, and 30% (over NOCITY) for 1992, 2001, and 2006, respectively. LWPs and maximum updrafts did not change significantly but they tended to be cover larger areas. Conversely, maximum downdrafts and the integral value of condensate slightly increased (larger area).
. The NO CITY run exhibits a maximum much later. Conversely, the precip. rates and accumulated values over urban cells did not show any regular behavior. Total volume of precipitation (finest grid) increased monotonically 9, 11, and 30% (over NOCITY) for 1992, 2001, and 2006, respectively. LWPs and maximum updrafts did not change significantly but they tended to be cover larger areas. Conversely, maximum downdrafts and the integral value of condensate slightly increased (larger area)..")
20
Results Summary Considering “more polluted cities” : Positive differences in LWC maxima for the period of intense convection (~18:30Z) 4% and 9% for supercooled water between -10 and -20°C (~4-8km) Differences in integrated precip volume are really small for both domain and the city, although positive for the entire grid 3. Maximum IWPs also increased when considering more intense sources over the city

21
Pollution plume

22
Cell out of plume Cell in plume

23
Location of cells to examine in further detail

24
New sensitivity runs Vary both the strength of the aerosol pollution and the convective instability, using the August 24 2000 case study as a benchmark. We used an identical configuration with 3 two- way interactive nested grids: x1 =15.0km N x1 = 71 N z1 = 61 t=30s x2 =3.75km N x2 =102 N z2 =102 t=7.5s x3 =0.75km N x3 =202 N z3 =202 t=2.5s Initialized: August 24 2001 00Z (~12h before storm started) Simulation time= 24h
 Simulation time= 24h.")
25
Experimental design over 100 runs CAPE (Jkg -1 ) CCN [cm -3 ] City source * BackgroundGulf 600 700 800 900 1000 1100 1200 1300 1400 Aug24 ± 100,200,300, 400 Jkg -1 clean(0) 500 1000 1500 2000 2500 3000 3500 4000 500200 * Values multiplied by the sub-grid urban fraction are nudged at the first model level.
![Experimental design over 100 runs CAPE (Jkg -1 ) CCN [cm -3 ] City source * BackgroundGulf Aug24 ± 100,200,300, 400 Jkg -1 clean(0) * Values multiplied by the sub-grid urban fraction are nudged at the first model level.](http://images.slideplayer.com/14/4416640/slides/slide_25.jpg "Experimental design over 100 runs CAPE (Jkg -1 ) CCN [cm -3 ] City source * BackgroundGulf Aug24 ± 100,200,300, 400 Jkg -1 clean(0) * Values multiplied by the sub-grid urban fraction are nudged at the first model level.")
26
Model vs. observations The model and the configuration used for these sensitivity experiments was validated in the previous study. Simulated precip rates and spatial patterns compared well to radar-derived data.

27
Comparisons among runs Quantity to be compared Each graph point represents an individual simulation. The blue arrow denotes runs with no urban sources. The green arrow denotes runs using the atmospheric conditions of the case study.

28
Maximum updraft altitude Difference respect to clean city [m] For all runs, the peak updrafts were attained at higher attitudes (respect to clean city). It takes higher [CCN] for more unstable environments. As expected, the largest impact corresponds to low instability runs.
![Maximum updraft altitude Difference respect to clean city [m] For all runs, the peak updrafts were attained at higher attitudes (respect to clean city).](http://images.slideplayer.com/14/4416640/slides/slide_28.jpg " It takes higher [CCN] for more unstable environments. As expected, the largest impact corresponds to low instability runs..")
29
Total precipitated volume Difference with respect to clean city [%] Differences in the downwind integral volume are very small (2% max). However,
![Total precipitated volume Difference with respect to clean city [%] Differences in the downwind integral volume are very small (2% max).](http://images.slideplayer.com/14/4416640/slides/slide_29.jpg " However,.")
30
Maximum accumulated precip [mm] Differences up to 12% in downwind accumulated maxima. For each level of instability, when [CCN] ↑, the maximum accum. precip downwind first increases, and then decreases. The “optimal” [CCN] is higher for runs with higher instability.
![Maximum accumulated precip [mm] Differences up to 12% in downwind accumulated maxima.](http://images.slideplayer.com/14/4416640/slides/slide_30.jpg " For each level of instability, when [CCN] ↑, the maximum accum. precip downwind first increases, and then decreases. The optimal [CCN] is higher for runs with higher instability..")
31
SC integral mass [10 7 x kg] The initial increase in the precipitation is clearly linked to a greater amount of SC water. When further enhancing [CCN], SC water mass does not vary much, therefore, another mechanism is suppressing precipitation.
![SC integral mass [10 7 x kg] The initial increase in the precipitation is clearly linked to a greater amount of SC water.](http://images.slideplayer.com/14/4416640/slides/slide_31.jpg " When further enhancing [CCN], SC water mass does not vary much, therefore, another mechanism is suppressing precipitation..")
32
Precipitation efficiency [%] Ratio between the total precipitated volume and the overall vapor flux (at cloud base levels). Left of the curve is linked to a greater amounts of SC water. Again, the “optimal” [CCN] is higher for run with higher instability. This decrease beyond that point is independent on the intensity of the convection.
![Precipitation efficiency [%] Ratio between the total precipitated volume and the overall vapor flux (at cloud base levels).](http://images.slideplayer.com/14/4416640/slides/slide_32.jpg " Left of the curve is linked to a greater amounts of SC water. Again, the optimal [CCN] is higher for run with higher instability. This decrease beyond that point is independent on the intensity of the convection..")
33
SC droplet concentrations [# /cc] Precip accumulations are highest when SC cloud droplet concentration are between 14 and 240/cc (~4-5 m ). Smaller SC droplet are less efficient to form large precip. Particles.
![SC droplet concentrations [# /cc] Precip accumulations are highest when SC cloud droplet concentration are between 14 and 240/cc (~4-5 m ).](http://images.slideplayer.com/14/4416640/slides/slide_33.jpg " Smaller SC droplet are less efficient to form large precip. Particles..")
34
Conclusions Pollution can significantly intensify downwind convective cells (+12% in max accumulations), however the effect on integral precipitation values is less important. In agreement with previous studies, [CCN] ↑ reduce the size of the droplets and the collision efficiencies increasing the amount of SC liquid content and enhancing latent heat release. But, the effect of pollution is not monotonic. Further enhancing [CCN] generates smaller SC droplets less efficient to form large precipitation particles, and more likely to be transported aloft as pristine ice crystals. For a given level of pollution, precipitation is more likely to be enhanced in events characterized by higher instability.

Similar presentations


 Wendi Kaufeld.>")

