Download presentation
Presentation is loading. Please wait.

1
The myth of ‘potential’ Jacob Burke Natural Resources Department FAO AGRICULTURAL WATER MANAGEMENT IN AFRICA

4
Evolution of irrigation and water managed areas in Africa Full/partial control (1) Spate irrigation (2) Equipped lowlands (3) Non-equipped cultivated wetland and inland valley bottoms (4) Non-equipped flood recession (5) Year 2004 13.44 million ha 15.41 million ha Year 1994 12.17 million ha 14.23 million ha 11 477 819 ha (81%) 516 830 ha (4%) 179 624 ha (1%) 1 016 171 ha (7%) 1 037 288 ha (7%) 12 478 592 ha (80%) 411 370 ha (3%) 554 913 ha (4%) 1 001 557 ha (7%) 959 158 ha (6%) Irrigation = (1)+(2)+(3) Water management = (1)+(2)+(3)+(4)+(5) The Africa Aquastat Survey 2005
 Spate irrigation (2) Equipped lowlands (3) Non-equipped cultivated wetland and inland valley bottoms (4) Non-equipped flood recession (5) Year million ha million ha Year million ha million ha ha (81%) ha (4%) ha (1%) ha (7%) ha (7%) ha (80%) ha (3%) ha (4%) ha (7%) ha (6%) Irrigation = (1)+(2)+(3) Water management = (1)+(2)+(3)+(4)+(5) The Africa Aquastat Survey 2005")
5
Annual increase in areas under irrigation 1992-2000 Rate of annual increase (%) Northern Africa0.67 Sub-Saharan Africa1.17 Africa0.88 CAADP annual increase proposal: 1.3% for large irrigation 3.5% for small-scale irrigation Yet, only 30% of area under irrigation had a growth rate of more than 1.3% per year between 1992 and 2000. Only 9% of the area grew at 3.5% per year.

6
The Food Import Bills AFRICA Mean1970-2004 1970-19791980-19891990-19992000-2004MeanMin.Max.Var. (%) Per Cap. Cons.(Cal/Day)21922286236524262302244244 Imp. Cal.(Cal/Day) 37260561670055575324 Imp. Dep. Ratio (% Cal Basis) 12191820172123 Imp. Dep. Ratio (% Val Basis) 46676820 Gross Food Imp. Bill (US$m) 49581233015175176201179320891043 Comm. Food Imp. Bill (US$m) 46231113514191167501094919922044 Value Food Aid (US$m) 33611959858718431557049 Comm. Unit Cost (US$/1000 cals) 0.871.110.990.840.971.4922 Comm. Food Import Bill/GDP(%) 1.52.12.2 2.02.618.418 Comm. Fd. Imp./Merch. Imp.(%) 11.713.112.711.012.314.29.910 Comm. Fd. Imp./Merch. Exp.(%) 10.913.113.310.712.215.414.815 Agric. Exp. Earnings (US$m) 8,75611,71514,35714,82512,06917,346027 Agric Net Trade (US$m) 3109-2240-4126-5869-176942530-199 Trade Weight Imp. Unit Val (US$) 34145841432839354321 Trade Weight Exp. Unit Val (US$) 11881634142112621392219929 Real Comm. Food Imp. Bill (US$m) 5137935112663159261003316912039 Real Agric. Exp. Earnings (US$m) 10858943111246132951090914085015 Real Agric. Imp. Bill (US$m) 69281196015767202421279321504037 Real Trade Weight Imp. Unit Val (US$) 41638437131237946811 Real Trade Weight Exp. Unit Val (US$) 13691377126712101319192915
 Per Cap. Cons.(Cal/Day) Imp. Cal.(Cal/Day) Imp. Dep. Ratio (% Cal Basis) Imp. Dep. Ratio (% Val Basis) Gross Food Imp. Bill (US$m) Comm. Food Imp. Bill (US$m) Value Food Aid (US$m) Comm. Unit Cost (US$/1000 cals) Comm. Food Import Bill/GDP(%) Comm. Fd. Imp./Merch. Imp.(%) Comm. Fd. Imp./Merch. Exp.(%) Agric. Exp. Earnings (US$m) 8,75611,71514,35714,82512,06917, Agric Net Trade (US$m) Trade Weight Imp. Unit Val (US$) Trade Weight Exp. Unit Val (US$) Real Comm. Food Imp. Bill (US$m) Real Agric. Exp. Earnings (US$m) Real Agric. Imp. Bill (US$m) Real Trade Weight Imp. Unit Val (US$) Real Trade Weight Exp. Unit Val (US$)")
7
Africa food import and trade trends 1970-2004

10
THANK YOU

Similar presentations
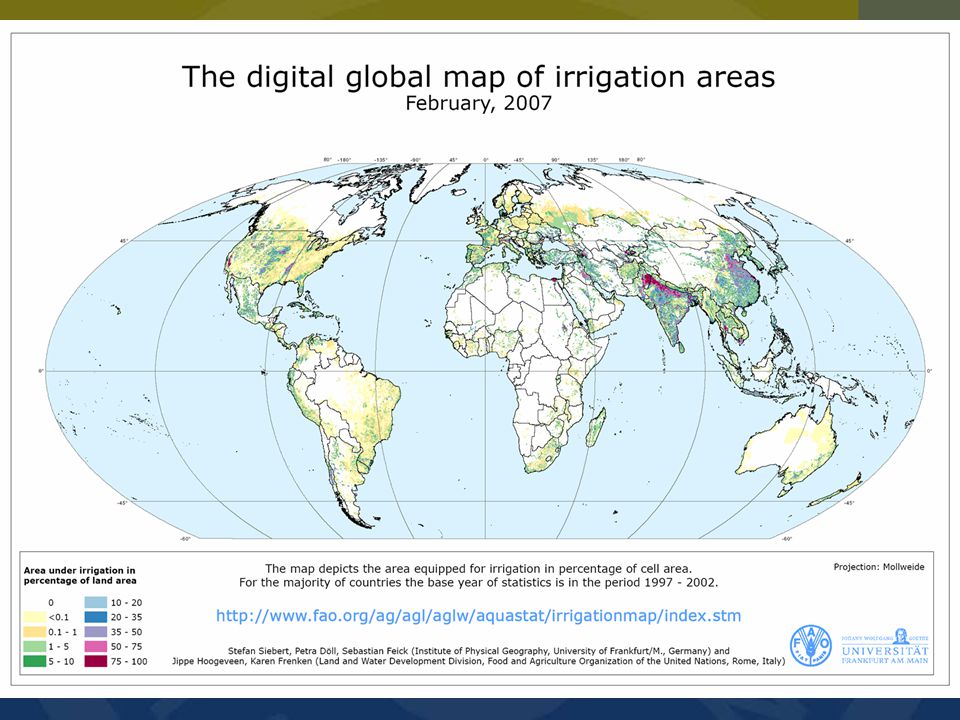


 Photo : Wikipedia.>")


