Download presentation
Presentation is loading. Please wait.

1
Children’s Health Needs in Greater Nottingham Analysis of needs, resources and services for planning

3
All Children and their parents Maternity Children who are ill Safeguarding Children and young people with emotional health needs

4
Nottingham’s 4 PCTs Wards Super Output Areas

6
Rank Lower SOAs from most to least deprived Divide into 5 groups, equal number of Output areas in each group Quintiles

7
Calculate rates based on events in each quintile Source: ODPM Directly standardised rates of admission to hospital for accidents, under 20s, 2001-2003 0 10 20 30 40 50 60 70 80 City 1 City 2 City 3 City 4City 5 DSR per thousand pop

8
Deprivation Index of Material Deprivation 2000 & 2004 Income Employment Health and disability Education, skills and training Barriers to Housing & Services Living environment Crime

9
3 Most deprived Wards in each PCT: City: Strelley, Manvers, Radford B&H: Toton, Strelley & Trowell, Stapleford West Gedling: Oxclose, Newstead, Killisick Rushcliffe: Ash Lea, Musters, Leys Source: DETR Deprivation

10
Demography Source: 2001 Census

11
Where are our services?

12
Immunisation

13
Children who are ill and Children in hospital A&E attendance Admissions Gastroenteritis

14
A&E Attendances Source: Nottingham HIS

15
Admissions

16
Gastroenteritis Directly standardised rates of admission to hospital for Intestinal Infectious Diseases, under 5s, 2001-2003 0.0 5.0 10.0 15.0 20.0 25.0 30.0 Nottingham City PCTRushcliffe PCTBroxtowe & Hucknall PCT Gedling PCT DSR per thousand pop

17
Long term conditions Asthma Cystic fibrosis Cancers

18
Asthma Admissions

19
Cystic Fibrosis Admissions Directly standardised rates of admission to hospital for cystic fibrosis, under 20s, 2001-2003 0.0 0.2 0.4 0.6 0.8 1.0 1.2 1.4 Nottingham City PCTRushcliffe PCTBroxtowe & Hucknall PCT Gedling PCT DSR per thousand pop

20
Cancer Admissions Directly standardised rates of admission to hospital for cancer, under 20s, 2001-2003 0.0 2.0 4.0 6.0 8.0 10.0 12.0 14.0 16.0 18.0 20.0 Nottingham City PCTRushcliffe PCTBroxtowe & Hucknall PCT Gedling PCT DSRs per thousand pop

21
Safeguarding and Promoting the Welfare of Children Accidents - PSA target Young Offenders Carers

22
Accident Admissions Under 5

23
Young Offenders

24
Young Carers

25
The Mental Health & Psychological Well-being of Children and Young People Numbers Causes of need Suicide

26
CAMHS numbers seen

27
Causes of need Breakdown of the Problems Presented 34% 17% 14% 7% 6% 5% 3% 2% 1% Emotional disorders More than one primary problem Conduct disorders Deliberate self harm Autistic spectrum disorders Other Hyperkinetic disorders Developmental disorders Eating disorders Substance abuse Habit disorders Psychotic disorders Source: National CAMHS Mapping Exercise 2003

28
Suicide

29
Maternity Teenage pregnancy – PSA target Low Birth Weight

30
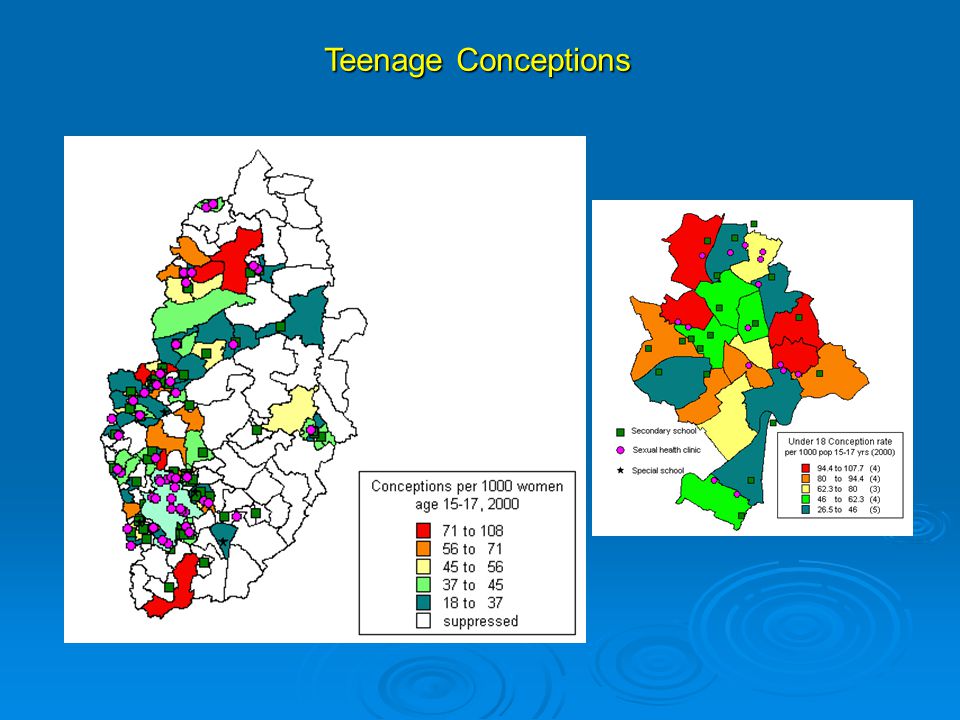
Teenage Conceptions

32
Low Birth Weight % of live births weighing less than 2500g 0 2 4 6 8 10 12 ENGLAND AND Trent SHANottingham UA Ashfield CDBroxtowe CD Gedling CDRushcliffe CD

33
The future Use these maps to plan, appropriately according to need Develop the maps Financial map ? Match the need Knowledge is power

Similar presentations


 in Berkshire Community Partnership Forum February 2014 Sally Murray Head of Children’s Commissioning.>")
 Officer 14 October 2014.>")


