Download presentation
Presentation is loading. Please wait.

1
Pesticides in Nursery Runoff: Sources and Transport Processes Jay Gan Dept. Environmental Sciences UC Riverside, CA 92521 jgan@mail.ucr.edu 909-787-2712

2
Outline Nursery and pesticides Current issues How does it happen? Governing Processes

3
Nursery in CA (2001) Production sales: $3.17 billion 10.6% of CA agricultural output 2 nd among all CA agricultural products 21.3% of the U.S. nursery/floriculture total (11.9% for FL) Retail sales $10.1 billion 1 st in the U.S. CA horticulture industry jobs 81,011 jobs in production 87,856 jobs in retailing
 Retail sales $10.1 billion 1 st in the U.S. CA horticulture industry jobs 81,011 jobs in production 87,856 jobs in retailing.")
4
CA Nursery Industry Total CA Nursery/Floral Production: $3.2 billion (2001) Woody, decidous Evergreen 26% Bedding plants 15% Non- Ornamentals 19% Potted plants Flowering foliage 20% Misc. 8% Floral 12%

5
CA Nursery Industry Total CA Retail Sales: $10.1 billion (2001) Hardware Home centers $3,576 mil Garden centers Farms Nurseries $2,859 mil Chain stores Warehouses $2,757 mil Florists $988 mil
 Hardware Home centers $3,576 mil Garden centers Farms Nurseries $2,859 mil Chain stores Warehouses $2,757 mil Florists $988 mil")
6
CA Nursery Industry Total Sales Composition (2001) Lawn furniture Accessories Tree trim 20.8% Chemicals Fertilizers 24.8% Green goods 26.0% Equipment Tools 28.4%
 Lawn furniture Accessories Tree trim 20.8% Chemicals Fertilizers 24.8% Green goods 26.0% Equipment Tools 28.4%")
7
CA’s Top 10 Nursery, Flower and Foliage Producing Counties CountyProduction (mil)Share of state San Diego85527 Ventura2237.4 Orange2196.9 Monterey1795.6 Los Angeles1725.4 Santa Clara1504.7 Riverside1384.4 San Mateo1374.3 Santa Barbara1314.1 Kern1143.6 Total2,31973.45%
Share of state San Diego85527 Ventura Orange Monterey Los Angeles Santa Clara Riverside San Mateo Santa Barbara Kern Total2, %")
8
Nurseries & Pesticides Pesticide Uses Agricultural crops Agricultural crops Home lawns/gardens Home lawns/gardens Structural/indoor pest control Structural/indoor pest control Nurseries Nurseries Roadside Roadside Parks Parks

9
Pesticide Use in California by Sectors (million lbs)
")
10
Trend of Pesticide Use Total Active Ingredients (mil lbs)
")
11
Top Ten in California

12
Use Trend of “Reproductive Toxic” Pesticides in CA

13
Reproductive Toxic Products

14
Use Trend of Carcinogenic Pesticides in CA

15
Carcinogenic Pesticides

16
Use Trend of Cholinesterase Inhibiting Pesticides in CA

17
Cholinesterase-Inhibiting Pesticides

18
Use Trend of Groundwater-Risk Pesticides in CA

19
Groundwater-risk Pesticides

20
Surface water-Risk Pesticides Not human safety concern ! Aquatic toxicity: Organophosphate insecticides Organophosphate insecticides (e.g., Dusban, diazinon) Carbamate insecticides Carbamate insecticides (e.g., carbaryl) Synthetic pyrethroids Synthetic pyrethroids (e.g., cyfluthrin, permethrin, …) Mayfly Procloeon Midge Chironomus
 Carbamate insecticides Carbamate insecticides (e.g., carbaryl) Synthetic pyrethroids Synthetic pyrethroids (e.g., cyfluthrin, permethrin, …) Mayfly Procloeon Midge Chironomus.")
21
Most Used Nursery Pesticides (San Diego County, 2002) Greenhouse Containers ChemicalAmount (lb) Acephate759 Chlorpyrifos252 Daminozide864 Diazinon402 Fosetyl-Al634 Glyphosate964 Iprodione468 Malathion361 Mancozeb562 Methyl bromide1476 Potash soap1425 Petroleum products1449 Thiophanate-methyl2202 Source: CDPR
 Greenhouse Containers ChemicalAmount (lb) Acephate759 Chlorpyrifos252 Daminozide864 Diazinon402 Fosetyl-Al634 Glyphosate964 Iprodione468 Malathion361 Mancozeb562 Methyl bromide1476 Potash soap1425 Petroleum products1449 Thiophanate-methyl2202 Source: CDPR")
22
Most Used Nursery Pesticides (San Diego County, 2002) Outdoor Containers ChemicalAmount (lb) Acephate1405 Chlorothalonil1539 Chlorpyrifos379 Daminozide1240 Diazinon226 Fosetyl-Al1202 Glyphosate9730 Iprodione676 Malathion1361 Mancozeb1459 Methyl bromide1546 Potash soap1298 Petroleum products6724 Thiophanate-methyl2163 Source: CDPR
 Outdoor Containers ChemicalAmount (lb) Acephate1405 Chlorothalonil1539 Chlorpyrifos379 Daminozide1240 Diazinon226 Fosetyl-Al1202 Glyphosate9730 Iprodione676 Malathion1361 Mancozeb1459 Methyl bromide1546 Potash soap1298 Petroleum products6724 Thiophanate-methyl2163 Source: CDPR")
23
Aquatic Toxic Insecticides (San Diego County, 2002) Greenhouse Containers ChemicalAmount (lb) Bifenthrin18 Chlorpyrifos252 Cyfluthrin12 Diazinon402 Fenpropathrin23 Malathion361 Methiocarb112 Permethrin119 Source: CDPR
 Greenhouse Containers ChemicalAmount (lb) Bifenthrin18 Chlorpyrifos252 Cyfluthrin12 Diazinon402 Fenpropathrin23 Malathion361 Methiocarb112 Permethrin119 Source: CDPR")
24
Aquatic Toxic Insecticides (San Diego County, 2002) Outdoor Containers ChemicalAmount (lb) Bifenthrin60 Carbaryl199 Chlorpyrifos380 Cyfluthrin35 Deltamethrin12 Diazinon226 Fenpropathrin87 Malathion1365 Methiocarb22 Permethrin217 Source: CDPR
 Outdoor Containers ChemicalAmount (lb) Bifenthrin60 Carbaryl199 Chlorpyrifos380 Cyfluthrin35 Deltamethrin12 Diazinon226 Fenpropathrin87 Malathion1365 Methiocarb22 Permethrin217 Source: CDPR")
25
Water Quality Issues Ground water issues Surface water issues TMDLs TMDLs TMDL examples TMDL examples

26
Groundwater Issues The CA Picture (CDPR, CWRCB) 324 of 3,165 wells in year 2000 324 of 3,165 wells in year 2000 84 verified detections 84 verified detections From previous use (fumigants) From previous use (fumigants) DBCP, EDB, 1,2-D DBCP, EDB, 1,2-D From existing use (herbicides): From existing use (herbicides): Simazine, ACET (from simazine or atrazine), DACT, norflurazon, bromacil, diuron, atrazine, deethyl atrazineSimazine, ACET (from simazine or atrazine), DACT, norflurazon, bromacil, diuron, atrazine, deethyl atrazine
 324 of 3,165 wells in year of 3,165 wells in year verified detections 84 verified detections From previous use (fumigants) From previous use (fumigants) DBCP, EDB, 1,2-D DBCP, EDB, 1,2-D From existing use (herbicides): From existing use (herbicides): Simazine, ACET (from simazine or atrazine), DACT, norflurazon, bromacil, diuron, atrazine, deethyl atrazineSimazine, ACET (from simazine or atrazine), DACT, norflurazon, bromacil, diuron, atrazine, deethyl atrazine")
27
Distribution of Verified Detections

28
Surface Water Quality Issues Urban surface water quality issues Pesticide detections in most streams Pesticide detections in most streams 99% streams with 1 pesticide99% streams with 1 pesticide 70% streams with 5 pesticides70% streams with 5 pesticides Sustained insecticide levels Sustained insecticide levels Harmful to aquatic organisms Harmful to aquatic organisms Beneficial useBeneficial use TMDLs for many streams TMDLs for many streams The new rule!The new rule!

29
What is TMDL? CWA 303(d) CWA 303(d) States to make list of “impaired” waters States to make list of “impaired” waters Develop TMDLs for the listed waters Develop TMDLs for the listed waters TMDLs to account for all pollutants and all sources, TMDLs to account for all pollutants and all sources, TMDL includes non-point sources, e.g., urban and agricultural runoffs TMDL includes non-point sources, e.g., urban and agricultural runoffs Develop implementation plans (Basin Plans or Water Quality Control Plans in CA) Develop implementation plans (Basin Plans or Water Quality Control Plans in CA)
 CWA 303(d) States to make list of impaired waters States to make list of impaired waters Develop TMDLs for the listed waters Develop TMDLs for the listed waters TMDLs to account for all pollutants and all sources, TMDLs to account for all pollutants and all sources, TMDL includes non-point sources, e.g., urban and agricultural runoffs TMDL includes non-point sources, e.g., urban and agricultural runoffs Develop implementation plans (Basin Plans or Water Quality Control Plans in CA) Develop implementation plans (Basin Plans or Water Quality Control Plans in CA).")
30
California: RWQCBs RWQCBs 800 TMDLs in total 800 TMDLs in total 120 TMDLs in progress 120 TMDLs in progress Amend the Basin Plan by incorporating TMDLs Amend the Basin Plan by incorporating TMDLs TMDL Elements: Problem statement Problem statement Numeric targets Numeric targets Source analysis Source analysis Allocations Allocations Implementation plan Implementation plan Linkage analysis Linkage analysis Monitoring/Re-evaluation Monitoring/Re-evaluation Margin of safety Margin of safety

31
High priority TMDLs in CA PollutantTotal% Pesticides12518 Metals/trace elements11817 Sediment11416.4 Other organics9513.7 Nutrients679.6 Caliform/pathogens456.5 Ammonia223.2 Other10813.6 Total694100

32
High priority pesticide TMDLs in CA PesticideTotal DDT76 Chlordane15 Diazinon9 Chlorpyrifos6 Endosulfan9 Unspecified10 Total125

33
San Diego Creek Pesticide TMDLs

34
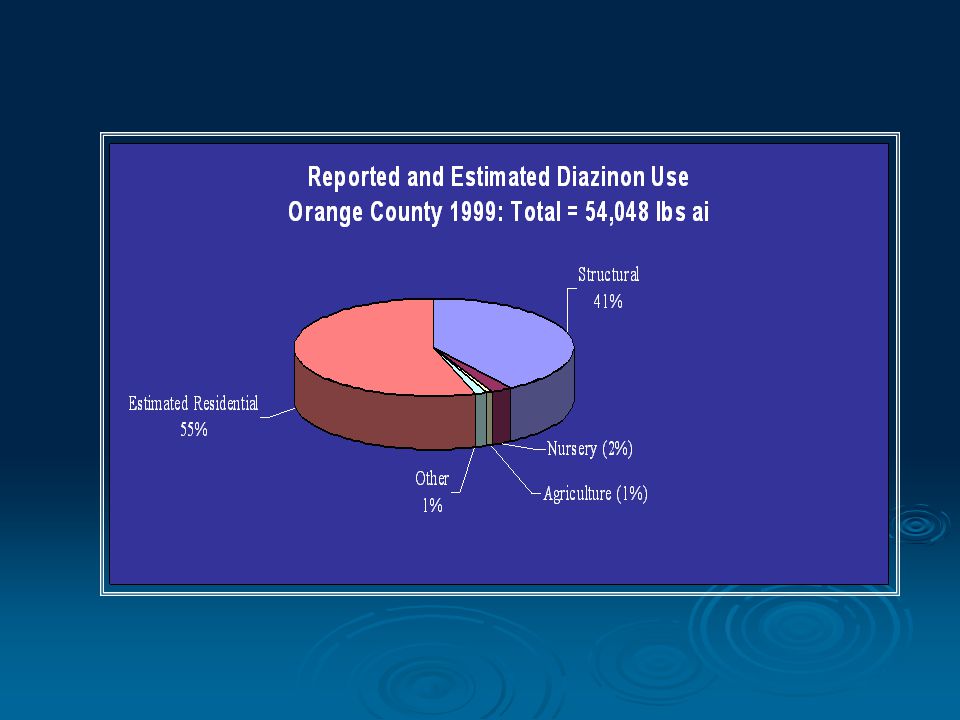
Diazinon: 200-455 ppt 50 ppt 200-455 ppt 50 ppt 300-900% reduction! 300-900% reduction! Chlorpyrifos : 87-111 ppt 14 ppt 87-111 ppt 14 ppt 600-800% reduction! 600-800% reduction! Legacy pesticides: DDT, chlordane,… DDT, chlordane,… Urban use is the No.1 source! San Diego Creek Pesticide TMDLs

35
Table 1. Proposed Water-Quality Criteria for Diazinon and Chlorpyrifos Acute (ppt) Chronic (ppt) Ceriodaphnia LC 50 Diazinon8050450 Chlorpyrifos201480
 Chronic (ppt) Ceriodaphnia LC 50 Diazinon Chlorpyrifos")
37
How Does It Happen? Storm water runoff Irrigation runoff Leaching through containers? Leaching through containers? Planting media spills? Planting media spills? Runoff + planting media Runoff + planting media = pesticide runoff?

38
Irrigation

39
Nursery Runoff Runoff!

40
Runoff Driven: Storm runoff Over-irrigation

41
Planting Media

42
Step 1: Scrap off surface soil Step 2: Estimate potting mix content Step 3: Analyze pesticides Step 4: Correlation

43
Sample Concentration (µg/kg) Potting mix † Bifenthrincis-Permethrintrans-Permethrin 1 3,971 373 4,625 1,194 53 13 80% 2 306 4 658 240 70 2 20% 3 344 17 1,556 322 178 94 5% 4 109 13 471 396 18 5 1% 5 163 18 521 96 58 6 <1% 6 275 81 5,948 6511,478 43 50% 7 307 55 71 124 243 28 10% 8 17,440 436 631 831 642 1,085 100% 9 163 123 290 138 17 9 5% 10 125 6 113 101 23 9 1% 11 2,470 451 1,697 369 0 0 100% 12 389 17 387 137 24 2 1% 13 1,309 24 753 201 21 9 20% 14 852 19 1,535 506 16 2 15% 15 430 33 455 89 18 3 1% 16 3,055 211 5,115 1,669 80 139 50% 17 353 26 1,613 765 163 12 80% 18 95 7 238 21 27 3 1% 19 303 10 587 184 48 5 20% 20 305 25 178 39 35 1 1%
 Potting mix † Bifenthrincis-Permethrintrans-Permethrin 1 3,971 373 4,625 1, 13 80% 2 20% 17 1,556 94 5% 5 1% 6 <1% 81 5,948 6511,478 43 50% 28 10% 8 17,440 1, % 9 5% 9 1% 11 2,470 451 1,697 0 100% 2 1% 13 1,309 9 20% 19 1,535 2 15% 3 1% 16 3,055 211 5,115 1, % 26 1,613 12 80% 3 1% 5 20% 1 1%")
44
Pesticides in Spilled Potting Mix

45
Loose Potting Mix

46
Governing Processes Degradation Chemical Chemical Microbial Microbial Adsorption Leaching Potential Runoff Potential

47
Transport after application

48
Degradation in Soil What is “degradation”? Structural changes caused by chemical and/or microbial reactions Structural changes caused by chemical and/or microbial reactions Desirable environmentally Desirable environmentally Pesticide-dependent Pesticide-dependent Vary in different soil types Vary in different soil types Measured by persistence or “half-life” T 1/2 Measured by persistence or “half-life” T 1/2 Long “half-life” = problems Long “half-life” = problems T 1/2 = leaching potential T 1/2 = leaching potential T 1/2 = runoff potential T 1/2 = runoff potential

49
Pesticide degradation in soil T 1/2

50
What Causes Degradation? Chemical reactions Hydrolysis (OPs, carbamates, etc.) – pH sensitive Hydrolysis (OPs, carbamates, etc.) – pH sensitive Photolysis – by UV, near the surface Photolysis – by UV, near the surface Oxidation – reduction by soil chemical species Oxidation – reduction by soil chemical species Nucleophilic attacks by soil nucleophiles Nucleophilic attacks by soil nucleophiles Pesticide dependent Pesticide dependent Soil dependent Soil dependent
 – pH sensitive Hydrolysis (OPs, carbamates, etc.) – pH sensitive Photolysis – by UV, near the surface Photolysis – by UV, near the surface Oxidation – reduction by soil chemical species Oxidation – reduction by soil chemical species Nucleophilic attacks by soil nucleophiles Nucleophilic attacks by soil nucleophiles Pesticide dependent Pesticide dependent Soil dependent Soil dependent.")
51
What Causes Degradation? Microbial transformations Biodegradation – bacteria use pesticides as “food” Biodegradation – bacteria use pesticides as “food” Cometabolism –degradation by “accident” Cometabolism –degradation by “accident” Enzyme-based transformations Enzyme-based transformations Pesticide dependent Pesticide dependent Soil dependent Soil dependent Microbial ecologyMicrobial ecology Organic matter plays a big roleOrganic matter plays a big role

52
Persistence Risk

53
Adsorption in Soil What is “adsorption”? Retention of pesticides by soil Retention of pesticides by soil Pesticide dependent Pesticide dependent Soil dependent Soil dependent Organic matter content , adsorption Organic matter content , adsorption Weak adsorption + long persistence worst for ground water Weak adsorption + long persistence worst for ground water Adsorption = runoff in water Adsorption = runoff in water Adsorption = runoff with soil Adsorption = runoff with soil

54
Adsorption Coefficient K d Adsorbed concentration / dissolved concentration Adsorbed concentration / dissolved concentration K d = C s / C w K d = strong adsorption K d = strong adsorption K oc K oc = K d / OC (%) K oc = K d / OC (%) Adsorption is proportional to soil OC% Adsorption is proportional to soil OC% K oc < 100, weakly adsorbing K oc < 100, weakly adsorbing K oc > 1000, strongly adsorbing K oc > 1000, strongly adsorbing
 K oc = K d / OC (%) Adsorption is proportional to soil OC% Adsorption is proportional to soil OC% K oc < 100, weakly adsorbing K oc < 100, weakly adsorbing K oc > 1000, strongly adsorbing K oc > 1000, strongly adsorbing")
55
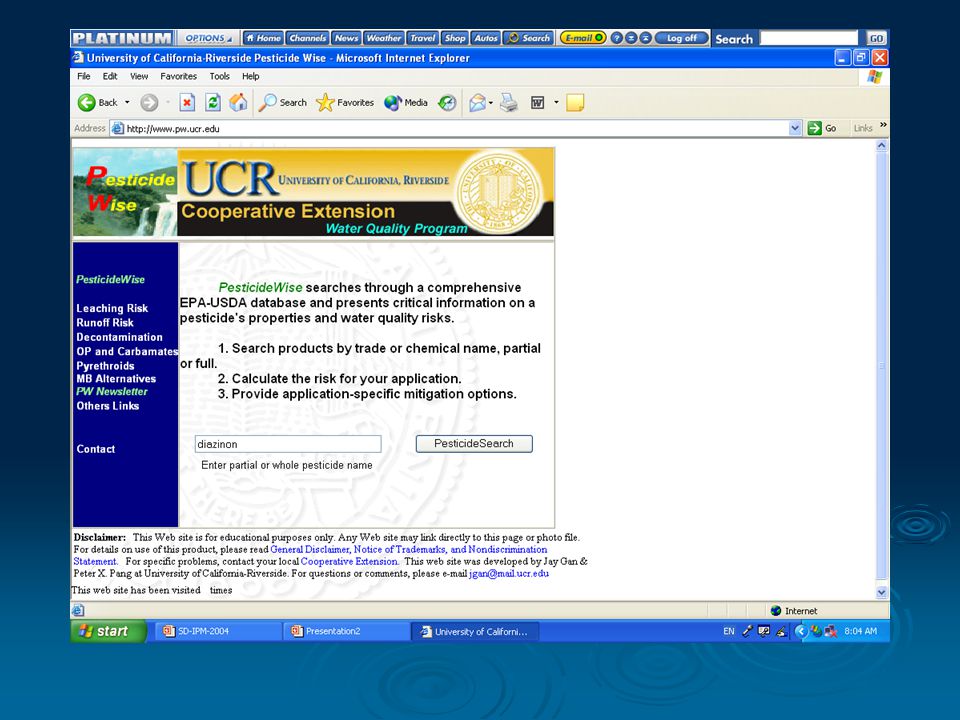
PesticideWise Searchable Webpages www.pw.ucr.edu

60
Leaching Potential What is leaching? Ability of pesticides to move through soil to reach groundwater Ability of pesticides to move through soil to reach groundwater High leaching potential Weak adsorption Weak adsorption Long persistence Long persistence Shallow groundwater table Shallow groundwater table Active water movement Active water movement Sandy texture Sandy texture

61
Leaching and Adsorption Retardation factor: Reflect difficulty in moving with water Reflect difficulty in moving with water As R increases, rate of movement decreases As R increases, rate of movement decreases As K d increases, rate of movement quickly decreases As K d increases, rate of movement quickly decreases

62
GUS Index “GUS” Groundwater Ubiquity Score Groundwater Ubiquity Score GUS = log(T 1/2 ) * (4 – log(K oc )) Leaching risk Gus > 2.8: high leaching risk Gus > 2.8: high leaching risk Gus < 1.8: low leaching risk Gus < 1.8: low leaching risk 1.8 < GUS < 2.8: intermediate leaching risk 1.8 < GUS < 2.8: intermediate leaching risk
 * (4 – log(K oc )) Leaching risk Gus > 2.8: high leaching risk Gus > 2.8: high leaching risk Gus < 1.8: low leaching risk Gus < 1.8: low leaching risk 1.8 < GUS < 2.8: intermediate leaching risk 1.8 < GUS < 2.8: intermediate leaching risk")
63
Groundwater-risk Pesticides

64
Runoff Potential Move in water Diazinon, chlorpyrifos, many herbicides Diazinon, chlorpyrifos, many herbicides Move with loose soil particles synthetic pyrethroids synthetic pyrethroids Water flow DOC-

65
Runoff Long persistence + weak adsorption high runoff potential Long persistence + strong adsorption intermediate runoff potential Short persistence + weak adsorption Transient Short persistence + strong adsorption Harmless

66
Contact Info: Jay Gan Dept. Environmental Sciences UC Riverside, CA 92521 jgan@mail.ucr.edu (909) 787-2712
")
67
California Department of Food & Agriculture California Department of Pesticide Regulation California SWRCB Santa Ana RWQCB El Modeno Gardens Nursery FMC Inc.

Similar presentations


 of the Clean Water Act requires states to develop lists of impaired waters, those that do.>")


