Download presentation
Presentation is loading. Please wait.

1
Fighting the Great Challenges in Large-scale Environmental Modelling I. Dimov n Great challenges in environmental modelling n Impact of climatic changes on pollution levels n Scenarios for climatic changes n Impact of climate changes on European pollution levels n Conclusions

2
Scientific Cooperation n ACET, Reading (V. Alexandrov, I. Dimov); n Bulgarian Academy of Sciences – IPP, Sofia (Tz. Ostromsky, K. Georgiev, E. Atanassov); n National Environmental Research Institute, Roskilde, Denmark (Z. Zlatev, G. Geernaert, Jorgen Brandt). Great challenges for the modellers
; n Bulgarian Academy of Sciences – IPP, Sofia (Tz. Ostromsky, K. Georgiev, E. Atanassov); n National Environmental Research Institute, Roskilde, Denmark (Z. Zlatev, G. Geernaert, Jorgen Brandt). Great challenges for the modellers.")
3
Some of the major challenges n High resolution computations: lead to huge computational tasks n Taking into account all relevant factors: leads to long series of runs with different scenarios n Impact of climatic changes on high pollution levels: leads to long-term runs (again with many scenarios)
")
8
Climate changes in Europe n n There are many uncertainties related to the climate changes in the future (Houghton et al., 2001). n n It is nevertheless worthwhile to investigate the impact of possible climatic changes on the pollution levels. n n Three climatic scenarios have been introduced and used to study the impact of the predicted climatic changes in Europe on ozone pollution levels in Europe. Houghton et al. 2001, Climate Changes 2001: The Scientific Basis, Cambridge University Press, Cambridge- New York-Melbourne-Madrid-Cape Town, 2001

9
Climate scenario 1 n The SRES A2 Scenario in Houghton et al. 2001 limited to the space domain of our model is used in this study n The annual mean value of the temperature is assumed to be increased in the intervals prescribed by SRES A2 The temperature at cell is increased by an amount of at time where is randomly generated in the interval The mathematical expectation of the increase of the annual mean of the temperature in cell is Only temperatures were changed in this scenario

10
THE SRES - A2 SCENARIO

11
Climatic Scenario 2 Recommendations in Houghton et al. 2001 n There will be higher maximum temperatures and more hot days in land areas (changes in summer over land) n There will be higher minimum temperatures, fewer cold days and fewer frost days in nearly all land areas n The diurnal temperature range will be reduced over land areas The changes that are needed to satisfy the above requirements were made so that the annual means were as in the previous scenario (a requirement for consistency with SRES A2) Cloud covers in summer over land were reduced (only the temperatures were changed in Climatic Scenario 1)
 n There will be higher minimum temperatures, fewer cold days and fewer frost days in nearly all land areas n The diurnal temperature range will be reduced over land areas The changes that are needed to satisfy the above requirements were made so that the annual means were as in the previous scenario (a requirement for consistency with SRES A2) Cloud covers in summer over land were reduced (only the temperatures were changed in Climatic Scenario 1).")
12
Climatic Scenario 3 Recommendations about the amount of precipitation n There will be more precipitation events n There will be increased summer drying and associated risk of drought 1. The precipitation events during winter were increased (both over land and over water) 2. The precipitation events in the continental part of Europe were reduced during summer Similar changes were made for the humidity The cloud cover during winter were decreased, while the same cloud covers as in Climatic Scenario 2 were used during summer The changes were superimposed over the changes in the previous scenario
 2. The precipitation events in the continental part of Europe were reduced during summer Similar changes were made for the humidity The cloud cover during winter were decreased, while the same cloud covers as in Climatic Scenario 2 were used during summer The changes were superimposed over the changes in the previous scenario.")
13
Air pollution scenarios n Basic Scenario (using meteorology and emissions for 1989-1998) n Constant emissions (using meteorology for 1989-1998, but keeping the 1989 emissions during the whole period) n Constant meteorology (using meteorology for 1989 during the whole period and emissions for 1989-1998) n Climatic Scenario 1 (using 10 hypothetical years with the temperatures from Climatic Scenario 1 and the other parameters as in the Basic Scenario) n Climatic Scenario 2 (using 10 hypothetical years with the temperatures from Climatic Scenario 2 and the other parameters as in the Basic Scenario) n Climatic Scenario 3 (using 10 hypothetical years with the temperatures from Climatic Scenario 3 and the other parameters as in the Basic Scenario)
 n Constant emissions (using meteorology for , but keeping the 1989 emissions during the whole period) n Constant meteorology (using meteorology for 1989 during the whole period and emissions for ) n Climatic Scenario 1 (using 10 hypothetical years with the temperatures from Climatic Scenario 1 and the other parameters as in the Basic Scenario) n Climatic Scenario 2 (using 10 hypothetical years with the temperatures from Climatic Scenario 2 and the other parameters as in the Basic Scenario) n Climatic Scenario 3 (using 10 hypothetical years with the temperatures from Climatic Scenario 3 and the other parameters as in the Basic Scenario)")
14
Validation of the model results n Need for validation n Comparison of model results obtained by using the Basic Scenario (1989-1998) with corresponding measurements n Major observation: both the model results and the measurements show a trend of decreasing, which is to be expected, because the European emissions were decreased in the period 1989-1998 n Another observation: the comparison between measurements and model results becomes as a rule better at the end of the studied period n Difficulties: the model calculates a representative value for the grid- cell, while the measurements are taken at a given point. n The results seem to be satisfactory for the different concentrations. For quantities related to high ozone concentrations the situation is more complicated. These quantities are very sensitive to errors. Missing measurements are another big problem

15
DANISH MEASUREMENT STATIONS

16
Model results vs measurements

17
Impact of small errors on the accuracy of some of the results Assume that:

18
Constant emissions vs constant meteorology n Running with the same emissions: the trend of decreasing of the pollution levels disappears, but the pollution levels still vary considerably from one year to another n Running with the same meteorology: the trend of decreasing can still be seen, but the curves are much smoother (the pollution levels do not vary too much from one year to another) n Main conclusion: runs on long intervals are to be carried out in order to obtain full information about the variation of the pollution levels (both the variations that are due to the changed meteorological conditions and the variations that are due tp the changed emissions).
 n Main conclusion: runs on long intervals are to be carried out in order to obtain full information about the variation of the pollution levels (both the variations that are due to the changed meteorological conditions and the variations that are due tp the changed emissions).")
19
Emissions vs meteorology

21
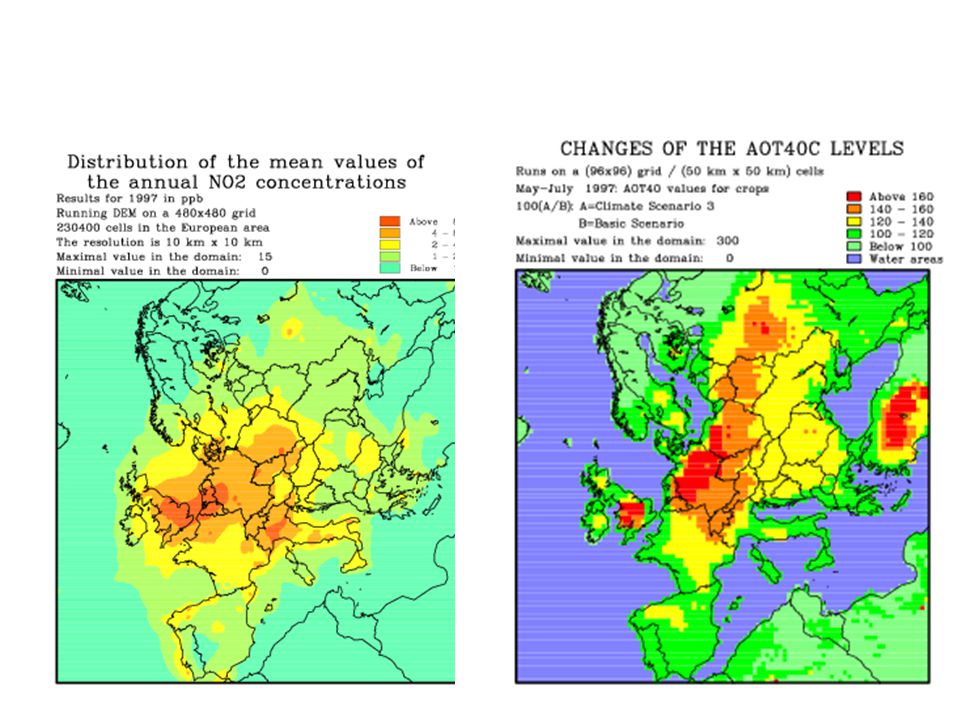
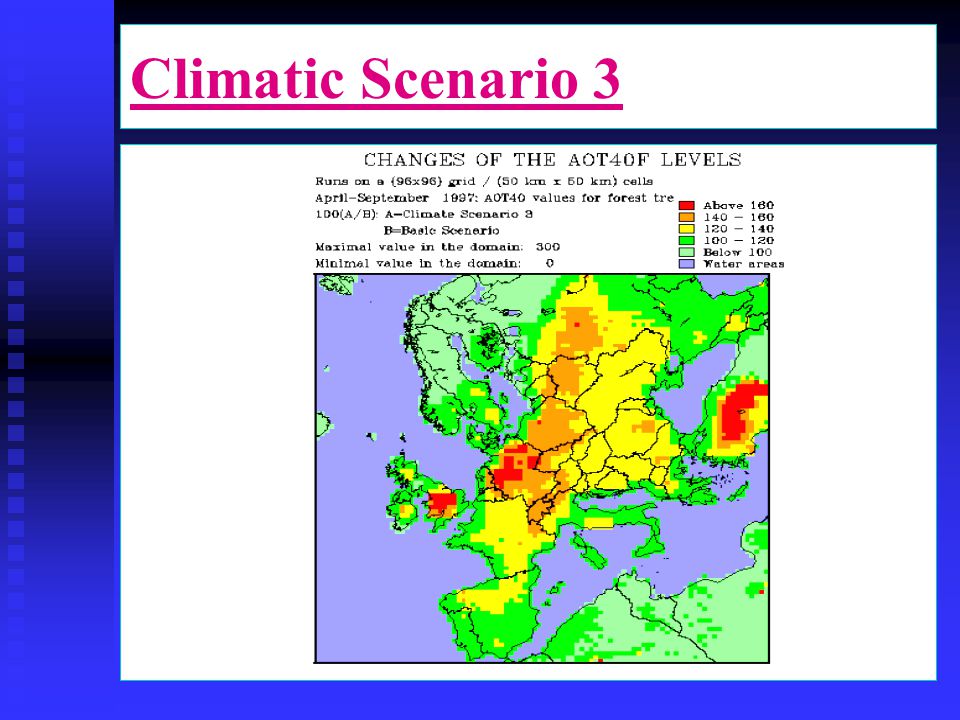
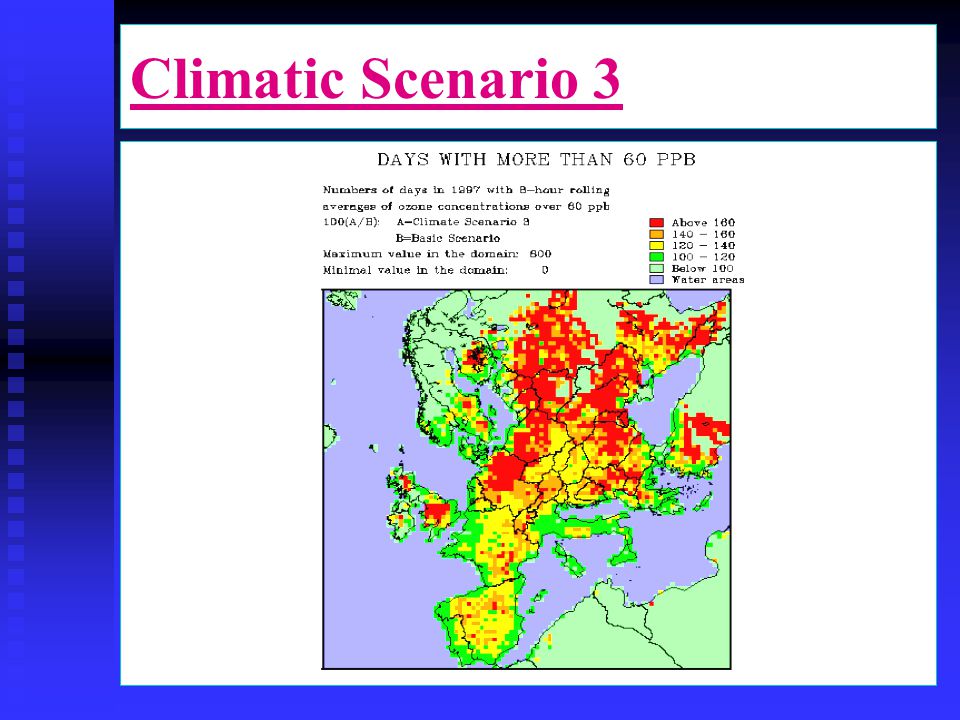
The Climatic Scenarios vs the Basic Scenario n For most of the pollutants the changes in Europe are very small n The annual means of the ozone concentrations in Denmark are larger when the Basic Scenario is used n The quantities related to high ozone concentrations are increased when the Climatic Scenario 3 is run. The increases are small in Denmark, but considerable increases can be seen in some parts of Europe (especially, in the highly polluted areas of Western and Central Europe)
.")
22
Climatic Scenario 3

27
Conclusions n The results indicate that the influence of the expected future climate changes on the concentration levels in Europe is not very large n Unfortunately, this conclusion cannot be extended for the critical limits established in the EU Ozone Directive from 2002. The changes in the quantities related to the critical levels can be rather considerable.

Similar presentations


 projections Olivier Crespo Thanks to M. Tadross Climate Systems Analysis Group University.>")


 Project is funded by the Climate Change Action Fund and provides climate change scenarios and related information.>")


