Download presentation
Presentation is loading. Please wait.

1
Statistical Analysis of cDNA Microarray Data: Challenges and Solutions Toni Reverter CSIRO – Livestock Industries AAHL Seminar - 12 Dec. 2002

2
Challenges Time DependentData Dependent Human Dependent ChronologyParadigmSkill Integration Distribution SourceSize Logical 1800s – DATA 30-60s – METHODS 50-70s – SOFTWARE 1980s – COMPUTER cDNA Quantitative Computer Sci. Statisticians Mathematicians ……. Non-Q Biochemists Physiologists Pathologists ……. Historical Excitement Balance Interdisciplinary AAHL Seminar - 12 Dec. 2002 EGGBANANA “banana omelette”

3
Human Dependent Challenges Historical Traditionally:Statistics grew alongside Agriculture “Introduction to Statistical Analysis” Nowadays:Statistics alongside (Bio)Technology Law of Large Numbers Central Limit Theorem Pythagoras Theorem SST = SSM + SSE d a b Hysterical AAHL Seminar - 12 Dec. 2002

4
Human Dependent Challenges Excitement (source of) Eg. Always log spot intensities and ratios T Speed. “Hints and Prejudices” Biochemist:My software does it, therefore it’s great! Statistician:Well, I need further evidence to be convinced Eg. Keren Byrne’s Data AAHL Seminar - 12 Dec. 2002

5
Human Dependent Challenges Balance Too many Statisticians: Evidence: It takes 1 ship, 10 days to cross the ocean Question: How many days does it take for 10 ships to cross the ocean? Evidence: It takes 1 builder, 10 days to build a wall Question: How many days does it take for 10 builders to build a wall? AAHL Seminar - 12 Dec. 2002

6
Human Dependent Challenges Balance Too many Statisticians: PHD SCHOLARSHIP Statistical Science Program MATHEMATICAL SCIENCES INSTITUTE THE AUSTRALIAN NATIONAL UNIVERSITY Stipend $22,771 (2002 rate, indexed annually, tax free) A PhD Scholarship (APAI) is being offered by the Mathematical Sciences Institute at The ANU. An ARC Linkage Grant held by Professors Peter Hall (ANU) and Don Poskitt (Monash University), in conjunction with BAE Systems, Melbourne, will fund the scholarship. The research problem is in the area of stochastic control applied to ship motion, and involves the development and implementation of both parametric and nonparametric methods. The successful applicant will have a strong interest in statistical methodology, computational techniques, theoretical analysis, and the development of statistical research problems. AAHL Seminar - 12 Dec. 2002
 and Don Poskitt (Monash University), in conjunction with BAE Systems, Melbourne, will fund the scholarship. The research problem is in the area of stochastic control applied to ship motion, and involves the development and implementation of both parametric and nonparametric methods. The successful applicant will have a strong interest in statistical methodology, computational techniques, theoretical analysis, and the development of statistical research problems. AAHL Seminar - 12 Dec")
7
Human Dependent Challenges Balance Too many Biochemists: Treated? NoYes No Yes 100 120 150 120 Died? Survival Rates: Treated = 150/270 = 55.55% Non-Tr = 100/220 = 45.45% Women? No Yes 60 100 30 60 NoYes Survival Rates: Treated = 30/90 = 33.33% Non-Tr = 60/160 = 37.50% 12.5% Decrease! Men? No Yes 40 20 120 60 NoYes Survival Rates: Treated = 120/180 = 66.66% Non-Tr = 40/60 = 66.66% No Difference! AAHL Seminar - 12 Dec. 2002 22% Increase!

9
Human Dependent Challenges Balance Too many Biochemists: * * * * * * * * * * * * * * * * * * * * * * * * * * * * * * * * r = 0.87 r = 0.00 x y AAHL Seminar - 12 Dec. 2002

10
Human Dependent Challenges Interdisciplinary Skills Minimal knowledge of the application discipline is needed …..failing that, the Statisticians will win,..…but with the wrong weapons. 1.Amount of Expression = Amount of Response 2.Same cut-off point to judge all genes 3.Over-emphasis in normalization (Thus, reject “Boutique Arrays”) 4.Over-emphasis in variance stabilization AAHL Seminar - 12 Dec. 2002
 4.Over-emphasis in variance stabilization AAHL Seminar - 12 Dec")
11
Human Dependent Challenges Interdisciplinary Skills Ex.2: Ralf Moser’s Data * * * * * * * * * * * * * * * * * * * * * ** * * * * % Lung Disease Wt Gain, Kg Ex.1: What’s a Steer? Minimal knowledge of the application discipline is needed: “Animal Breeding & Genetics” Options: 1. % Gain vs. % Disease 2. Medians instead of Means 3. Regression coefficients * AAHL Seminar - 12 Dec. 2002

12
Solutions Disease Wt Gain, Kg O B A AB O: Control (Untreated) A: Treatment A B: Treatment B AB: Both Treatments Model: O = A = + B = + AB = + + + estimates The ratio: A - AB = -( + ) AAHL Seminar - 12 Dec. 2002

13
Solutions O B A AB AAHL Seminar - 12 Dec. 2002

14
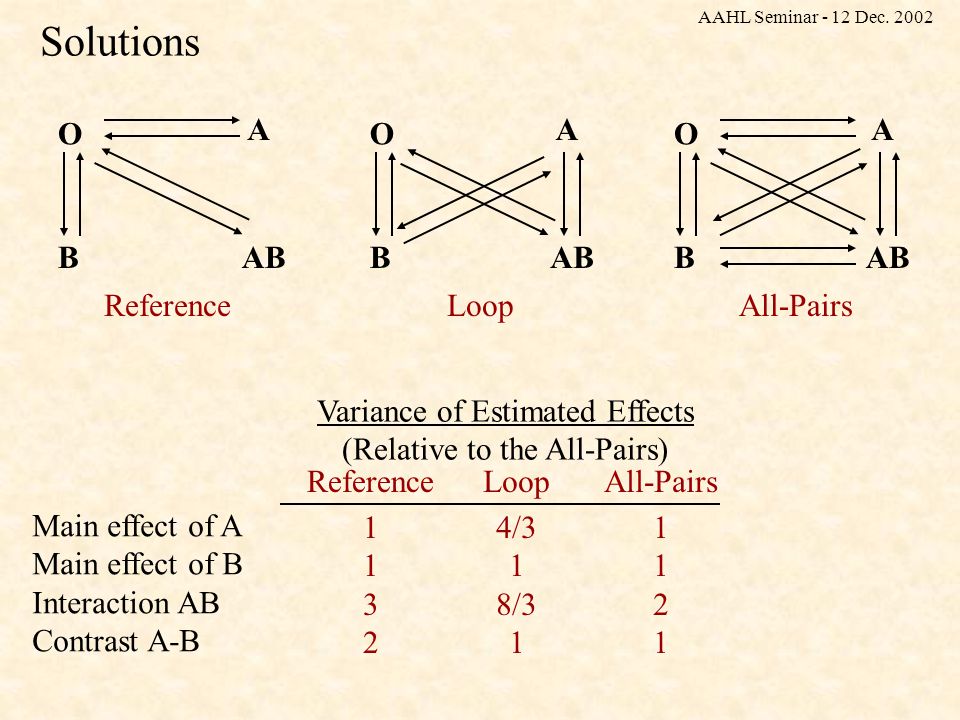
Solutions O B A AB O B A O B A ReferenceLoopAll-Pairs Variance of Estimated Effects (Relative to the All-Pairs) Reference 1 3 2 Loop 4/3 1 8/3 1 All-Pairs 1 2 1 Main effect of A Main effect of B Interaction AB Contrast A-B AAHL Seminar - 12 Dec. 2002
15
Solutions Probability of both Female? Case 1. No Information…………………………1/4 Case 2. The one on the left is female…………1/2 Case 3. One of them is female………….………1/3 AAHL Seminar - 12 Dec. 2002

16
Solutions 3 Equations > 35,000 Equations ! AAHL Seminar - 12 Dec. 2002

17
Solutions Clever ProgrammingTailored to your needs N=1 for filename in R16T0S1.gpr R16T0S2.gpr R16T24S1.gpr R16T24S2.gpr S32T0S1.gpr S32T0S2.gpr S32T24S1.gpr S32T24S2.gpr do # Get valid readings, compute log ratios awk 'NR>30 && $NF>=0 && $4!="no_spot" && \ substr($4,1,5)!="score" && substr($4,1,5)!="custo" && \ substr($4,1,6)!="spotre" && $9>$12 && $18>$21 \ {print $4, $9-$12, $18-$21, \ log($9-$12)/log(2.0), log($18-$21)/log(2.0)}' \ $filename | sort > junk1 awk '$2!=$3 {print $0, $4-$5, 0.5*($4+$5)}' junk1 > junk2 # get the median of log ratios REC=`wc -l junk2 | awk '{print int($1/2)}'` MED=`sort -n +5 junk2 | awk -v rec=$REC 'NR==rec {print $6}'` echo "Median of file" $filename " = " $MED # Global normalization: substract the median to each log ratio awk -v median=$MED -v slide=$N \ '{print "Slide_"slide, int(slide/2+.5), $1, $6-median}' junk2 | \ sort +2 > dat.$N N=`expr $N + 1` done cat dat.1 dat.2 dat.3 dat.4 dat.5 dat.6 dat.7 dat.8 > total.dat AAHL Seminar - 12 Dec. 2002

18
Solutions Clever ProgrammingTailored to your needs Interaction Solutions Your Needs: “Important values are…” 1.Away from (0,0) 2.In quadrants 1 and 4. Generate a new variable: +1.0*[(R 24 -R 0 )+(S 0 -S 24 )] if R 0 S 24 +0.5*[(R 24 -R 0 )+(S 24 -S 0 )] if R 0 <R 24 & S 0 <S 24 -0.5*[(R 0 -R 24 )+(S 0 -S 24 )] if R 0 >R 24 & S 0 >S 24 -1.0*[(R 0 -R 24 )+(S 24 -S 0 )] if R 0 >R 24 & S 0 <S 24 …then apply model-based clustering. AAHL Seminar - 12 Dec. 2002
+(S 0 -S 24 )] if R 0 S *[(R 24 -R 0 )+(S 24 -S 0 )] if R 0 <R 24 & S 0 <S *[(R 0 -R 24 )+(S 0 -S 24 )] if R 0 >R 24 & S 0 >S *[(R 0 -R 24 )+(S 24 -S 0 )] if R 0 >R 24 & S 0 <S 24 …then apply model-based clustering. AAHL Seminar - 12 Dec")
19
Solutions Clever ProgrammingTailored to your needs AAHL Seminar - 12 Dec. 2002

20
Solutions Clever ProgrammingTailored to your needs Get to know/use all the available options 1. t-Statistics:Standard Penalised 2. Clustering:Location-Based (k-Means, …) Model-Based (Mixtures of Distributions) 3. ANOVA (Linear Models) High Medium Low Keren’s Ralf’s AAHL Seminar - 12 Dec. 2002
 Model-Based (Mixtures of Distributions) 3. ANOVA (Linear Models) High Medium Low Keren’s Ralf’s AAHL Seminar - 12 Dec")
21
Conclusions Statistical Analysis of cDNA Microarray Data: GENERAL: 1.Still in its infancy (…possibly even embryonic stage) 2.Many decisions have a heuristic rather than a theoretical foundation 3.No hope for a “One size fits all” software 4.Safer to aim towards “Tailor to one’s needs” 5.Integration of interdisciplinary skills is a must LIVESTOCK SPECIES: 1.Tailing humans (…at the moment) 2.Strong background knowledge of genetics accumulated 3.Journals will soon be inundated 4.CLI has the opportunity to participate AAHL Seminar - 12 Dec. 2002

Similar presentations


 Prepared by Kwong Koon Shing.>")


