Download presentation
Presentation is loading. Please wait.

1
Jonathan Haughton Suffolk University, Boston Jonathan.haughton@suffolk.edu For the World Bank. May 11, 2011

2
1. Who bears the burden of taxes? 2. Who benefits from government spending? 3. What are the net effects? 4. Who would gain/lose under different possible tax reform packages, and by how much? May 11, 2011JH: Tax & Expenditure Incidence in PeruPage 2

3
Central government tax revenue 11.6% of GDP in 2004 Buoyant since 2002 71% of revenue from indirect tax ▪ Vat: 19% rate; but yields just 4.9% of GDP Income tax: 3.4% of GDP May 11, 2011JH: Tax & Expenditure Incidence in PeruPage 3

6
Revenue/GDP: 20% to 2000, now 25% VAT: 7% of GDP (at 10% rate!) Trade: from 4% to 2% of GDP, despite explosion of imports All income tax: Peaked at 10% GDP in 2006, but dependent on SOE sector NB: PIT raises 2% of revenue; surprisingly, not rising
 Trade: from 4% to 2% of GDP, despite explosion of imports All income tax: Peaked at 10% GDP in 2006, but dependent on SOE sector NB: PIT raises 2% of revenue; surprisingly, not rising")
8
Step 1. Make assumptions about incidence Statutory incidence ≠ Effective incidence See Table May 11, 2011JH: Tax & Expenditure Incidence in PeruPage 8

9
VAT: on consumers Excises: on consumers PIT: on earners Business profits: on earners Other taxes: ▪ Property transfer; local fees and contributions: on payers. ▪ In this study, CIT, trade taxes, natural resource taxes, not included. Incidence covers half of revenue.

10
quantity supply S(1+t) price demand Pd2 Q1 Q2 P1 Ps2
 price demand Pd2 Q1 Q2 P1 Ps2")
11
quantity supply S(1+t) price demand Pd2 Q1 Q2 P1=Ps 2 What elasticity?
 price demand Pd2 Q1 Q2 P1=Ps 2 What elasticity")
12
May 11, 2011JH: Tax & Expenditure Incidence in PeruPage 12

13
Step 2. Quantify the effects Trace effect of a tax, spending change on every household in a survey ENNIV 2000. 3,997 households, 19,957 people, LSMS template NB. Assumes equal sharing within household May 11, 2011JH: Tax & Expenditure Incidence in PeruPage 13

14
Operationalize the analysis Excel spreadsheet Stata dataset and programs. Change spreadsheet; it invokes Stata, returns the results. May 11, 2011JH: Tax & Expenditure Incidence in PeruPage 14

15
9,189 households, including 4,298 from 2004 round. Two visits per household; 93% of interviews in June, Sept or Oct. Some explicit tax information (e.g. business taxes); otherwise has to be inferred (e.g. VAT, PIT).
; otherwise has to be inferred (e.g. VAT, PIT)..")
16
Socio-economic survey, 2009 47-page data dictionary 139,590 individuals From 43,844 households ▪ Aside: US 1% IRS file plus non-filers: c. 150,000 filers.

17
19% rate. Fairly stable since 1992. Exports zero rated Exemptions include clothing, rice, milk, fish, vegetables, ed. fees, home consumption, housing In 2000: 42% of central gov. tax revenue Collected 7.3% of household expenditure. May 11, 2011JH: Tax & Expenditure Incidence in PeruPage 17

19
May 11, 2011JH: Tax & Expenditure Incidence in PeruPage 19

20
Regressivity probably overstated, if poor are more likely to buy in informal sector By expenditure/cap: slightly regressive By income/cap: highly regressive May 11, 2011JH: Tax & Expenditure Incidence in PeruPage 20

21
Income: Easy to measure Widely used in developed countries Overstates regressivity: “lifetime income” Expenditure Less underreporting than income Closer to “permanent income” May understate regressivity May 11, 2011JH: Tax & Expenditure Incidence in PeruPage 21

22
In 2000, summarized: Alcohol, especially beer (t=27.8% of 84% of rec. prodr. price) Soft drinks (t=17% ex factory) Cigarettes (t=37.2%) New vehicles (t=10%) Motor fuel ▪ Gasoline (S/.2.90 per gallon) ▪ Diesel S/.2.29 per gallon) May 11, 2011JH: Tax & Expenditure Incidence in PeruPage 22
 Soft drinks (t=17% ex factory) Cigarettes (t=37.2%) New vehicles (t=10%) Motor fuel ▪ Gasoline (S/.2.90 per gallon) ▪ Diesel S/.2.29 per gallon) May 11, 2011JH: Tax & Expenditure Incidence in PeruPage 22.")
23
May 11, 2011JH: Tax & Expenditure Incidence in PeruPage 23

24
May 11, 2011JH: Tax & Expenditure Incidence in PeruPage 24

25
Expend/cap: Kakwani (>0 = progressive) Income/cap: Revenue as % of all tax revenue Actual revenue as % of estimated Alcohol0.057-0.1103.6213 Soft drinks -0.105-0.2830.6127 Tobacco-0.0030.5170 May 11, 2011 JH: Tax & Expenditure Incidence in Peru Page 25 Note under-reporting of expenditures
 Income/cap: Revenue as % of all tax revenue Actual revenue as % of estimated Alcohol Soft drinks Tobacco May 11, 2011 JH: Tax & Expenditure Incidence in Peru Page 25 Note under-reporting of expenditures")
26
May 11, 2011JH: Tax & Expenditure Incidence in PeruPage 26

27
Expend/cap: Kakwani (>0 = progressive) Income/cap: Revenue as % of all tax revenue Actual revenue as % of estimated Motor fuel 0.3780.2469.3732 Vehicles0.4120.2881.0225 May 11, 2011 JH: Tax & Expenditure Incidence in Peru Page 27 Notes: Fuel numbers overstate progressivity, because of the “bus and truck problem” Vehicle numbers assume purchases in proportion to ownership, which is awkward Ideal is to run this through an input-output table
 Income/cap: Revenue as % of all tax revenue Actual revenue as % of estimated Motor fuel Vehicles May 11, 2011 JH: Tax & Expenditure Incidence in Peru Page 27 Notes: Fuel numbers overstate progressivity, because of the bus and truck problem Vehicle numbers assume purchases in proportion to ownership, which is awkward Ideal is to run this through an input-output table")
30
May 11, 2011JH: Tax & Expenditure Incidence in PeruPage 30

31
May 11, 2011JH: Tax & Expenditure Incidence in PeruPage 31 Progressive or not?

32
May 11, 2011JH: Tax & Expenditure Incidence in PeruPage 32

37
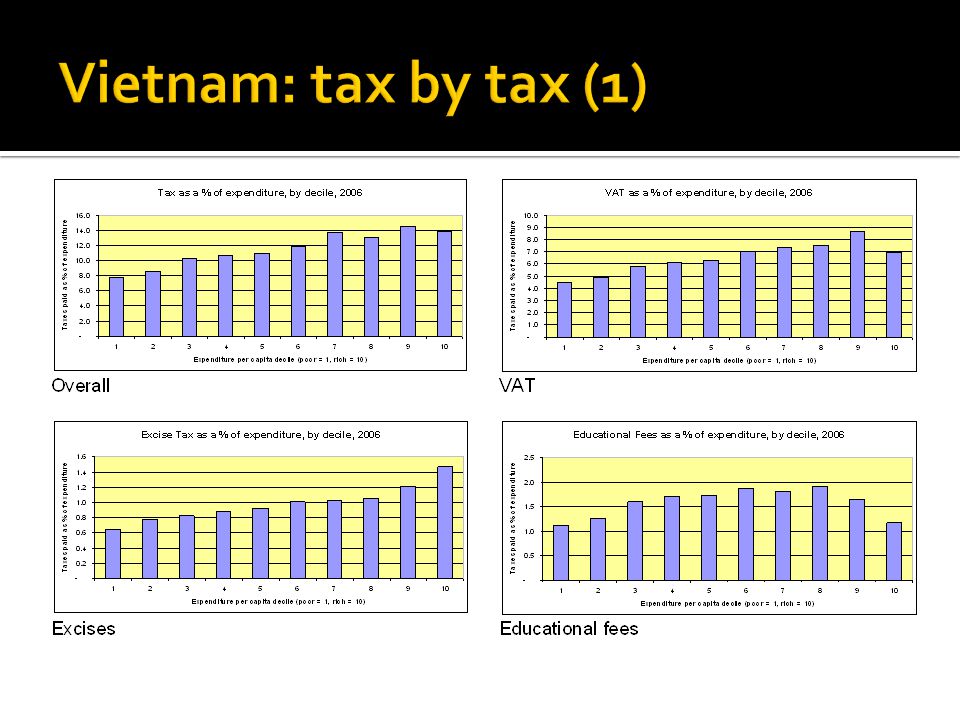
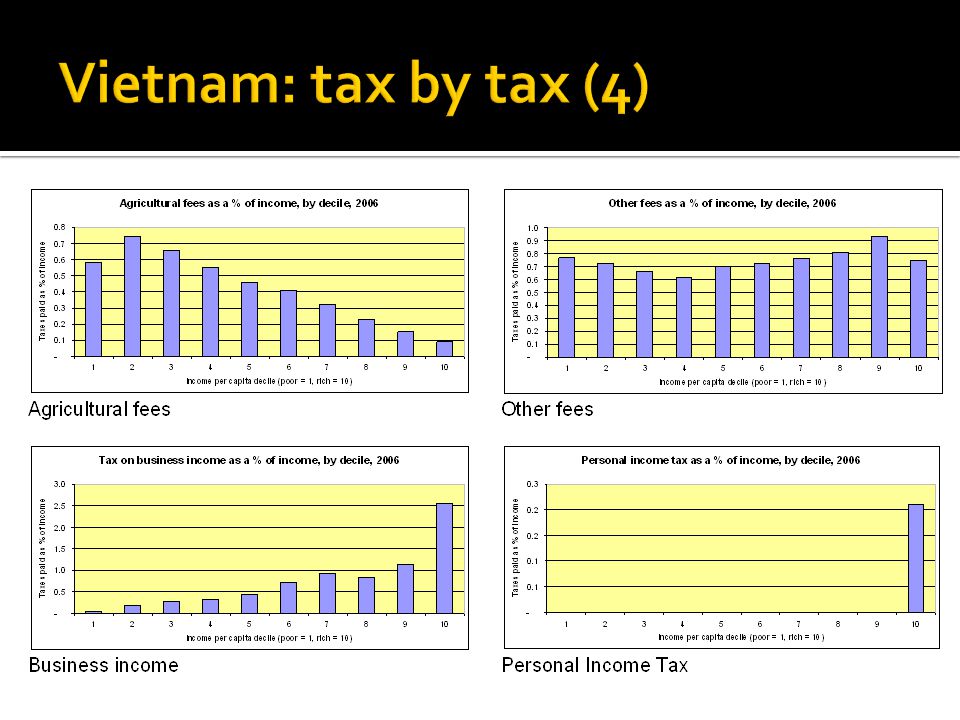
In Vietnam, incidence pattern by expenditure/cap decile similar to that by income/cap Contrast with Peru These taxes are progressive overall Heavier, more progressive, than 1998 VAT is generally progressive – mainly due to home production (1/3 at bottom, 1% at top); not the case in all countries Excise taxes are progressive – also a bit surprising.
; not the case in all countries Excise taxes are progressive – also a bit surprising.")
39
Regional effects Personal Income Tax Property Tax Expenditure incidence Marginal full incidence Policy reforms

40
Higher tax rates in south Highest rate in South-Central Coast (sampling error?) Urban/rural gap in burden is surprisingly small
 Urban/rural gap in burden is surprisingly small")
43
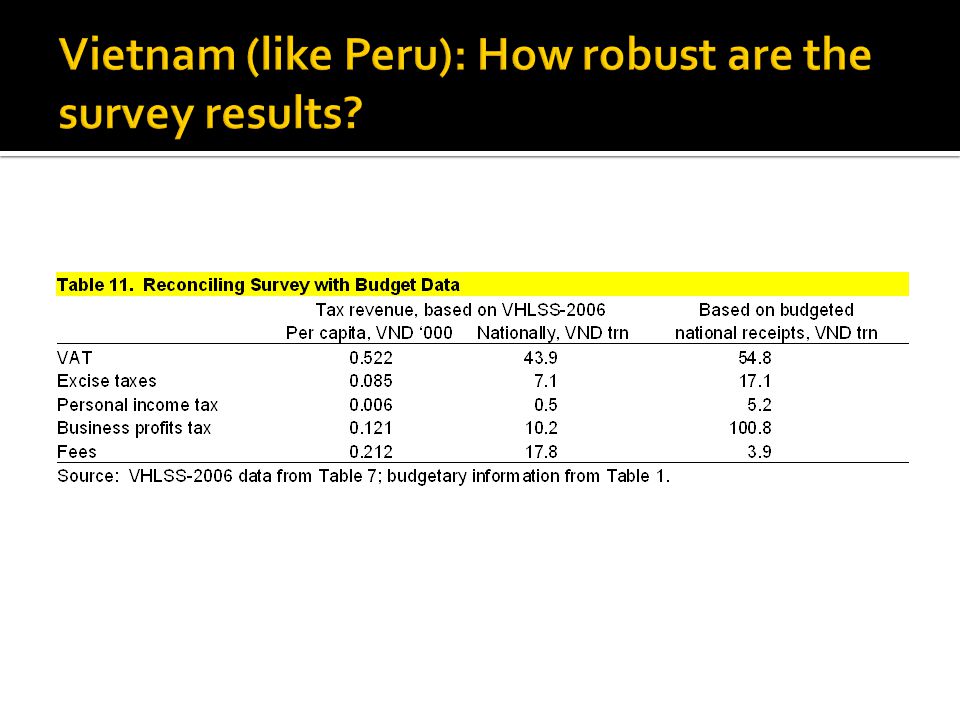
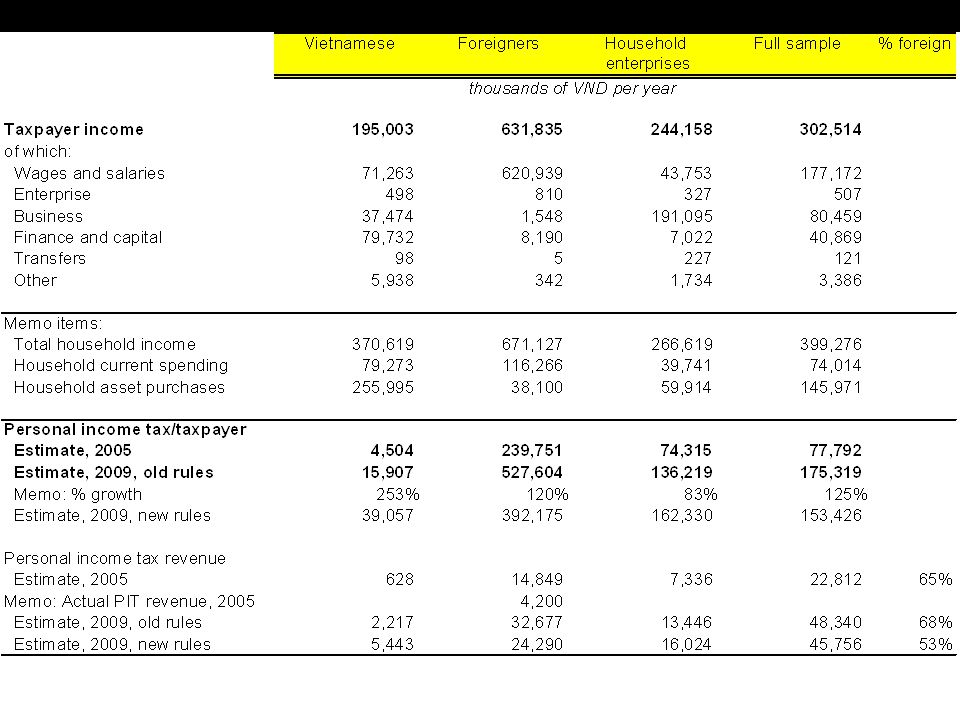
Method: strip out business income tax and PIT, and apply rules of new tax Revenue: from VND127k to VND21k per person. New tax highly progressive. But: excludes foreigners; very small sample size for PIT and for large household enterprises.

44
Done by General Dept. of Taxation in 2005, using tax rolls Survey, asking about income, spending 15,500: 3,200 foreign, 7,200 PIT, 5,100 business income tax 11,535 responses (74%); low in HCMC, among foreigners. Results re-weighted. Anything equivalent in Thailand?
; low in HCMC, among foreigners. Results re-weighted. Anything equivalent in Thailand .")
46
Based on 2009 NB. PIT very elastic Total revenue: -5% ▪ Foreigners: down by a quarter ▪ Vietnamese: tax payments up Reconcile with VHLSS data High-income individuals would pay more Not-so-high income individuals would pay less, and not be in the tax net as much Difficult to merge the two; in progress. Keep: taxes foreigners, adds equity. Enforcement could be better. Perhaps limit top rate to top CIT. Adjust brackets for inflation (as in US).
..")
47
VHLSS has limited data on property: Residence; non-agric. real estate Assume tax would not apply to agricultural property, or to movable property. 1% of capital value; arbitrary

49
Highly progressive 1% is steep; 7.8% of expenditure, so politically infeasible at this level. Cash flow concerns Based on bubble prices? Introduction of tax would reduce base Excludes corporate ownership

51
Applied to education, health, targeted social programs Step 1: Measure unit subsidies Step 2: Identify coverage Step 3: Present results May 11, 2011JH: Tax & Expenditure Incidence in PeruPage 51

52
In 2000 ▪ 98.8% of children 7-10 were at school ▪ 94% of 14-year-olds were at school ▪ 13% of pupils/students were at private schools Costs ▪ Pre-K: S/. 583 per child per year ▪ K & primary: S/. 386 ▪ Secondary:S/. 624 ▪ Tertiary:S/.2,506 Assigned based on attendance May 11, 2011JH: Tax & Expenditure Incidence in PeruPage 52

53
May 11, 2011JH: Tax & Expenditure Incidence in PeruPage 53

54
May 11, 2011JH: Tax & Expenditure Incidence in PeruPage 54 “progressive but not well-targeted”

56
Cost of procedures Used ENNIV-2000 reported data on cost at private facilities Adjusted downwards substantially to be consistent with government spending ▪ Cost/consultationS/. 0.75/minute ▪ Cost of hospitalizationS/. 75/night ▪ Cost of an analysisS/. 6.2/item May 11, 2011JH: Tax & Expenditure Incidence in PeruPage 56

57
May 11, 2011JH: Tax & Expenditure Incidence in PeruPage 57

58
May 11, 2011JH: Tax & Expenditure Incidence in PeruPage 58

59
Allocated based on reported usage May 11, 2011JH: Tax & Expenditure Incidence in PeruPage 59

60
May 11, 2011JH: Tax & Expenditure Incidence in PeruPage 60

61
May 11, 2011JH: Tax & Expenditure Incidence in PeruPage 61

62
System seems progressive overall But ▪ Some taxes not included (e.g. CIT) ▪ Not all spending can be included ▪ Rely on our incidence assumptions May 11, 2011JH: Tax & Expenditure Incidence in PeruPage 62
 ▪ Not all spending can be included ▪ Rely on our incidence assumptions May 11, 2011JH: Tax & Expenditure Incidence in PeruPage 62.")
63
May 11, 2011JH: Tax & Expenditure Incidence in PeruPage 63

64
May 11, 2011JH: Tax & Expenditure Incidence in PeruPage 64

65
Addresses question: If a tax were raised, and spending increased as a result, what would effect be on incidence? Step 1: Estimate effect of more tax revenue on spending Step 2: Simulate effect of higher VAT in Peru May 11, 2011JH: Tax & Expenditure Incidence in PeruPage 65

66
Estimated using regression of form i.e. spending/GDP (y) is a function of tax revenue/GDP (x) Panel Data: 16 Latin American countries, 1980-2002. “Fixed effects” estimates. May 11, 2011JH: Tax & Expenditure Incidence in PeruPage 66
 is a function of tax revenue/GDP (x) Panel Data: 16 Latin American countries, Fixed effects estimates. May 11, 2011JH: Tax & Expenditure Incidence in PeruPage 66.")
67
May 11, 2011JH: Tax & Expenditure Incidence in PeruPage 67 Note: Low marginal effects for education, health No marginal effect for interest payments High marginal effects for social spending

68
2000: assume VAT from 18% to 19% Of extra revenue: ▪ Education takes 7.6% ▪ Health takes 7.3% ▪ Social subsidies take 28.4% ▪ Remaining spending not allocable May 11, 2011JH: Tax & Expenditure Incidence in PeruPage 68

69
May 11, 2011JH: Tax & Expenditure Incidence in PeruPage 69

70
A higher VAT need not hurt the poor Result is robust to whether we use expenditure/cap or income/cap to sort households May 11, 2011JH: Tax & Expenditure Incidence in PeruPage 70

71
Greater disaggregation of spending Sensitivity to assumptions about incidence Source of purchases/evasion Better treatment of transport Use income tax data Add social security pensions May 11, 2011JH: Tax & Expenditure Incidence in PeruPage 71

72
Confidence intervals (bootstrapping?) Create integrated “calculators”; and do it in-house Need better access to primary data Adjust for quality/value of benefits Theory: why income/cap results differ so much from expend/cap results ▪ Measurement error (Deaton)/permanent income May 11, 2011JH: Tax & Expenditure Incidence in PeruPage 72
 Create integrated calculators ; and do it in-house Need better access to primary data Adjust for quality/value of benefits Theory: why income/cap results differ so much from expend/cap results ▪ Measurement error (Deaton)/permanent income May 11, 2011JH: Tax & Expenditure Incidence in PeruPage 72")
77
jonathan.haughton@suffolk.edu

Similar presentations