Download presentation
Presentation is loading. Please wait.

1
Introduction to Ecology: Population Ecology Part 1
Biology 213 Chapter 53 Introduction to Ecology: Population Ecology Part 1 *The world human population in 2004 is now estimated to be about 6.4 billion people, doubling every 40 years.

2
You will be able to… List various fields of study in Ecology
Explain what factors change populations Calculate population rate changes Compare and contrast density-dependent to density-independent factors

3
Ecology: Oikos = home Ology = study of
Integrates all biological fields Organismal ecology: physiology, behavior, interactions with environment Population ecology: factors affecting groups of individuals in an area. Community ecology: interactions between species in an area

4
Ecosystem ecology: biotic and abiotic interactions; E flow & chem
Ecosystem ecology: biotic and abiotic interactions; E flow & chem. Cycles Landscape ecology: exchange of E & materials across multiple ecosystems 6. Global ecology: biosphere: regional exchange of E & materials affecting entire functioning & distribution of organisms wotldwide.

5
Ecology & environmental issues Complexity of Nature:
Ecology & evolution: changes in environment impacting populations’ alleles over time. Ecology & environmental issues Complexity of Nature: Why are some species present in an area? Dispersal difficulties (accessibility?) Behaviour limits distribution (habitat preference)? Biotic factors: competition/parasitism/predation/etc Abiotic factors: Chem: H2O, O2, pH, salinity, nutrients Phys: Macro & micro climate: Temp, light, fire, soil composition, moisture
 Behaviour limits distribution (habitat preference) Biotic factors: competition/parasitism/predation/etc. Abiotic factors: Chem: H2O, O2, pH, salinity, nutrients. Phys: Macro & micro climate: Temp, light, fire, soil composition, moisture.")
6
Estimate: one million years to get from 2
Estimate: one million years to get from 2.5 million to human population of ~ 5 million people in 6000 B.C. (2x) population did not reach 500 million until almost 8,000 years later -about 1650 A.D (100x) doubled roughly once every thousand years or so reached a billion ~ 1850, doubling in 200 years reached two billion around 1930 – doubling in 80 years 1970’s it reached 4 billion ~ 40 year doubling time Today’s population ~ 7 billion
 population did not reach 500 million until almost 8,000 years later -about 1650 A.D (100x) doubled roughly once every thousand years or so. reached a billion ~ 1850, doubling in 200 years. reached two billion around 1930 – doubling in 80 years. 1970’s it reached 4 billion ~ 40 year doubling time. Today’s population ~ 7 billion.")
7
What factors have allowed human population to increase so rapidly?

8
Ecologists study population trends rather than individual organisms.
Properties of populations include Population size Population density Patterns of dispersion Demographics Population growth Limits on population growth

9
Population dispersion (spacing)
Population density # individuals of a species per unit at a given time Population dispersion (spacing) How are individuals distributed in a habitat? Why would this be important to know if you were studying a population? What does a dispersion pattern tell you?
 How are individuals distributed in a habitat Why would this be important to know if you were studying a population What does a dispersion pattern tell you")
10
Individual members distributed in a # of different ways:
Clumped - Uniform - Random -

11
Why would a clumped population pattern form?
individuals _____________ to each other, or __________________________________.

12
What factors encourage a uniform population pattern?
individual organisms actively _____ each other or all _________________________________

13
What abiotic or biotic features would encourage a random population pattern?
Rare in nature - occurs in absence of strong attractions or repulsions among individuals.

14
Dispersion patterns and density may change over time
Habitat changes: food, nutrients, water, sunlight (plants) Age / size / developmental stages change:
 Age / size / developmental stages change:")
15
Four factors that produce changes in population size
1. Two events increase populations: Birth Immigration Every time an animal is born, it's added to the population. The total number of animals born to a population each year can be counted or estimated. Rodents such as mice may have about five babies in a litter and have several litters per year. On the other hand, elephants have just one young every two years. Painted turtles lay from two to twenty eggs a year, but they don't all survive to become adults. Another event that increases population is immigration, or when animals move into a new area. Animals leave their homes to find new ones if their old habitat is too crowded, if they can't find a mate, or if their old habitat is destroyed. Leaving an old habitat is called emigration. 2. Two events decrease populations: Death Emigration When an animal dies it is subtracted from the population. Animals die from old age, starvation, disease, predation, or accidents. Sometimes the beginning of life is the most dangerous because young animals are easier for predators to catch.

16
Natality: birth rate

17
Mortality rates

18
Mortality rate of cheetahs
Increased Infant Mortality Is the cheetah dangerously inbred? Majority of deaths in wild due to predation. Future for cheetah population?

19
How a population changes: D in # of individuals
in a certain period of time N = r =

20
How a population changes: D in # individuals / time
r = * Per 1,000 individuals Growth rate =

21
Example: N = 300,000 humans: 3,000 births + 1,500 deaths in one year
r = (birth rate) – (death rate)
 – (death rate)")
22
Example: N = 300,000 humans: r = (birth rate) – (death rate) r = r =
 – (death rate) r = r =")
23
Example: N = 300,000 humans: rN = 0.5 x 300,000 rN =
r = x 100 = 0.5% increase rN = 0.5 x 300,000 rN =

24
If r is positive, increase in pop.
If r is negative, pop. is decreasing If r = 0, population is stable

25
Are there other factors besides birth and death and
size of a population that can change a population?

26
Immigration What causes immigration biologically? Favorable factors

27
Factors encouraging immigration:
New environment made available Natural disasters large and small Competitive or predatory species goes extinct / moves away Climate change or new resources Hitch-hiking (“alien” species) Less competition in new area
 Less competition in new area.")
28
Succession after a disaster
Immigrants have an opportunity to invade: Reduced competition

29
Factors that encourage successful immigration:
Distribution methods: dispersal is at or near ground level vs. aerial dispersal dispersers actively engage in searching, or not dispersers able to orient toward preferred habitat from some distance,

30
Wind dispersing Golden Orb spiders
Small animals, such as mites and spiderlings, may disperse by launching themselves into a convective updraft and entering the “aerial plankton” (Richter 1970). The behavior and orientation abilities of aerial plankters descending from the atmosphere is not well understood, although there is evidence that they may be “scrubbed” from the atmosphere by rain (Russell 1999). Aerial plankters with little control over their ultimate destination, such as seeds or fungal spores, would be deposited onto habitat patches in direct proportion to patch area. Those failing to land in a patch might die if the matrix is a hostile environment. For such organisms, we would expect no relationship between patch size and the number of immigrants per unit area. Thus, all else being equal, we would expect no relationship between patch size and populaton density—the “random-sample hypothesis” (e.g., Andrén 1994). Large insects, such as the spruce budworm, may also disperse in the aerial plankton, and may similarly be deposited by weather events such as thunderstorm downdrafts (Greenbank et al. 1980). However, unlike mites and spiderlings, larger insects landing outside a patch are unlikely to die immediately; instead, they would continue searching, some randomly (Fig. 2B). For example, after its daily egg-laying bout, a female cabbage butterfly (Pieris rapae) disperses at an altitude of about 100 m, for a distance of about 450 m, in a random direction. The following day she randomly searches at ground level for host plants. Because of the ground-level search, this dispersal behavior results in a negative relationship between host patch size and density of cabbage butterfly eggs and larvae (Fahrig and Paloheimo 1987); see Fig. 2B. Long-jawed orb-weaving spiders (Tetragnatha elongata) discover woodland patches through random unoriented movement (Gillespie 1987), as in Fig. 2B; all else being equal, we would predict a negative relationship between patch size and population density for this species. Other insects that disperse in the aerial plankton make the final approach to patches low to the ground, orienting toward patches using some interplay of visual and olfactory cues (Prokopy and Owens 1983). Those for which vision dominates, such as the apple maggot fly Rhagoletis pomonella, which is attracted to silhouettes of host trees (Moericke et al. 1975), would find patches in proportion to their linear dimensions, resulting in lower densities in larger patches. Insects that locate their resources primarily by olfaction, such as the cabbage fly (Erioischia brassicae; Hawkes 1974), might be expected to find patches in direct proportion to their area. Density of such species would show no relationship to patch size.
. The behavior and orientation abilities of aerial plankters descending from the atmosphere is not well understood, although there is evidence that they may be scrubbed from the atmosphere by rain (Russell 1999). Aerial plankters with little control over their ultimate destination, such as seeds or fungal spores, would be deposited onto habitat patches in direct proportion to patch area. Those failing to land in a patch might die if the matrix is a hostile environment. For such organisms, we would expect no relationship between patch size and the number of immigrants per unit area. Thus, all else being equal, we would expect no relationship between patch size and populaton density—the random-sample hypothesis (e.g., Andrén 1994). Large insects, such as the spruce budworm, may also disperse in the aerial plankton, and may similarly be deposited by weather events such as thunderstorm downdrafts (Greenbank et al. 1980). However, unlike mites and spiderlings, larger insects landing outside a patch are unlikely to die immediately; instead, they would continue searching, some randomly (Fig. 2B). For example, after its daily egg-laying bout, a female cabbage butterfly (Pieris rapae) disperses at an altitude of about 100 m, for a distance of about 450 m, in a random direction. The following day she randomly searches at ground level for host plants. Because of the ground-level search, this dispersal behavior results in a negative relationship between host patch size and density of cabbage butterfly eggs and larvae (Fahrig and Paloheimo 1987); see Fig. 2B. Long-jawed orb-weaving spiders (Tetragnatha elongata) discover woodland patches through random unoriented movement (Gillespie 1987), as in Fig. 2B; all else being equal, we would predict a negative relationship between patch size and population density for this species. Other insects that disperse in the aerial plankton make the final approach to patches low to the ground, orienting toward patches using some interplay of visual and olfactory cues (Prokopy and Owens 1983). Those for which vision dominates, such as the apple maggot fly Rhagoletis pomonella, which is attracted to silhouettes of host trees (Moericke et al. 1975), would find patches in proportion to their linear dimensions, resulting in lower densities in larger patches. Insects that locate their resources primarily by olfaction, such as the cabbage fly (Erioischia brassicae; Hawkes 1974), might be expected to find patches in direct proportion to their area. Density of such species would show no relationship to patch size.")
31
Emigration Unfavorable Factors: *Excessive competition: mates or food
*Lack of resources *Disease *Avoidance of in-breeding

32
Population change includes immigration and emigration:
r = (birth rate) – (death rate) plus (immigration – emigration) e.g. Example: N = 300,000 humans: 3000 births deaths in one year 3,000 immigrated into the area 9,000 emigrated out of the area
 – (death rate) plus. (immigration – emigration) e.g. Example: N = 300,000 humans: 3000 births deaths in one year. 3,000 immigrated into the area. 9,000 emigrated out of the area.")
33
r = (b – d) + (i – e) b – d = (10/1000) – (5/1000) = 0.005
= – = r = (b – d) + (i – e) = (0.005) + (-0.002) = x 100 = 0.3% Growth rate: rN = (0.3%)(300,000) = 900 more people in the population
 + (i – e) = (0.005) + (-0.002) = x 100 = 0.3% Growth rate: rN = (0.3%)(300,000) = 900 more people in the population.")
34
Intrinsic rate of increase (rmax)
Maximum rate at which species or population can increase under ideal conditions Exponential population growth

35
Exponential population growth

36
According to Malthus: Population, when unchecked, increases in a geometrical ratio. Subsistence increases arithmetically. In 1798 the Englishman Thomas R. Malthus posited a mathematical model of population growth. He model, though simple, has become a basis for most future modeling of biological populations. Malthus's observation was that, unchecked by environmental or social constraints, it appeared that human populations doubled every twenty-five years, regardless of the initial population size. Said another way, he posited that populations increased by a fixed proportion over a given period of time and that, absent constraints, this proportion was not affected by the size of the population. By way of example, according to Malthus, if a population of 100 individuals increased to a population 135 individuals over the course of, say, five years, then a population of 1000 individuals would increase to 1350 individuals over the same period of time. According to Malthus, “ the power of population is indefinitely greater than the power in the earth to produce subsistence for man. Population, when unchecked, increases in a geometrical ratio. Subsistence increases only in an arithmetical ratio.” Darwin used this idea to help formulate his theories, particularly natural selection

37
Carrying capacity Carrying capacity (K) = largest population maintained without degrading environment they live in Changes as environment changes Logistic population curve (S-shaped curve)
")
38
Carrying capacity and logistic population growth
Limiting Factors K-N/K represents the limiting factors affecting the population growth rate. A small N

39
Density-dependent factors
Regulate population growth by affecting large proportion of population as population rises:

40
Density-dependent factors
What do you think would impact a population as it got bigger? Predation Disease Competition Toxic wastes

41
Density-dependent factors and negative feedback

42
Density-independent factors
Limit population growth but are not influenced by changes in population density: usually ABIOTIC Examples include natural disasters: Hurricanes Blizzards Forest fires Mudslides Volcanoes, tsunamis, and earthquakes

43
Limiting Factors Biotic and abiotic, Density dependent or independent
factors that limit a population’s growth: What would be a limiting factor?

44
What can you think of that would be a
limiting factor? Which are biotic and which are abiotic? increase death rate decrease birth rate limits immigration encourages emigration Any factors that slows population growth.

45
How are up & down cycles explained?
Can be very complex relationships and factors.

46
Introduction to Ecology: Population Ecology Part 2
Biology 213 Chapter 53 Introduction to Ecology: Population Ecology Part 2 *The world human population in 2004 is now estimated to be about 6.4 billion people, doubling every 40 years.

47
You will be able to… Explain what factors change populations
Calculate population rate changes Compare and contrast density-dependent to density-independent factors Analyze human population patterns and make predictions about future trends

48
Semelparous reproduction
Expend their energy in a Iteroparous reproduction Exhibit ________________________ throughout their lifetimes

49
Semelparity: Expend energy to reproduce in one big effort
Most insects, invertebrates, many annual plants, and some fish What’s the advantage?

50
Iteroparous reproduction
Expend energy to reproduce in cycles Most vertebrates, perennial plants. What’s the advantage?

51
Species exhibiting an r strategy
Emphasizes a high growth rate Organisms typically have small body size high reproductive rates short life spans inhabit variable environments Often

52
Species exhibiting a K strategy
Maintains a population near carrying capacity (K) of environment Species often have large body size low reproductive rates long life spans inhabit stable environments Often
 of environment. Species often have. large body size. low reproductive rates. long life spans. inhabit stable environments. Often.")
53
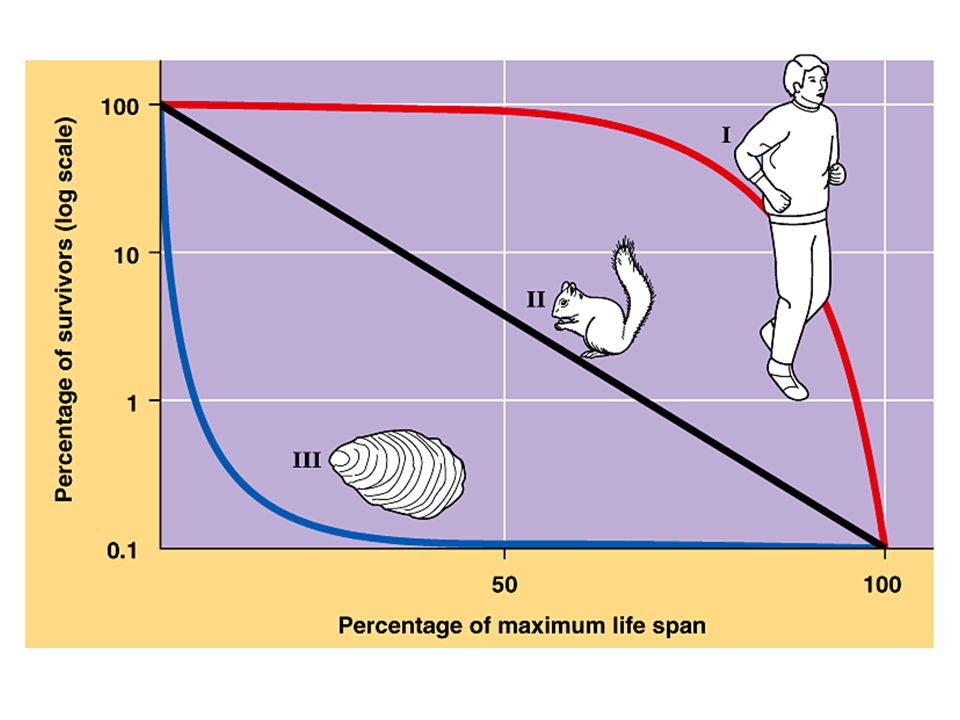
Survivorship curves Type I Mortality is greatest in old age Type II Mortality is spread evenly across all ages Type III Mortality is greatest among the young

54
Survivorship curves

56
Survivorship curve for a herring gull population

57
Source habitats: Preferred habitats
Local reproductive success is > local mortality Local individuals disperse from source habitats to other regions

58
Sink habitats Lower-quality habitats
Individuals may suffer death or poor reproductive success What would make an organism move then?

59
Source & sink populations in a hypothetical metapopulation

60
Human population growth
World population reaches 6,668,926,425 by May 20, 2008 Per capita growth rate declined from peak in 1965 of about 2% per year (doubling time 35 years) to 1.3% per year (doubling time of 54 years) birthrate necessary for zero population growth is 2.1 births per woman 7,000,000,000 The year 2011
 to 1.3% per year (doubling time of 54 years) birthrate necessary for zero population growth is 2.1 births per woman. 7,000,000,000. The year")
61
Human population growth: exponential J-shaped curve so far

62
logistic population growth

63
Chapter 53 Clicker Question #4:
Often growth cycles of one population affects the cycle of another. As moose populations increase, wolf populations also increase. If we consider the logistic equation for the wolf population: dN = rN (K-N) dt K which of the above factors accounts for the strongest impact on the moose population? A. K B. dN C. rN D. dt
 dt K. which of the above factors accounts for the strongest impact on the moose population A. K B. dN C. rN D. dt.")
64
Highly developed countries
Population characteristics Highly developed countries low birth rate low infant mortality low fertility rate long life expectancies high GNI PPP: GNI PPP per capita is the gross national income in purchasing power parity divided by mid-year population. TOTAL EARTH'S SURFACE = 197 million square miles = 510 million square kilometers TOTAL WATER SURFACE = 140 million square miles = 363 million square kilometers TOTAL LAND SURFACE = 57 million square miles =147 million square kilometers (From Colliers Encyclopedia) OF THE TOTAL AREA OF LAND SURF ACE OF EARTH: 57 million milcs2 x 640acrcs/square mile = 36,480,000,000 acres 2.5 acres to support one family (2 adults, 2 children) or acres per person From the January 1992 FAO Report (Food and Agriculture Organization of the United Nations) 11 % of land surface suitable for agriculture (22%) with appropriate irrigation and drainage 6% permafrost 10% too wet 22% too shallow 23% with chemical problem 28% too dry. TWO ASSUMPTIONS Only 11% of the land surface is suitable for agriculture. It takes acres of suitable land to support each person. TOTAL LAND SURFACE = 57 million square miles Total land suitable for agriculture = 57,000,000 miles2 x 0.11 = 6,270,000 square milcs = 6.27 million x 640 acres/mile2 = 4,012.8 million acres or 4 billion acres. At acres per person: million acres/person = million or about 6.4 billion people. Therefore, based on the above assumptions, the world can support about 6. 4 billion people In order to prevent heavy and unnecessary loss of human life at that population level: There will be no erosion or deterioration of the present available arable land. Everyone on earth will be vegetarian (no cattle). There will be no military and no war. Thcrc will be no population increase beyond 6.4 billion. There will be no pets (dogs or cats). There will be no insect pests. There will be no plant diseases. There will be no trains, boats, automobiles, RVs, ORVs, airplanes or other vehicles or machinery to necessitat~ exploiting resources or increasing global warming. There will be no use of agriculture lands to build cities. There will be no wealthy people, everyone will live at the very lowest level of subsistence. There will be no unusual or disastrous climatic changes. There will be no plagues or new diseases (heavy population density would facilitate extremely rapid spread of any disease).
 OF THE TOTAL AREA OF LAND SURF ACE OF EARTH: 57 million milcs2 x 640acrcs/square mile = 36,480,000,000 acres 2.5 acres to support one family (2 adults, 2 children) or acres per person. From the January 1992 FAO Report (Food and Agriculture Organization of the United Nations) 11 % of land surface suitable for agriculture (22%) with appropriate irrigation and drainage. 6% permafrost. 10% too wet. 22% too shallow. 23% with chemical problem. 28% too dry. TWO ASSUMPTIONS. Only 11% of the land surface is suitable for agriculture. It takes acres of suitable land to support each person. TOTAL LAND SURFACE = 57 million square miles. Total land suitable for agriculture = 57,000,000 miles2 x 0.11 = 6,270,000 square milcs = 6.27 million x 640 acres/mile2 = 4,012.8 million acres or 4 billion acres. At acres per person: million acres/person = million or about 6.4 billion people. Therefore, based on the above assumptions, the world can support about 6. 4 billion people In order to prevent heavy and unnecessary loss of human life at that population level: There will be no erosion or deterioration of the present available arable land. Everyone on earth will be vegetarian (no cattle). There will be no military and no war. Thcrc will be no population increase beyond 6.4 billion. There will be no pets (dogs or cats). There will be no insect pests. There will be no plant diseases. There will be no trains, boats, automobiles, RVs, ORVs, airplanes or other vehicles or machinery to necessitat~ exploiting resources or increasing global warming. There will be no use of agriculture lands to build cities. There will be no wealthy people, everyone will live at the very lowest level of subsistence. There will be no unusual or disastrous climatic changes. There will be no plagues or new diseases (heavy population density would facilitate extremely rapid spread of any disease).")
65
Population characteristics
Developing countries high birth rate high infant mortality high fertility rate short life expectancies low GNI PPP

66
China and India’s populations increasing
What trends do we see world-wide? China and India’s populations increasing

67
Birth rate decline lags behind as death rate decreases: e. g
Birth rate decline lags behind as death rate decreases: e.g. in Mexico, 1900–2000

68
Age structure influences population dynamics
Possible for country to have replacement-level fertility and still experience population growth Young age structure causes a positive population growth momentum as large pre-reproductive age group matures

69
15-to-40 range: reproductive rates are high
Age structure diagrams comparing Kenya to USA to Germany 15-to-40 range: reproductive rates are high

70
“Carrying-capacity" definition of overpopulation:
not population density, but #’s of people in an area relative to resources capacity to sustain human activities a condition of overpopulation might be corrected with no change in the number of people!

71
Ecological Footprint Developing countries tend to have people overpopulation that degrades the environment Developed countries have consumption overpopulation that degrades the environment

74
One week’s food costs the American family $341.98
USA & Mexico One week’s food supply. One week’s food costs the American family $341.98

75
One week’s food Egypt Ecuador

76
Above: Bhutan Below: Chad
One week’s food costs the Chad family $1.23

77
China has 22 % of world’s population
India has 17 % of world’s population Both nations are modernizing rapidly USA uses has 4.4% of the world population and uses 25% of world’s energy resources What happens to global resources when developing countries want to enjoy a developed nation lifestyle like ours? China's present population of 1.4 billion, despite the governmental policy of permitting only one child per couple, is still growing at an annual rate of 0.6 percent. Although China recognizes its serious overpopulation problem and recently passed legislation strengthening the policy, its young age structure means that the number of Chinese will continue to increase for another 50 years. India, with nearly 1.1 billion people (living on approximately one-third the land of either the United States or China), has a current population growth rate of 1.7 percent per year. This translates to a doubling time of 41 years. Taken together, the populations of China and India constitute more than one-third of the total world population.
, has a current population growth rate of 1.7 percent per year. This translates to a doubling time of 41 years. Taken together, the populations of China and India constitute more than one-third of the total world population.")
Similar presentations


 How many are in the population? 2) Are its numbers increasing.>")


 Sketch an exponential population growth curve and a logistic population growth curve. 2.What is an ecological footprint? 3.What.>")