Download presentation
Presentation is loading. Please wait.

2
Know the truth about education How do we know we are doing is what we need to do? How do we know we have the “best of the best?” How do we know it is “for the kids?” Are we spending what we should? What are we missing? Start with how are we doing globally?

4
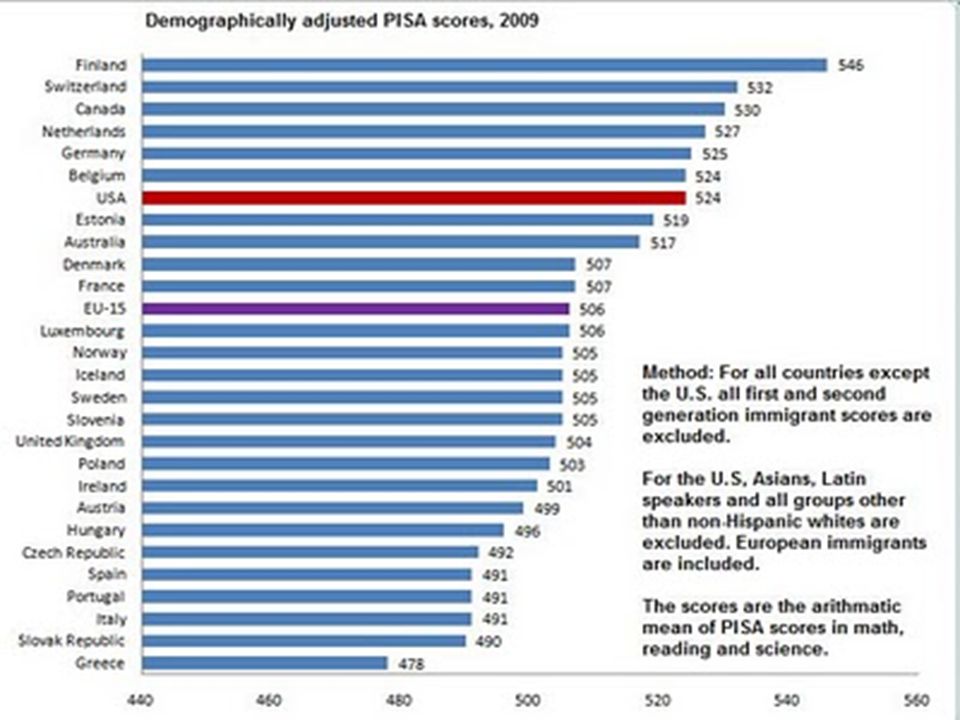
Program for International Student Assessment (PISA) 2009 PISA scores based on 60 other countries. Only 33 are industrialized. In Science 22 other countries did better than the US In Math 31 other countries did better than the US In Reading 14 other countries did better than the US

5
Another International Test Score (TIMSS) http://4brevard.com/choice/international-test-scores.htm speech by Pascal D. Forgione, Jr., Ph.D. U.S. Commissioner of Education Statistics speech Results of the Third International Mathematics and Science Study (TIMSS) involving a half-million students in 41 countries are authoritative. By the time our students are ready to leave high school - ready to enter higher education and the labor force - they are doing so badly with science they are significantly weaker than their peers in other countries. Our idea of "advanced" is clearly below international standards. There appears to be a consistent weakness in our teaching performance in physical sciences that becomes magnified over the years.
 involving a half-million students in 41 countries are authoritative. By the time our students are ready to leave high school - ready to enter higher education and the labor force - they are doing so badly with science they are significantly weaker than their peers in other countries. Our idea of advanced is clearly below international standards. There appears to be a consistent weakness in our teaching performance in physical sciences that becomes magnified over the years..")
6
Continued Results In short, the tests (TIMSS) showed U.S. fourth-graders performing poorly, middle school students worse, and high school students are unable to compete. By the same criteria used to say we were "average" in elementary school, "we appear to be "near the bottom" at the high school level. People have a tendency to think this picture is bleak but it doesn't apply to their own school. Chances are, even if your school compares well in SAT scores, it will still be a lightweight on an international scale.

7
http://www.thedailyriff.com/articles/why-other-countries-do-better-in-math-520.php http://www.thedailyriff.com/articles/why-other-countries-do-better-in-math-520.php Other Countries Do Better in Math For years, the U.S. has lagged behind other countries in math and science. A 2009 study showed that American students ranked 25th among 34 countries, behind nations like China, Singapore, South Korea, Hong Kong and Finland.A 2009 study showed _ http://www.huffingtonpost.com/2011/07/11/state-education-rankings-_n_894528.html WHY?

8
Spending?

9
Spending

11
Class size?

12
Global class sizes I. Many Asian countries score higher than the US in math and science yet have far higher class size. Hong Kong, Singapore, Japan have class sizes in the 30-38 US has class sized in the 23-28 range. http://nces.ed.gov/programs/digest/d11/tables/dt11_414.asp

14
Spending Grading on a Curve By Colleen Grady

15
State Education Rankings: The Best And Worst For Math And Science _http://www.huffingtonpost.com/2011/07/11/state-education-rankings-_n_894528.html

16
WOW most improved DDN Jan 2012 “Ohio schools boost ranking in 2 U.S. studies State showed improvement in national Quality Counts score”. According to the NCTQ, Ohio teachers earned a “C+” for 2011 in biennial report. The state had received a “D+” two years ago, making it one of the most improved states according to the most recent study. The Quality Counts index, as previously reported by the Dayton Daily News, put Ohio at 10th in the nation, with an overall grade of “C+.” The nation as a whole received a “C” from Quality Counts for 2011. The second performance study was conducted by the American Legislative Exchange Council. It was released last year and has Ohio coming in 21st for its K-12 performance, progress and reform.

17
Is Ohio’s Education System Really Number Five? When these metrics are examined more closely, a less than top ten performance emerges: Ohio’s ranking on the percent of schools where 8 th graders taking Algebra is the norm? Number 28. Ohio’s ranking on the number of students with high AP scores? Number 27. Percent of students achieving at advanced levels on the 8 th grade NAEP math exam? Ohio is ranked a stellar Number 33. Ohio’s education system is geared toward proficiency. Until we go beyond the mindset that mediocre equals excellent, Ohio will never be at the top of the rankings in a way that will benefit all of Ohio’s students – especially those who are already beyond proficient. http://highability.wordpress.com/2010/01/27/is-ohio%E2%80%99s-education-system-really-number-five

18
Current System Asks Too Little Because -- the successes which I just mentioned are actually based on minimums. What do I mean by minimums? These successes are based on a system that was designed in the 1980’s to measure whether students had at least an 8 th, 9 th and 10 th grade ability in basic subjects in order to graduate. These are not the skills which prepare students to be accepted to college without the need to take remedial coursework. Nor are they the skills needed to get a good paying job immediately after graduating high school. They are not adequately preparing students for either work or college in this new era.

19
Low Bar Proficient? ReadingMath 3 rd grade … 57-69%3 rd grade …. 58-79% 4 th grade... 47-76%4 th grade …. 48-71% 6 th grade … 35-60%6 th grade …. 40-57% 7 th grade … 45-65%7 th grade …. 32-57% OGT ReadingMath Advanced….. 79-100% Advanced…… 77-100% Accelerated….. 66-78% Accelerated….. 63-76% Proficient…… 43-65% Proficient….. 43-62% District needs 75% of their students to be Proficient to meet the indicator. http://www.oagc.com/files/OAGC_Grading_On_A_Curve_Final.pdf http://www.oagc.com/files/OAGC_Grading_On_A_Curve_Final.pdf

20
Excellence in Ohio: Reality, Illusion, or Cruel Hoax?

21
Are We Advanced? 42.8% 44.6% 51.7% 33.7% 9% 8% 3% 8%

22
Comparisons use ODE Use Cupp report (dated data) See Similar District reports Caution - comparing yourself to other failing systems. Medina 33% of students are Proficient or below. AYP was Met, passed 26 of the 26 indicators. Rated ED

23
When Students Matter Most ODE NAEP flat ACT flat College remediation up State assessment performance up There is a mismatch

24
2011 Letter Grade Ratings Current Rating Actual 2011 Distribution of LEA Ratings New Overall Letter- Grade Simulated 2011 Distribution of LEA Letter-Grades Excellent With Distinction 91 A22 Excellent 291 Effective 255B406 Continuous Improvement 133C195 Academic Watch 63D182 Academic Emergency 71F99

25
Why? There is little evidence that class sizes and teacher- student ratios have a consistent impact on students’ achievement. We have the resources/money We have the educated professionals Where are we going wrong? Keep this question open

26
College or Career Ready? No College required 72% 1973 No College required 38% 2018 Sources ODE & Georgetown Center on Education and the Workforce, 2010. Remedial Rates for In State students 33% of Medina graduates, stay in- State, need remedial courses to get into college (2011). State average is 41%
. State average is 41%.")
27
Medina 07-11’ Enrollment up 1.8 % 132 students (07’-11) While expenses/spending per pupil increased by +4.4%. Total Revenue per pupil went down by -2.2 % Staff FTE’s decreased by.4% 3 people System failure in fiscal response.

28
Forecast Assumptions Deficit spending an average of 3.5 M/yr more than revenue. Assumes that in the next 4 years +5 M more (12.3%) in Personnel Assumes that in the next 4 years +2.5 million more in HC and Retire (16%). Actual cost 10’-12’ went down. Assumes that Purchased Services will rise 800,000 (9.5%) in next 4 years. Actual last few years went down. 8.5M (12%) increase in expenses with declining 3.5M revenues.
 in Personnel Assumes that in the next 4 years +2.5 million more in HC and Retire (16%). Actual cost 10’-12’ went down. Assumes that Purchased Services will rise 800,000 (9.5%) in next 4 years. Actual last few years went down. 8.5M (12%) increase in expenses with declining 3.5M revenues..")
31
Examine further 07-11 Average Admin salary went up $8,285 in these 4 years Superintendent salary went up $20,000 Ave. Curriculum Specialist went up $8,524 Counselors ave. incomewent up $18,371 Librarian/Media income went up $1,225 Small group instructorswent up $9,000 while Medina Households income went up $454

32
Academic and Fiscal Failures Why does the system not have corrections? Why doesn’t the system use data to drive actions? Where are our elected officials? Isn’t this dereliction of duties?

33
Board is at the top of the org chart My experience, Board members are coached to do nothing, say nothing and not ask questions. OSBA- Workshop, conference, newsletters and updates. Tell BOE members to “be a cheerleader, and you are all one voice. Once the decision is made don’t speak against it. Let one person speak for the board”. See academic and fiscal results of this philosophy. Legal council/ORC Careful how you ask Q’s ODE =data problem a little old Super and Treas. Union How?=ULP

34
Ed Reform Priorities Get new coaches Get OSBLC We want to share the tools that make Children the focus of education spending. Need an understanding there is a business with a bottom line How do we know we need new coaches? 1. # of applicants, 2. pay 3. benefits

35
85% of budget is Pay and Benefits Base, Steps= 2 types Merit and Supplementals Consider- education level, hours worked, days off Private sector household 1.5 workers working 249 days 8 hours each- household, 4 weeks off = 2,988 hrs/yr District, 1 worker that works 187 – 15 sick days, 8 hours per day= 1376 hours/yr Community Medina HH 42,298 /2,988= $14/hr District Ave salary 53,347-6,000 /1376= $34/hr 2.5 X higher per hour 42% of Medina population have higher Ed degrees. 60% ( aprox.) of district staff has higher Ed degrees.
 of district staff has higher Ed degrees..")
36
What about Benefits Average Percentage of Premium Paid by Covered Workers for Single and Family Coverage, 1999-2010

37
Excellent example Jim Rigano and David Petroni Policies on 0 based budgeting no deficit spending.

38
Run for school board OSBLC Schools need help educating both the district employees and the communities Help by becoming a board member or Help those that run Help by asking questions Help by expressing yourself to the board, News papers, neighbors, and community.

39
Summary We have falsely and significantly inflated our education egos while ignoring the significant deficiencies we have in our education system. The public has largely been kept from the facts through manipulation and misrepresentation of the information released by public education systems. Unfortunately, all the money and information manipulation has resulted in a reduced academic outcome. It appears that “for the kids” was part of the manipulation. For the last 20+ years we have let our students down. Adults First system +++++ Children First Influencers to the decision makers in education seem to have convinced board members that their job is to protect employees first and then try to educate. Become an informed consumer and elect board members that will not be swayed by the influencers. Board members must remember that they are the boss and excellence in education is the product.

40
Continued Adult goods and services are fenced off in budgets and the children needs typically come after the fencing. The need to protect this way of operating cause the misinformation and voter manipulation we see today. Grade inflation comes from the need to perpetuate this untruth on the public. We are told that we need more money to continue to fund the quality we currently enjoy. Ask for the evidence and then find it yourself.

Similar presentations


 State School Fund Ways & Means Education Sub-Committee March 24, 2003 Pat Burk, Deputy Superintendent Brian Reeder,>")


Curriculum AccountabilitySilent Epidemic Standardized TestMagnet School Charter SchoolCapitalism.>")